
Market Overview
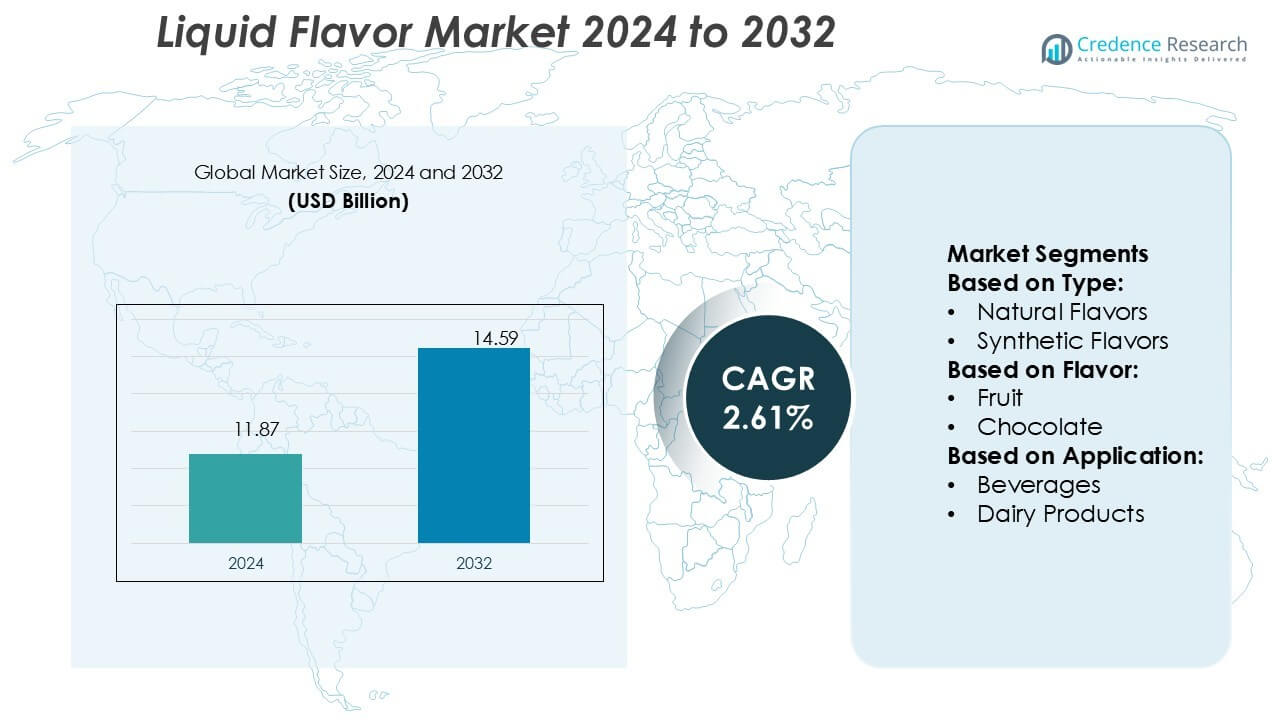
Liquid Flavor Market size was valued USD 11.87 billion in 2024 and is anticipated to reach USD 14.59 billion by 2032, at a CAGR of 2.61% during the forecast period.
| REPORT ATTRIBUTE | DETAILS |
|---|---|
| Historical Period | 2020-2023 |
| Base Year | 2024 |
| Forecast Period | 2025-2032 |
| Liquid Flavor Market Size 2024 | USD 11.87 billion |
| Liquid Flavor Market, CAGR | 2.61% |
| Liquid Flavor Market Size 2032 | USD 14.59 Billion |
The liquid flavor market features strong competition from global leaders such as Givaudan S.A., Symrise AG, Kerry Group plc, International Flavors and Fragrances (IFF), Sensient Technologies, Frutarom, MANE Flavor & Fragrance Manufacturer, Gold Coast Ingredients, McCormick & Company, Inc., and Natures Flavors, Inc. These players emphasize product innovation, natural ingredient sourcing, and strategic expansion to address evolving consumer preferences across beverages, dairy, and confectionery sectors. North America leads the market with a 34% share in 2024, supported by advanced food processing industries, high consumer demand for premium flavors, and increasing adoption of clean-label and plant-based solutions.
Market Insights
- The liquid flavor market was valued at USD 11.87 billion in 2024 and is projected to reach USD 14.59 billion by 2032, registering a CAGR of 2.61%.
- Growing demand for natural and clean-label ingredients drives market expansion, particularly in beverages and dairy applications, where natural flavors dominate with 58% share.
- Trends highlight rising popularity of exotic fruit and botanical flavors, alongside technological advancements like microencapsulation that enhance flavor stability and intensity.
- The market is competitive, with leading companies focusing on innovation, sustainable sourcing, and acquisitions to strengthen global presence, while high production costs of natural flavors act as a restraint.
- Regionally, North America leads with 34% share in 2024, supported by mature food processing industries and strong clean-label demand, while Asia-Pacific follows closely with 29% share, fueled by rapid urbanization, growing middle-class populations, and increased consumption of flavored beverages and confectionery across emerging economies.
Market Segmentation Analysis:
By Type
The liquid flavor market by type is led by natural flavors, which account for 58% of the total market share in 2024. Demand for natural flavors is driven by consumer preference for clean-label and plant-based ingredients, particularly in beverages and dairy categories. Manufacturers increasingly invest in botanical extracts and fermentation-derived solutions to replace synthetic alternatives, aligning with regulatory pushes for healthier food formulations. Synthetic flavors continue to serve cost-sensitive applications, but growth is slower compared to natural variants due to rising health awareness and evolving consumer taste expectations.
- For instance, ICL introduced eqo.x, a biodegradable controlled-release coating for urea that boosts nutrient use efficiency by up to 80%, degrades faster, and provides predictable nutrient release for open-field applications.
By Flavor
Among flavors, fruit dominates with a 42% share of the liquid flavor market in 2024, supported by its broad application across beverages, confectionery, and dairy products. Growth is fueled by increasing demand for tropical and exotic fruit flavors in emerging markets and the expanding use of fruit-based concentrates in functional beverages. Chocolate and vanilla follow, with strong penetration in bakery and confectionery applications, while nut and caramel flavors capture niche but growing demand in premium snacks and desserts. The appeal of fruit-based flavors remains unmatched due to their versatility and natural association with health and freshness.
- For instance, AmeriGas, a part of UGI Corporation, operates a vast network across the United States. Recent UGI financial filings confirm a network of approximately 1,360 propane distribution locations serving customers across the country.
By Application
Beverages represent the dominant application segment, holding 46% of the liquid flavor market in 2024. Rising consumption of flavored soft drinks, energy beverages, and ready-to-drink teas drives this share, with fruit-based flavors playing a key role. The dairy sector also registers steady demand, especially in flavored milk and yogurt, while bakery and confectionery continue to leverage chocolate and vanilla. Savory and snack applications are expanding with nut and caramel flavors gaining traction in premium offerings. Beverage innovation and consumer inclination toward refreshing, flavored drinks will remain the primary growth driver for this segment.
Key Growth Drivers
Rising Demand for Natural and Clean-Label Ingredients
The liquid flavor market is expanding as consumers increasingly prefer natural and clean-label ingredients over synthetic options. Growing awareness about food safety, health, and sustainability has strengthened the demand for plant-derived and botanical-based flavors. Food and beverage brands are reformulating products with natural extracts to meet clean-label requirements, boosting the segment’s adoption. Regulatory pressure on artificial additives further accelerates this transition, positioning natural flavors as the primary growth driver across beverages, dairy, and confectionery applications.
- For instance, Nutrien’s retail arm markets its Riser® in-furrow nutrition system for row crops, which applies micronutrient blends (e.g., zinc, boron) at a rate of 2.0 to 5.0 gallons (approximately 7.6 to 18.9 liters) per acre along with base fertilizer, ensuring forage or feed crops receive balanced nutrition early in growth.
Expansion of the Functional Beverages and Dairy Sector
The surge in functional beverages, including energy drinks, flavored waters, and plant-based alternatives, fuels significant demand for liquid flavors. These products rely heavily on fruit, vanilla, and herbal notes to enhance taste and consumer appeal. Similarly, the dairy industry leverages flavors for innovation in yogurt, flavored milk, and cheese products. Rising global health consciousness and increased spending on nutritional drinks ensure consistent flavor use. Manufacturers are aligning portfolios with wellness-oriented launches, creating long-term growth opportunities within beverage and dairy applications.
- For instance, during a pilot program in Western Australia, CSBP, in partnership with Telstra, installed more than 150 IoT sensors on the fertilizer storage tanks of 26 growers.
Innovation in Flavor Customization and Technology
Advancements in flavor formulation and delivery systems drive market growth by enabling customization for regional tastes and niche segments. Microencapsulation and fermentation technologies allow manufacturers to enhance stability, intensity, and shelf life of liquid flavors. Growing interest in personalized nutrition also encourages companies to develop targeted flavor solutions for different demographics. Customizable flavor profiles, supported by advanced R&D, help brands cater to evolving consumer preferences. This innovation not only improves product acceptance but also enhances brand differentiation in competitive markets.
Key Trends & Opportunities
Shift Toward Exotic and Functional Flavors Exotic fruit flavors such as passion fruit, dragon fruit, and lychee are gaining traction, particularly in beverages and confectionery. Alongside, functional flavors linked to wellness-such as botanicals, herbal extracts, and spices-are seeing strong uptake. This shift caters to consumer demand for novel taste experiences and health benefits in a single product. The trend creates opportunities for brands to diversify portfolios and capture premium segments by offering unique, health-oriented liquid flavor formulations.
- For instance, Compo Expert began sourcing 25 % of its ammonia demand in low-carbon form from Q2 2024, a measure projected to avoid 15,000 tonnes CO₂ emissions annually.
Growth of E-commerce and Direct-to-Consumer Channels
The expansion of online retail and direct-to-consumer platforms provides new opportunities for liquid flavor manufacturers. Smaller flavor brands and artisanal producers can now directly engage consumers with customized offerings, particularly in bakery kits, DIY beverages, and home cooking solutions. Digital platforms also enable faster feedback loops, guiding product innovation in line with consumer preferences. As consumers increasingly explore specialty flavors online, e-commerce emerges as a key growth avenue for both established players and emerging startups in the liquid flavor industry.
- For instance, IFFCO’s cloud-based IFFCO Kisan Uday platform now manages data for 2,500 IFFCO Kisan drones, enabling farmers to book, view, and control nano-fertilizer spraying operations in real time.
Key Challenges
High Production Costs for Natural Flavors
While natural flavors dominate demand, their production involves high costs due to sourcing complexity, limited raw material availability, and intensive extraction methods. Seasonal variability of raw materials, such as fruits and botanicals, also impacts price stability and supply consistency. These challenges often translate into premium pricing, limiting affordability in cost-sensitive markets. Balancing demand for natural, clean-label solutions with sustainable and scalable production remains a significant obstacle for manufacturers seeking long-term growth.
Stringent Regulatory Frameworks and Compliance Issues
The liquid flavor industry faces strict regulations governing ingredient use, labeling, and safety standards across regions. Compliance with frameworks such as FDA, EFSA, and FSSAI requires continuous reformulation, testing, and documentation, increasing operational complexities. Differences in regional standards also create barriers for global trade and new product launches. Non-compliance risks legal challenges, reputational damage, and product recalls, making regulatory adherence a critical challenge. Manufacturers must invest heavily in R&D and quality assurance to navigate these hurdles effectively.
Regional Analysis
North America
North America holds a 34% share of the liquid flavor market in 2024, making it the leading regional contributor. Strong consumer demand for flavored beverages, dairy products, and confectionery drives growth across the United States and Canada. The region benefits from well-established food processing industries and high spending on premium and clean-label products. Natural fruit and vanilla flavors dominate due to rising health awareness, while innovative chocolate and nut flavors expand in the bakery segment. Continuous R&D investments, coupled with strong regulatory frameworks supporting clean-label trends, position North America as a mature yet innovation-driven market.
Europe
Europe accounts for 27% of the liquid flavor market in 2024, supported by the region’s strong bakery, dairy, and confectionery industries. Germany, France, and the UK lead consumption, with significant demand for chocolate, vanilla, and caramel flavors in bakery applications. Rising consumer preference for natural and organic ingredients boosts adoption of plant-based flavors. Regulatory frameworks such as EFSA guidelines further encourage clean-label formulations. Innovation in functional beverages and premium snacks continues to create growth opportunities. Europe remains a competitive market with established flavor houses introducing customized solutions aligned with regional taste profiles and sustainability priorities.
Asia-Pacific
Asia-Pacific commands a 29% share of the liquid flavor market in 2024, emerging as the fastest-growing region. High population density, rising disposable incomes, and urbanization drive demand for flavored beverages, dairy products, and confectionery. China, India, and Japan lead consumption, with strong adoption of fruit and exotic flavors. Rapid growth in ready-to-drink beverages and functional products also boosts flavor usage. Local and global manufacturers invest heavily in expanding portfolios and production capacities to meet rising demand. Asia-Pacific’s focus on innovation and evolving consumer tastes positions it as a key growth engine in the global market.
Latin America
Latin America holds a 6% share of the liquid flavor market in 2024, with Brazil and Mexico driving regional growth. Beverages and confectionery remain primary application areas, with fruit and caramel flavors witnessing strong demand. The market is supported by a growing middle-class population and increasing interest in flavored dairy products and snacks. However, limited purchasing power and higher costs of natural flavors restrain faster growth. Despite these challenges, regional manufacturers are introducing cost-effective formulations while multinational players invest in local production facilities. Latin America’s flavor market shows steady potential, particularly in fruit-forward beverage categories.
Middle East & Africa
The Middle East & Africa represent 4% of the liquid flavor market in 2024, with gradual expansion across beverages and bakery applications. Countries such as the UAE and South Africa are leading adopters, driven by demand for flavored dairy, juices, and confectionery products. Fruit and vanilla flavors dominate, supported by rising youth populations and shifting dietary habits. Limited local production capacity and dependency on imports remain challenges, impacting affordability of premium natural flavors. However, growing interest in innovative and exotic flavor profiles, coupled with urbanization trends, creates opportunities for future growth across this emerging regional market.
Market Segmentations:
By Type:
- Natural Flavors
- Synthetic Flavors
By Flavor:
- Fruit
- Chocolate
By Application:
- Beverages
- Dairy Products
By Geography
- North America
- U.S.
- Canada
- Mexico
- Europe
- Germany
- France
- U.K.
- Italy
- Spain
- Rest of Europe
- Asia Pacific
- China
- Japan
- India
- South Korea
- South-east Asia
- Rest of Asia Pacific
- Latin America
- Brazil
- Argentina
- Rest of Latin America
- Middle East & Africa
- GCC Countries
- South Africa
- Rest of the Middle East and Africa
Competitive Landscape
The liquid flavor market is highly competitive, with key players including MANE Flavor & Fragrance Manufacturer, Sensient Technologies, McCormick & Company, Inc., Symrise AG, Gold Coast Ingredients, International Flavors and Fragrances (IFF), Givaudan S.A., Natures Flavors, Inc., Frutarom, and Kerry Group plc. The liquid flavor market is characterized by intense competition, driven by innovation, sustainability, and evolving consumer preferences. Companies are focusing on expanding portfolios of natural and clean-label flavors to meet rising demand in beverages, dairy, and confectionery. Technological advancements such as microencapsulation and fermentation enhance flavor stability, shelf life, and intensity, providing a competitive edge. Market participants are also investing in regional expansion, particularly in Asia-Pacific, to capture high-growth opportunities. Strategic mergers, acquisitions, and partnerships remain common approaches to strengthen market presence, diversify offerings, and cater to niche applications with tailored flavor solutions.
Key Player Analysis
- MANE Flavor & Fragrance Manufacturer
- Sensient Technologies
- McCormick & Company, Inc.
- Symrise AG
- Gold Coast Ingredients
- International Flavors and Fragrances (IFF)
- Givaudan S.A.
- Natures Flavors, Inc.
- Frutarom
- Kerry Group plc
Recent Developments
- In January 2025, McCormick & Company unveiled Aji Amarillo as its Flavour of the Year, highlighting the pepper's fruity, tropical notes with moderate heat. This selection reflects the company's commitment to exploring diverse global flavours and catering to evolving consumer tastes.
- In September 2024, The Hershey Company declared a new addition to its Kit Kat lineup: Kit Kat Vanilla. The brand's new flavor features crisp wafers enrobed in vanilla-flavored crème. It is now available in standard and king sizes at retailers nationwide.
- In March 2024, Essentia Water is taking hydration to the next level with Essentia Hydroboost, the brand’s first-ever flavored and functional water innovation designed to keep customers hydrated while pursuing their goals.
- In August 2023, Döhler has disclosed its acquisition of Boon Flavors, s part of this acquisition, Boon Flavors will be known as Döhler Thailand going forward and be managed by its founder, Piya Boonnamkitsawad.
Report Coverage
The research report offers an in-depth analysis based on Type, Flavor, Application and Geography. It details leading market players, providing an overview of their business, product offerings, investments, revenue streams, and key applications. Additionally, the report includes insights into the competitive environment, SWOT analysis, current market trends, as well as the primary drivers and constraints. Furthermore, it discusses various factors that have driven market expansion in recent years. The report also explores market dynamics, regulatory scenarios, and technological advancements that are shaping the industry. It assesses the impact of external factors and global economic changes on market growth. Lastly, it provides strategic recommendations for new entrants and established companies to navigate the complexities of the market.
Future Outlook
- The demand for natural and clean-label liquid flavors will continue to rise.
- Beverages will remain the leading application segment with strong innovation potential.
- Functional and fortified drinks will drive higher adoption of fruit and botanical flavors.
- Dairy products will expand flavor use in yogurt, flavored milk, and plant-based alternatives.
- Advanced technologies like microencapsulation will improve flavor stability and delivery.
- Exotic and ethnic flavor profiles will gain popularity across global markets.
- Sustainability in sourcing and production will shape competitive strategies.
- E-commerce will create new growth channels for niche and specialty flavors.
- Regulatory frameworks will increasingly favor natural and plant-derived ingredients.
- Emerging markets will fuel growth through rising urbanization and changing consumer diets.

Request a Free Sample
Fill in your details and we'll send you a free sample report.
- Sample data tables & charts
- Research methodology
Market Dynamics
Preference for Natural and Clean-Label Ingredients
Consumers are increasingly seeking products with natural and plant-based ingredients, driving manufacturers to reformulate with botanical extracts and fermentation-derived flavors. Regulatory pressures and health awareness are accelerating the shift from synthetic to natural flavors, especially in beverages and dairy.
Expansion of Functional Beverages and Dairy Sector
The rise of functional drinks, flavored waters, and plant-based dairy alternatives is boosting demand for liquid flavors, particularly fruit, vanilla, and herbal notes. These sectors rely on innovative flavor solutions to enhance taste and meet consumer expectations for health and wellness.
Innovation in Flavor Customization and Technology
Advancements such as microencapsulation and fermentation technologies are enabling more stable, intense, and customizable liquid flavors. This allows brands to cater to regional preferences and niche markets, supporting product differentiation and acceptance.
Growth of E-commerce and Direct-to-Consumer Channels
Online retail platforms are making it easier for both established and artisanal flavor producers to reach consumers directly, enabling customized offerings and rapid feedback. This trend is expanding market access and driving innovation in specialty and DIY flavor products.
Rising Popularity of Exotic and Functional Flavors
Consumer interest in novel taste experiences and health benefits is fueling demand for exotic fruit, botanical, and functional flavors. This creates opportunities for brands to diversify portfolios and capture premium segments with unique, health-oriented liquid flavor formulations.
Need a Custom Version of This Report?
Tailor the scope, geography, or segments to your exact requirements.
- Custom geography or segment scope
- Direct access to our analyst team
Frequently Asked Questions
What is the current market size for Liquid Flavor Market, and what is its projected size in 2032?
At what Compound Annual Growth Rate is the Liquid Flavor Market projected to grow between 2025 and 2032?
3. Natural flavors held the largest share with 58% in 2024.Which Liquid Flavor Market segment held the largest share in 2024?
What are the primary factors fueling the growth of the Liquid Flavor Market?
Who are the leading companies in the Liquid Flavor Market?
Which region commanded the largest share of the Liquid Flavor Market in 2024?
Table of Content
Chapter 1 Market Segmentation
- 1.1 Segmentation Framework
- 1.1.1 Product and Service Classification
- 1.1.2 Application and End-Use Classification
- 1.1.3 Technology and Solution Classification
- 1.1.4 Customer and Distribution Channel Classification
- 1.1.5 Geographic Segmentation
- 1.1.6 Market Segment Definitions and Boundaries
- 1.2 By Type
- 1.2.1 Natural Flavors
- 1.2.2 Synthetic Flavors
- 1.3 By Flavor
- 1.3.1 Fruit
- 1.3.2 Chocolate
- 1.3.3 Vanilla
- 1.3.4 Nut
- 1.3.5 Caramel
- 1.3.6 Botanical/Herbal
- 1.4 By Application
- 1.4.1 Beverages
- 1.4.2 Dairy Products
- 1.4.3 Bakery & Confectionery
- 1.4.4 Savory & Snacks
- 1.4.5 Others
Chapter 2 Introduction
- 2.1 Report Objectives and Scope
- 2.2 Product Definition and Industry Terminology
- 2.3 Market Inclusions and Exclusions
- 2.4 Research Process
- 2.4.1 Primary Research and Expert Interviews
- 2.4.2 Secondary Research and Source Review
- 2.4.3 Top-Down and Bottom-Up Estimation
- 2.4.4 Data Triangulation and Verification
- 2.5 Market Size Measurement Basis
- 2.5.1 2024: USD 11.87 billion → 2032: USD 14.59 billion
- 2.6 Historical and Forecast Reference Periods
- 2.6.1 Base Year: 2024
- 2.6.2 Forecast Period: 2024-2032
- 2.7 Research Assumptions and Limitations
Chapter 3 Executive Summary
- 3.1 Market Snapshot and Key Findings
- 3.2 Base-Year Market Size, 2024
- 3.3 Forecast Market Size, 2032
- 3.4 Revenue and Volume Growth Outlook
- 3.5 Key Demand and Supply Indicators
- 3.6 Leading Market Segments
- 3.7 Fastest-Growing Market Opportunities
- 3.8 Regional Performance Highlights
- 3.9 Technology and Industry Transformation
- 3.10 Competitive Landscape Summary
- 3.11 Analyst View and Strategic Implications
Chapter 4 Global Liquid Flavor Market Trends and Developments
- 4.1 Historical Industry Development
- 4.2 Recent Market Trends and Developments
- 4.3 Demand and Customer Behavior Trends
- 4.4 Technology and Product Innovation
- 4.5 Artificial Intelligence, Automation and Digitalization
- 4.6 Local Manufacturing and Supply Chain Realignment
- 4.7 Industry Partnerships, Mergers and Acquisitions
- 4.8 Sustainability and Circular Economy Developments
- 4.9 Government and Private Sector Investment Trends
- 4.10 Emerging Business Models and Commercialization
- 4.11 Industry Developments and Announcements
Chapter 5 Global Liquid Flavor Market Production, Supply and Demand Analysis
- 5.1 Demand Trend and Consumption Analysis
- 5.2 Demand Forecast, 2024-2032
- 5.3 Production and Output Trend
- 5.4 Production and Output Forecast, 2024-2032
- 5.5 Installed Capacity and Capacity Utilization
- 5.6 Company-Wise Production Plants and Statistics
- 5.6.1 Installed Production Capacity
- 5.6.2 Actual Production
- 5.6.3 Planned Capacity and Expansion Targets
- 5.7 Supply Chain Structure and Procurement Trends
- 5.8 Supply-Demand Gap and Bottlenecks
- 5.9 Import Dependence and Sourcing Structure
- 5.10 Contract Manufacturing and Outsourcing
- 5.11 Regional Supply and Demand Concentration
Chapter 6 Global Liquid Flavor Market Pricing Analysis
- 6.1 Pricing Structure and Measurement
- 6.2 Historical Pricing Trends
- 6.3 Pricing Outlook, 2024-2032
- 6.4 Average Selling Price and Unit Economics
- 6.5 Pricing by Product and Market Segment
- 6.6 Geographic Pricing Differences
- 6.7 Key Input, Energy, Labor and Logistics Costs
- 6.8 Contract Pricing and Purchasing Models
- 6.9 Pricing Sensitivity and Competitive Positioning
- 6.10 Price, Margin and Profitability Implications
Chapter 7 Global Liquid Flavor Market Dynamics
- 7.1 Market Growth Drivers
- 7.1.1 Demand-Side Drivers
- 7.1.2 Technology and Innovation Drivers
- 7.1.3 Infrastructure and Investment Drivers
- 7.1.4 Regulatory and Policy Drivers
- 7.2 Market Restraints
- 7.2.1 Cost and Affordability Constraints
- 7.2.2 Technology and Adoption Barriers
- 7.2.3 Supply Chain and Operational Constraints
- 7.3 Market Challenges
- 7.3.1 Competitive Pressure and Margin Erosion
- 7.3.2 Skills, Infrastructure and Implementation Gaps
- 7.4 Emerging Market Opportunities
- 7.5 Market Dynamics Impact and Time-Horizon Assessment
Chapter 8 Global Liquid Flavor Value Chain Analysis
- 8.1 Industry Value Chain Overview
- 8.2 Upstream Suppliers and Critical Inputs
- 8.3 Technology and Component Providers
- 8.4 Manufacturing or Service Delivery
- 8.5 Distribution, Channel Partners and Integrators
- 8.6 Downstream Applications and End Users
- 8.7 Value Addition and Profit Pools
- 8.8 Vertical Integration and Outsourcing
- 8.9 Supplier Concentration and Risk
- 8.10 Supply Chain Localization and Resilience
Chapter 9 Global Liquid Flavor Market Regulations and Policies
- 9.1 Relevant Laws, Standards and Compliance Frameworks
- 9.2 Product, Service, Safety and Quality Requirements
- 9.3 Government Policies, Incentives and Subsidies
- 9.4 Imports, Exports and Trade Barriers
- 9.5 Public Procurement and Local Content Requirements
- 9.6 Environmental and Sustainability Compliance
- 9.7 Upcoming Policy Changes and Market Implications
Chapter 10 Global Liquid Flavor Market Hotspots and Opportunities
- 10.1 Market Opportunity Mapping and Growth Hotspots
- 10.2 High-Growth Applications and Customer Groups
- 10.3 Underserved Markets and White-Space Opportunities
- 10.4 Emerging Technology and Product Opportunities
- 10.5 New Capacity and Investment Hotspots
- 10.6 Market Entry and Expansion Opportunities
- 10.7 Distribution and Partnership Opportunities
- 10.8 Near-Term and Long-Term Commercial Potential
- 10.9 Opportunity Attractiveness and Execution Risks
Chapter 11 Global Liquid Flavor Market Outlook, 2024-2032
- 11.1 Market Size and Analysis
- 11.1.1 Revenue (Market Measurement: 2024: USD 11.87 billion → 2032: USD 14.59 billion)
- 11.1.2 Market Volume and Quantity Sold
- 11.1.3 Historical Market Size
- 11.1.4 Base-Year Market Size, 2024
- 11.2 Market Forecast, 2024-2032
- 11.2.1 Revenue Forecast to 2032
- 11.2.2 Volume Forecast to 2032
- 11.2.3 CAGR and Year-on-Year Growth
- 11.2.4 Incremental Revenue Opportunity
- 11.3 Forecast Assumptions and Scenario Analysis
- 11.3.1 Base-Case Forecast
- 11.3.2 Optimistic and Conservative Scenarios
- 11.3.3 Technology, Pricing and Policy Sensitivities
- 11.4 Market Attractiveness and Growth Outlook
Chapter 12 Global Liquid Flavor Market Segmentation and Outlook
- 12.1 Segmentation Summary and Market Shares, 2024
- 12.2 Largest and Fastest-Growing Segments
- 12.3 By Type - Market Size and Forecast, 2024-2032
- 12.3.1 Segment Definition and Scope
- 12.3.2 Historical Market Size
- 12.3.3 Revenue Forecast, 2024-2032
- 12.3.4 Volume Forecast, 2024-2032
- 12.3.5 Base-Year Market Share, 2024
- 12.3.6 Segment CAGR and Growth Drivers
- 12.3.7 Subsegment Market Size and Forecast
- 12.3.7.1 Natural Flavors
- 12.3.7.2 Synthetic Flavors
- 12.3.8 Subsegment Pricing and Adoption Trends
- 12.3.9 Leading Suppliers and Competition
- 12.3.10 Regional Demand and Opportunities
- 12.4 By Flavor - Market Size and Forecast, 2024-2032
- 12.4.1 Segment Definition and Scope
- 12.4.2 Historical Market Size
- 12.4.3 Revenue Forecast, 2024-2032
- 12.4.4 Volume Forecast, 2024-2032
- 12.4.5 Base-Year Market Share, 2024
- 12.4.6 Segment CAGR and Growth Drivers
- 12.4.7 Subsegment Market Size and Forecast
- 12.4.7.1 Fruit
- 12.4.7.2 Chocolate
- 12.4.7.3 Vanilla
- 12.4.7.4 Nut
- 12.4.7.5 Caramel
- 12.4.7.6 Botanical/Herbal
- 12.4.8 Subsegment Pricing and Adoption Trends
- 12.4.9 Leading Suppliers and Competition
- 12.4.10 Regional Demand and Opportunities
- 12.5 By Application - Market Size and Forecast, 2024-2032
- 12.5.1 Segment Definition and Scope
- 12.5.2 Historical Market Size
- 12.5.3 Revenue Forecast, 2024-2032
- 12.5.4 Volume Forecast, 2024-2032
- 12.5.5 Base-Year Market Share, 2024
- 12.5.6 Segment CAGR and Growth Drivers
- 12.5.7 Subsegment Market Size and Forecast
- 12.5.7.1 Beverages
- 12.5.7.2 Dairy Products
- 12.5.7.3 Bakery & Confectionery
- 12.5.7.4 Savory & Snacks
- 12.5.7.5 Others
- 12.5.8 Subsegment Pricing and Adoption Trends
- 12.5.9 Leading Suppliers and Competition
- 12.5.10 Regional Demand and Opportunities
- 12.6 Segment Growth Comparison
- 12.7 Segment Attractiveness and Priority Matrix
Chapter 13 Global Liquid Flavor End-Use and Application Market Outlook
- 13.1 End-Use Industry and Customer Demand Structure
- 13.2 Leading Applications and Customer Groups
- 13.3 End-Use Market Size, Share and Forecast
- 13.4 Major End-Use Industry Deep Dives
- 13.4.1 Customer Requirements and Use Cases
- 13.4.2 Demand and Replacement Cycles
- 13.4.3 Technical and Regulatory Considerations
- 13.4.4 Purchasing and Procurement Models
- 13.4.5 Leading Vendors and Distribution Channels
- 13.4.6 Forecast and Commercial Opportunities
- 13.5 Emerging Applications and Cross-Segment Demand
- 13.6 End-Use Industry Investment Priorities
Chapter 14 Global Liquid Flavor Geographic Market Outlook, 2024-2032
- 14.1 Regional Market Size and Share, 2024
- 14.2 Regional Market Forecast, 2024-2032
- 14.3 Regional Pricing, Production and Demand Differences
- 14.4 North America
- 14.4.1 United States
- 14.4.2 Canada
- 14.4.3 Mexico
- 14.5 Europe
- 14.5.1 Germany
- 14.5.2 France
- 14.5.3 Italy
- 14.5.4 United Kingdom
- 14.5.5 Spain
- 14.5.6 Poland
- 14.5.7 Russia
- 14.5.8 Netherlands
- 14.5.9 Belgium
- 14.5.10 Sweden
- 14.5.11 Denmark
- 14.5.12 Norway
- 14.5.13 Rest of Europe
- 14.6 Asia Pacific
- 14.6.1 China
- 14.6.2 India
- 14.6.3 Japan
- 14.6.4 South Korea
- 14.6.5 Thailand
- 14.6.6 Indonesia
- 14.6.7 Vietnam
- 14.6.8 Malaysia
- 14.6.9 Australia
- 14.6.10 Rest of Asia Pacific
- 14.7 Latin America
- 14.7.1 Brazil
- 14.7.2 Argentina
- 14.7.3 Colombia
- 14.7.4 Chile
- 14.7.5 Rest of Latin America
- 14.8 Middle East
- 14.8.1 Saudi Arabia
- 14.8.2 United Arab Emirates
- 14.8.3 Turkey
- 14.8.4 Israel
- 14.8.5 Iran
- 14.8.6 Rest of the Middle East
- 14.9 Africa
- 14.9.1 South Africa
- 14.9.2 Egypt
- 14.9.3 Nigeria
- 14.9.4 Morocco
- 14.9.5 Rest of Africa
- 14.10 Regional Investment, Policy and Supply Chain Differences
- 14.11 Regional Competitive Landscape
- 14.12 Geographic Growth Hotspots
Chapter 15 Global Liquid Flavor Technology, Innovation and Sustainability Outlook
- 15.1 Technology Landscape and Maturity
- 15.2 Product, Process and Service Innovation
- 15.3 AI, Automation and Digital Tools in the Industry
- 15.4 Technology Adoption and Performance Benchmarking
- 15.5 Innovation Pipeline and R&D Investment
- 15.6 Patent and Intellectual Property Trends
- 15.7 Energy Efficiency and Resource Management
- 15.8 Sustainability, Recycling and Circularity
- 15.9 Technology Roadmap, 2024-2032
- 15.10 Risks of Obsolescence and Technology Substitution
Chapter 16 Global Liquid Flavor Market Key Strategic Imperatives
- 16.1 Growth and Market Entry Priorities
- 16.2 High-Return Products and Segments
- 16.3 Pricing, Profitability and Cost Optimization
- 16.4 Technology Investment and Product Differentiation
- 16.5 Supply Chain Localization and Resilience
- 16.6 Distribution and Customer Acquisition
- 16.7 Partnership, Acquisition and Capacity Strategy
- 16.8 Regional Expansion Priorities
- 16.9 Short-, Medium- and Long-Term Actions
Chapter 17 Competition Outlook
- 17.1 Industry Competition Characteristics
- 17.2 Market Structure and Concentration
- 17.3 Market Share and Competitive Positioning, 2024
- 17.4 Company-Wise Revenue and Product Benchmarking
- 17.5 Production and Service Capacity Benchmarking
- 17.6 Technology, Pricing and Differentiation
- 17.7 Regional Footprint and Distribution Strength
- 17.8 Mergers, Acquisitions and Strategic Alliances
- 17.9 New Entrants and Competitive Threats
- 17.10 Porter's Five Forces and Industry Attractiveness
- 17.11 Competitive Outlook, 2024-2032
Chapter 18 Company Profiles
- 18.1 Company Coverage and Selection Criteria
- 18.2 Givaudan S.A.
- 18.2.1 Business Description
- 18.2.2 Company Ownership and Geographic Presence
- 18.2.3 Product and Service Portfolio
- 18.2.4 Manufacturing and Operating Footprint
- 18.2.5 Production Capacity and Expansion Plans
- 18.2.6 Financial Performance and Investment
- 18.2.7 Market Share and Competitive Position
- 18.2.8 Technology and Innovation Capabilities
- 18.2.9 Strategic Alliances or Partnerships
- 18.2.10 Recent Developments
- 18.2.11 Growth Strategy and Outlook
- 18.3 Symrise AG
- 18.4 Kerry Group plc
- 18.5 International Flavors and Fragrances (IFF)
- 18.6 Sensient Technologies
- 18.7 Frutarom
- 18.8 MANE Flavor & Fragrance Manufacturer
- 18.9 Gold Coast Ingredients
- 18.10 McCormick & Company, Inc.
- 18.11 Natures Flavors, Inc.
- 18.12 Other Relevant Market Participants
Note: Every listed company is profiled on the structure shown under the first company. The company list is preliminary and may change based on research findings, market developments, data availability and client requirements.
Chapter 19 Disclaimer
- 19.1 Research and Forecast Disclaimer
- 19.2 Data Source and Estimation Limitations
Note: The depth of individual sections depends on data availability for this market. Volume, capacity, trade and other unit-based metrics are included where applicable.

