
Market Overview
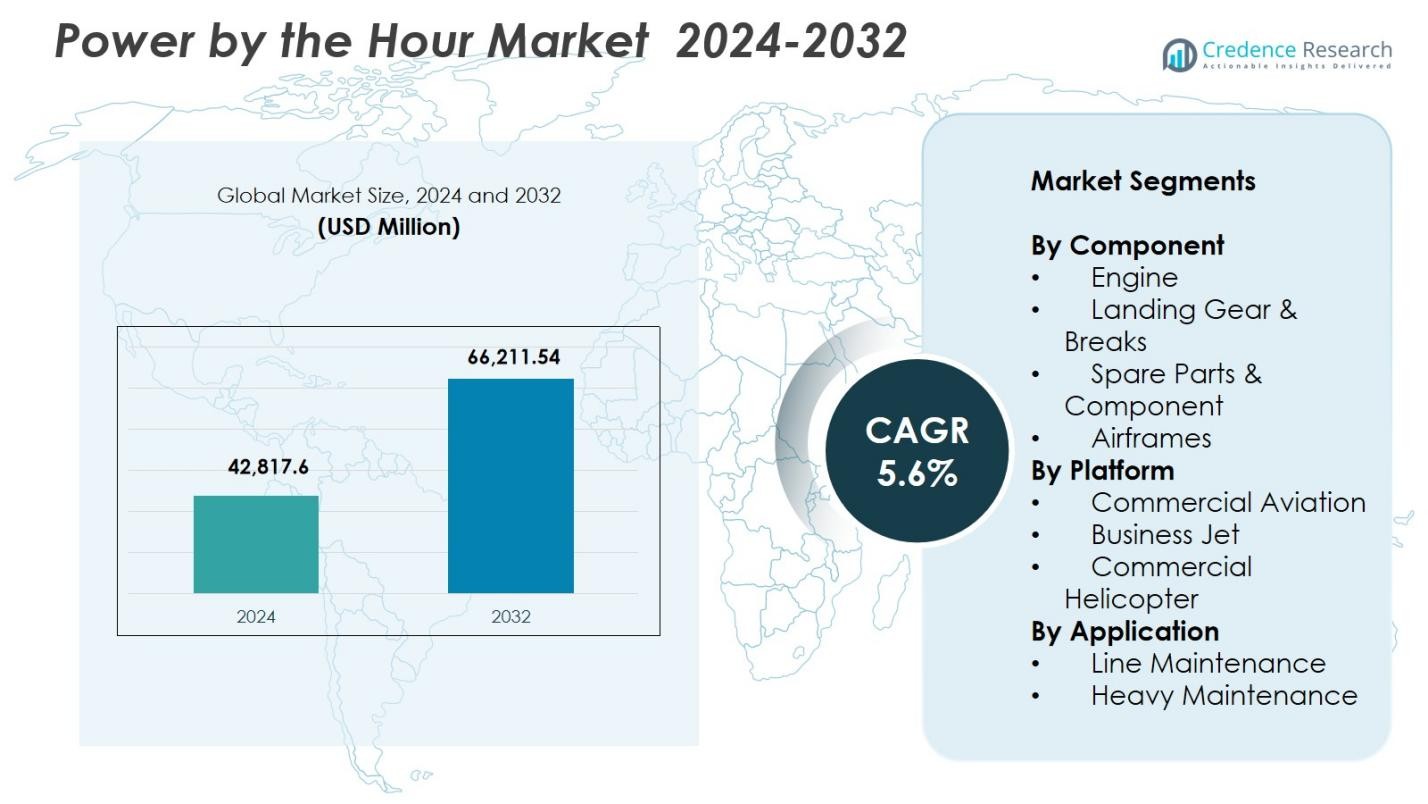
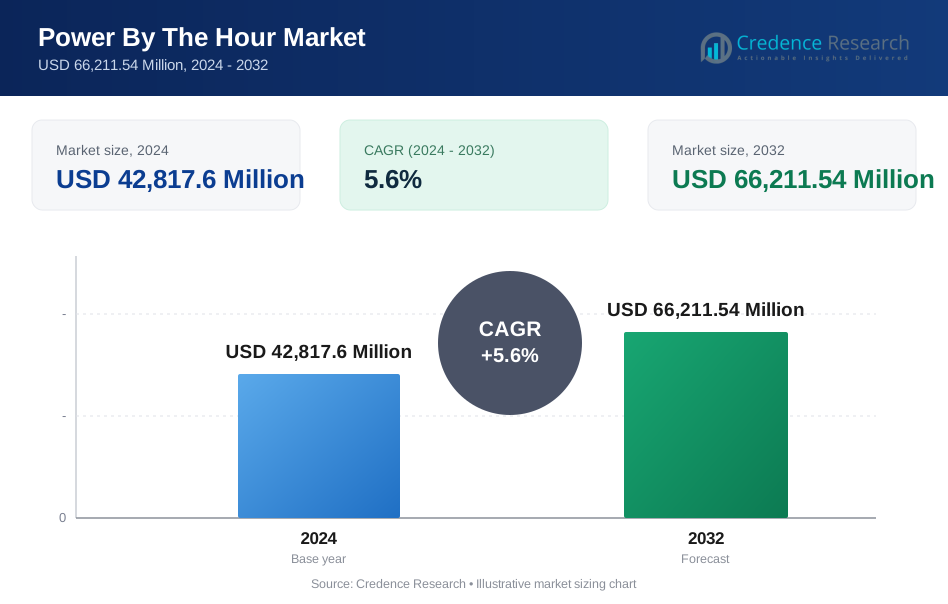
Power by the Hour Market size was valued at USD 42,817.6 Million in 2024 and is anticipated to reach USD 66,211.54 Million by 2032, at a CAGR of 5.6% during the forecast period.
| REPORT ATTRIBUTE | DETAILS |
|---|---|
| Historical Period | 2020-2023 |
| Base Year | 2024 |
| Forecast Period | 2025-2032 |
| Power By The Hour Market Size 2024 | USD 42,817.6 Million |
| Power By The Hour Market, CAGR | 5.6% |
| Power By The Hour Market Size 2032 | USD 66,211.54 Million |
Power by the Hour Market is shaped by leading players such as Lufthansa Technik, Rolls-Royce plc, United Technologies, MTU Aero Engines AG, Textron Inc., A J Walter Aviation Limited, AAR, AFI KLM E&M, Turkish Technic, and GE Aviation, all of which strengthen their presence through long-term maintenance programs, predictive diagnostics, and global service networks. These companies focus on engine lifecycle management, component pooling, and digital MRO capabilities to support high operational reliability for airlines and business aviation operators. Regionally, North America leads the market with a 37.6% share, driven by a large commercial fleet, strong adoption of PBH contracts, and continuous investment in advanced maintenance technologies.
Market Insights
- Power by the Hour Market reached USD 42,817.6 Million in 2024 and will grow at a CAGR of 5.6% through the forecast period.
- The market grows as airlines prioritize predictable maintenance costs and adopt PBH contracts to improve operational efficiency and reduce downtime across engines and critical components.
- A key trend is the rising use of digital MRO tools and predictive maintenance, while the Engine segment leads with a 46.3% share due to high replacement frequency and strong OEM-backed service adoption.
- Leading players expand global service networks and long-term maintenance programs, reinforcing market consolidation among OEMs, MROs, and component specialists.
- Regionally, North America holds 37.6%, followed by Europe at 29.4% and Asia-Pacific at 22.8%, driven by strong fleet expansion and higher adoption of structured lifecycle maintenance solutions.
Market Segmentation Analysis:
By Component:
The Power by the Hour Market shows strong dominance of the Engine segment, holding 46.3% share in 2024, driven by rising demand for engine health monitoring, predictive maintenance analytics, and cost-efficient long-term service agreements. Airlines increasingly depend on OEM-backed service packages to reduce downtime and enhance engine lifecycle reliability. Landing Gear & Brakes account for 21.4% share, followed by Spare Parts & Components at 18.7% and Airframes at 13.6%. Increasing fleet modernization and the high replacement frequency of engine components continue to reinforce the Engine segment’s leadership.
- For instance, Rolls-Royce’s TotalCare program uses real-time engine data analytics to optimize maintenance scheduling, significantly reducing unscheduled repairs.
By Platform:
Within the platform category, Commercial Aviation leads with a 58.9% market share in 2024, supported by expanding global passenger traffic, higher aircraft utilization rates, and growing reliance on long-term maintenance service contracts. Business Jets represent 23.1% share, supported by increased charter activity and private fleet expansion, while Commercial Helicopters hold 18.0% share due to rising demand in offshore operations and emergency services. Airlines prioritize predictable maintenance costs and operational continuity, strengthening Commercial Aviation’s dominant position in the Power by the Hour Market.
- For instance, JetSMART Airlines (Chile) signed a ten-year PBH (power-by-the-hour) deal with AJW Group for its A320 CEO/NEO fleet. The agreement includes component supply, repairs (through the AJW Technique facility in Montreal), and on-site inventory in Chile, Peru, and Argentina to support fleet growth.
By Application:
In the application segment, Line Maintenance dominates with a 62.4% share in 2024, driven by continuous operational checks, high aircraft turnaround frequency, and the need for real-time component servicing to avoid flight delays. Heavy Maintenance accounts for 37.6% share as operators increasingly outsource major checks, overhauls, and structural repairs to specialized MRO providers. Growth in global fleet size, stringent aviation safety regulations, and the shift toward predictive maintenance solutions reinforce Line Maintenance’s leading position in the Power by the Hour Market.
Key Growth Drivers
Rising Demand for Cost-Predictable Maintenance Programs
Airlines increasingly adopt Power by the Hour programs to achieve cost-predictable maintenance, reduce unplanned expenses, and enhance operational stability. These models bundle maintenance, repair, overhaul, and component services into fixed-rate agreements, enabling operators to manage budgets efficiently amid volatile fuel prices and high operating costs. As global fleets expand and utilization rates rise, carriers seek maintenance structures that minimize downtime and optimize lifecycle costs, strengthening long-term service partnerships between OEMs, MROs, and operators.
- For instance, AJW Group’s PBH program for Air Transat delivered a 92% first-pass fix rate, cutting unscheduled maintenance by 18% through 2023.
Fleet Expansion and Modernization Across Commercial Aviation
Continuous growth in global air travel drives significant investments in new-generation aircraft equipped with advanced engines and avionics that require specialized long-term service contracts. Airlines modernize fleets to improve fuel efficiency and sustainability, increasing reliance on OEM-backed maintenance programs that ensure performance reliability. As aviation traffic accelerates across emerging economies and major carriers expand route networks, demand for comprehensive maintenance solutions intensifies, reinforcing the adoption of Power by the Hour service models across commercial and business aviation platforms.
- For instance, Vietjet Thailand secured a long-term Power by the Hour component support agreement with AFI KLM E&M covering its 50 Boeing 737-8 aircraft, ensuring predictable maintenance and component availability as the airline expands its operations.
Advancements in Predictive Maintenance and Digital MRO Solutions
The integration of AI-driven analytics, IoT sensors, and digital twins significantly enhances real-time monitoring of engines, avionics, and critical components, enhancing the value proposition of Power by the Hour services. Predictive maintenance tools enable early fault detection, optimized part replacement cycles, and reduced operational disruptions. As airlines prioritize high aircraft availability and data-optimized maintenance planning, digital MRO platforms strengthen the shift toward outcome-based service agreements. These technologies improve cost-efficiency, extend asset lifespan, and support data-backed decision-making for operators and service providers.
Key Trends & Opportunities
Growing Adoption of Long-Term OEM Service Contracts
OEMs increasingly expand long-term service agreements bundled with aircraft or engine purchases, creating strong aftermarket revenue streams. Airlines benefit from guaranteed service quality, assured component availability, and reduced maintenance risk, reinforcing the appeal of PBH contracts. As regulatory complexity increases and fleets incorporate advanced propulsion technologies, OEMs gain opportunities to integrate deeper lifecycle services. This trend positions OEMs as full-service partners, opening avenues for high-margin, subscription-style maintenance offerings that support predictable and scalable aftermarket growth.
- For instance, Pratt & Whitney's EngineWise service, provides airlines with fixed-cost maintenance plans that improve cost certainty and operational reliability.
Expansion of PBH Programs into Business Jets and Helicopter Fleets
Business aviation operators and helicopter service providers are increasingly adopting PBH models to support mission-critical operations, including medical transport, offshore logistics, and corporate travel. These fleets prioritize high dispatch reliability and minimal downtime, creating opportunities for specialized, platform-tailored PBH programs. As demand rises for premium maintenance plans, MRO companies and OEMs introduce flexible, usage-based agreements that cover engines, avionics, and dynamic components. The trend broadens PBH penetration beyond commercial airlines and strengthens aftermarket opportunities across diverse aviation segments.
- For instance, Airbus Helicopters introduced the HCare Smart service for its H145 fleet that adjusts maintenance based on actual flight hours to optimize costs and downtime.
Key Challenges
High Dependence on OEM-Controlled Aftermarket Ecosystems
The market faces structural challenges due to OEM dominance in key engine and component segments, limiting pricing flexibility for airlines and independent MRO providers. OEMs often retain control over proprietary parts, diagnostic software, and repair technologies, resulting in higher service costs and reduced competition in the aftermarket. This dependency restricts operators’ ability to negotiate terms and pressures margins for third-party MROs. As fleets adopt newer-generation engines with tighter IP restrictions, balancing cost control with OEM reliance becomes increasingly challenging for operators.
Complex Contract Structures and Usage Variability Risks
PBH agreements involve intricate terms related to flight hours, cycles, operating environments, and component wear patterns, creating challenges for accurate forecasting and utilization alignment. Airlines operating diverse routes or facing fluctuating demand may encounter mismatches between contracted service levels and actual maintenance requirements. Over- or under-utilization can lead to financial inefficiencies, disputes, or renegotiations. The complexity intensifies for mixed fleets and leased aircraft, requiring sophisticated analytics, real-time tracking, and transparent data-sharing to ensure optimal contract outcomes for all stakeholders.
Regional Analysis
North America
North America leads the Power by the Hour Market with a 37.6% share in 2024, driven by a large commercial fleet base, strong adoption of long-term maintenance service agreements, and the presence of major MRO centers and OEMs. U.S. airlines rely heavily on PBH programs to stabilize maintenance costs and enhance aircraft availability amid rising passenger traffic. Continuous investment in next-generation aircraft, digital MRO platforms, and predictive maintenance technologies further strengthens the region’s leadership. Growing business aviation activity and expansion of leasing companies also reinforce sustained market demand.
Europe
Europe holds a 29.4% share in 2024, supported by a well-established aviation ecosystem, dense airline networks, and strong MRO infrastructures across Germany, France, and the UK. The region’s emphasis on sustainability and fleet modernization accelerates adoption of PBH agreements for fuel-efficient aircraft and advanced engines. European carriers increasingly prioritize lifecycle cost optimization and regulatory compliance, boosting demand for structured maintenance programs. Strategic collaborations between OEMs and regional MRO providers enhance service accessibility, while expanding low-cost carriers stimulate continuous PBH program integration across narrow-body and regional aircraft fleets.
Asia-Pacific
Asia-Pacific accounts for a 22.8% share in 2024, emerging as the fastest-growing region due to rapid fleet expansion, rising air travel demand, and strong investments in new-generation aircraft. Airlines in China, India, Japan, and Southeast Asia increasingly adopt PBH contracts to reduce operational risks and ensure high aircraft utilization in competitive markets. Growth in MRO capacity, including new engine overhaul facilities and digital maintenance hubs, accelerates regional adoption. Expanding low-cost and full-service carriers, combined with rising business aviation activity, reinforce Asia-Pacific’s growing influence in the Power by the Hour Market.
Latin America
Latin America holds a 6.1% share in 2024, driven by gradual fleet expansion, rising cross-border travel, and growing adoption of outsourced maintenance contracts. Airlines in Brazil, Mexico, and Colombia increasingly turn to PBH programs to manage aging fleets and navigate fluctuating economic conditions. Operators value predictable maintenance costs and improved aircraft readiness, particularly in regions with limited MRO infrastructure. As regional carriers modernize fleets and expand routes, demand for structured, cost-efficient lifecycle maintenance services is expected to increase, supported by partnerships with global OEMs and third-party MRO providers.
Middle East & Africa
Middle East & Africa represents a 4.1% share in 2024, supported by strong activity from major Gulf carriers, expanding regional airlines, and growing investments in aerospace maintenance hubs. Fleet modernization initiatives, particularly among long-haul operators, drive demand for PBH agreements covering engines, airframes, and critical components. The region’s focus on reliability for international transit routes reinforces uptake of structured service programs. Africa shows increasing adoption as carriers seek operational stability and cost predictability. Strategic MRO expansions in the UAE, Saudi Arabia, and Ethiopia further strengthen regional participation in the Power by the Hour Market.
Market Segmentations:
By Component
- Engine
- Landing Gear & Breaks
- Spare Parts & Component
- Airframes
By Platform
- Commercial Aviation
- Business Jet
- Commercial Helicopter
By Application
- Line Maintenance
- Heavy Maintenance
By Geography
- North America
- U.S.
- Canada
- Mexico
- Europe
- Germany
- France
- U.K.
- Italy
- Spain
- Rest of Europe
- Asia Pacific
- China
- Japan
- India
- South Korea
- South-east Asia
- Rest of Asia Pacific
- Latin America
- Brazil
- Argentina
- Rest of Latin America
- Middle East & Africa
- GCC Countries
- South Africa
- Rest of the Middle East and Africa
Competitive Landscape
The Competitive Landscape of the Power by the Hour Market is shaped by key players including Lufthansa Technik, Rolls-Royce plc, United Technologies, MTU Aero Engines AG, Textron Inc., A J Walter Aviation Limited, AAR, AFI KLM E&M, Turkish Technic, and GE Aviation. These companies strengthen their positions through long-term service agreements, engine maintenance packages, and lifecycle support programs tailored for commercial, business, and helicopter fleets. OEMs maintain a strong advantage by integrating predictive maintenance technologies, proprietary diagnostics, and digital MRO platforms that enhance operational reliability for operators. MRO providers expand global service networks, introduce component pooling programs, and collaborate with leasing companies to meet rising fleet maintenance demand. Strategic partnerships, engine overhaul facility expansions, and investments in data-driven maintenance solutions continue to define competition. As airlines prioritize predictable maintenance costs and high aircraft availability, providers focus on innovation, service customization, and global footprint expansion to secure long-term PBH contracts.
Key Player Analysis
- Turkish Technic
- MTU Aero Engines AG
- AAR
- Textron Inc.
- GE Aviation
- AFI KLM E&M
- Rolls-Royce plc
- United Technologies
- A J Walter Aviation Limited
- Lufthansa Technik
Recent Developments
- In July 2025, Lufthansa Technik extended exclusive engine maintenance and Total Component Support (TCS) agreements with Air Canada, covering its CFM56-5B engines and Boeing 777/737 MAX fleets through 2032.
- In April 2025, GE Aerospace and MTU Maintenance formalized a long-term agreement to service GEnx engines at the expanded Fort Worth facility, enhancing maintenance capacity and network reach.
- In November 2025, Etihad Engineering, Lufthansa Technik Middle East, and GE Aerospace launched a new Maintenance Training Programme to train UAE nationals in aviation MRO, supporting future workforce growth in the region.
Report Coverage
The research report offers an in-depth analysis based on Component, Application, Platform and Geography. It details leading market players, providing an overview of their business, product offerings, investments, revenue streams, and key applications. Additionally, the report includes insights into the competitive environment, SWOT analysis, current market trends, as well as the primary drivers and constraints. Furthermore, it discusses various factors that have driven market expansion in recent years. The report also explores market dynamics, regulatory scenarios, and technological advancements that are shaping the industry. It assesses the impact of external factors and global economic changes on market growth. Lastly, it provides strategic recommendations for new entrants and established companies to navigate the complexities of the market.
Future Outlook
- The market will experience steady growth as airlines increasingly prioritize predictable maintenance cost structures.
- Adoption of AI-driven predictive maintenance will significantly enhance PBH program efficiency and lifecycle reliability.
- OEMs will continue expanding long-term service contracts, strengthening their influence in global aftermarket ecosystems.
- Digital MRO platforms will gain wider acceptance, accelerating real-time diagnostics and automated maintenance planning.
- Fleet modernization across commercial, business, and helicopter segments will drive stronger demand for PBH agreements.
- Expansion of MRO infrastructure in emerging regions will improve service accessibility and contract adoption.
- Leasing companies will integrate PBH offerings into aircraft lease packages to attract operators seeking operational stability.
- Sustainability initiatives will push airlines toward PBH-supported efficient engine and component management practices.
- Partnerships between OEMs and independent MROs will increase to support diverse fleet maintenance needs.
- Rising air traffic across Asia-Pacific and the Middle East will strengthen future market expansion opportunities.
Request a Free Sample
Fill in your details and we'll send you a free sample report.
- Sample data tables & charts
- Research methodology
Need a Custom Version of This Report?
Tailor the scope, geography, or segments to your exact requirements.
- Custom geography or segment scope
- Direct access to our analyst team
Frequently Asked Questions
What is the current market size for Power by the Hour Market, and what is its projected size in 2032?
At what Compound Annual Growth Rate is the Power by the Hour Market projected to grow between 2025 and 2032?
Which Power by the Hour Market segment held the largest share in 2024?
What are the primary factors fueling the growth of the Power by the Hour Market?
Who are the leading companies in the Power by the Hour Market?
Which region commanded the largest share of the Power by the Hour Market in 2024?
Table of Content
Chapter 1. Report Introduction
- 1.1 Report Description & Purpose
- 1.1.1 Report Title & Market Definition
- 1.1.2 Unique Selling Propositions (USP) & Key Differentiators
- 1.1.3 Value Proposition for Stakeholders
- 1.2 Research Objectives
- 1.2.1 Market Sizing Objectives (Volume & Revenue) (Volume Where Applicable)
- 1.2.2 Segmentation Objectives
- 1.2.3 Competitive Intelligence Objectives
- 1.2.4 Forecast & Scenario Objectives
- 1.3 Report Scope
- 1.3.1 Power By The Hour Scope – Segments & Subsegments Covered
- 1.3.2 Geographic Scope – Regions & Countries Covered
- 1.3.3 Historical Period, Base Year & Forecast Period (2024; forecast to 2032)
- 1.3.4 Inclusions & Exclusions
- 1.4 Industry Classification & Applicable Codes
- 1.5 Currency, Measurement Units & Valuation Basis
- 1.6 Target Stakeholders
- 1.7 Limitations & Assumptions
Chapter 2. Executive Summary
- 2.1 Global Power By The Hour Market Snapshot
- 2.1.1 Market Size – Historical (2024) & Forecast (2024-2032) (2024: USD 42,817.6 Million → 2032: USD 66,211.54 Million)
- 2.1.2 Volume & Revenue – Global Totals (Volume Where Applicable)
- 2.1.3 Key Market Highlights – Top Five Facts
- 2.2 Power By The Hour Market Segmentation Snapshot
- 2.2.1 Market Split by Region – 2024 vs. 2032
- 2.3 Competitive Snapshot
- 2.3.1 Top 10 Players by Revenue Share – 2024
- 2.3.2 Top 10 Players by Volume Share – 2024 (Volume Where Applicable)
- 2.3.3 Recent Strategic Developments (18-Month Summary)
- 2.4 Key Investment Highlights & Strategic Conclusions
Chapter 3. Power By The Hour Market Dynamics & Industry Analysis
- 3.1 Market Overview & Context
- 3.1.1 Power By The Hour Market Position in the Broader Industry Value Chain
- 3.1.2 Demand Structure & Purchasing Dynamics
- 3.1.3 Market Maturity & Development Stage by Region
- 3.2 Power By The Hour Market Drivers
- 3.3 Power By The Hour Market Restraints & Challenges
- 3.4 Power By The Hour Market Opportunities
- 3.5 Porter's Five Forces Analysis
- 3.5.1 Threat of New Entrants
- 3.5.2 Bargaining Power of Suppliers
- 3.5.3 Bargaining Power of Buyers
- 3.5.4 Threat of Substitutes
- 3.5.5 Competitive Rivalry – Intensity Assessment
- 3.6 Power By The Hour Value Chain Analysis
- 3.6.1 Upstream – Key Inputs, Resources & Suppliers
- 3.6.1.1 Key Input/Resource 1
- 3.6.1.2 Key Input/Resource 2
- 3.6.1.3 Key Input/Resource 3
- 3.6.2 Midstream – Core Operations & Value Creation
- 3.6.2.1 Operating Model & Process Overview
- 3.6.2.2 Key Operating Locations & Capabilities by Company
- 3.6.3 Downstream – Market Channels & End Users
- 3.6.3.1 Direct Sales & Customer Engagement Channels
- 3.6.3.2 Indirect Sales, Intermediaries & Partner Channels
- 3.6.4 Value Chain Profitability Analysis
- 3.6.1 Upstream – Key Inputs, Resources & Suppliers
- 3.7 PESTEL Analysis
- 3.7.1 Political Factors
- 3.7.2 Economic Factors
- 3.7.3 Social Factors
- 3.7.4 Technological Factors
- 3.7.5 Environmental Factors
- 3.7.6 Legal Factors
- 3.8 Power By The Hour Supply Chain Analysis
- 3.8.1 Critical Input & Resource Availability Risk Assessment
- 3.8.2 Supplier & Operational Concentration Risk (Geographic Exposure)
- 3.8.3 Supply & Service Disruption Impact Analysis
- 3.9 Regulatory & Policy Landscape
Note: The regulatory and policy landscape section covers regulations based on their applicability to the market, Power By The Hour category, geography, and scope of the study. Only regulatory frameworks with a material impact on operations, compliance, trade, sustainability, or market access are analyzed in detail.
Chapter 4. Key Investment Pockets & Opportunity Analysis
- 4.1 Power By The Hour Market Attractiveness Analysis
- 4.1.1 By Region – Investment Attractiveness Matrix (Market Size × CAGR)
- 4.2 Absolute Revenue Growth Opportunity
- 4.2.1 By Region – Absolute Revenue Growth Through 2032
- 4.3 Incremental Demand Opportunity
- 4.3.1 By Region – Incremental Demand Through 2032
- 4.3.2 Segment – Incremental Demand
- 4.4 Emerging Submarket Opportunity Deep Dive (Subject to Applicability)
- 4.5 Priority Market Opportunity Scorecards
- 4.5.1 United States
- 4.5.2 Europe
- 4.5.3 Asia
- 4.5.4 Middle East & Africa
Note: Priority market opportunity scorecards reflect the geographic scope and strategic relevance of the study. Listed markets are indicative and may be adapted to the industry.
Chapter 5. Power By The Hour Cross-Border Trade & Market Access Analysis
- 5.1 International Trade & Cross-Border Activity Overview
- 5.1.1 Global Export Value by Country (2024)
- 5.1.2 Global Export Volume by Country (2024) (Volume Where Applicable)
- 5.1.3 Global Import Value by Country (2024)
- 5.1.4 Global Import Volume by Country (2024) (Volume Where Applicable)
- 5.1.5 Net Trade Balance by Country (2024)
- 5.2 Export Analysis – Segment
- 5.2.1 Category 1 (Applicable Classification Code)
- 5.2.2 Category 2 (Applicable Classification Code)
- 5.2.3 Category 3 (Applicable Classification Code)
- 5.2.4 Category 4 (Applicable Classification Code)
- 5.2.5 Category 5 (Applicable Classification Code)
- 5.3 Import Analysis – Segment
- 5.3.1 Category 1 (Applicable Classification Code)
- 5.3.2 Category 2 (Applicable Classification Code)
- 5.3.3 Category 3 (Applicable Classification Code)
- 5.3.4 Category 4 (Applicable Classification Code)
- 5.3.5 Category 5 (Applicable Classification Code)
- 5.4 Cross-Border Pricing & Transaction Benchmarks
- 5.4.1 Export Pricing – Segment & Country
- 5.4.2 Import Pricing – Segment & Source Country
- 5.4.3 Price Trends (2024)
- 5.5 Key Cross-Border Trade & Delivery Routes
- 5.5.1 Cross-Border Trade/Delivery Route 1
- 5.5.2 Cross-Border Trade/Delivery Route 2
- 5.5.3 Cross-Border Trade/Delivery Route 3
- 5.5.4 Cross-Border Trade/Delivery Route 4
- 5.5.5 Cross-Border Trade/Delivery Route 5
- 5.6 Trade Policy & Market Access Impact Assessment
- 5.6.1 Tariff & Non-Tariff Barriers
- 5.6.2 Regional Trade & Economic Integration Frameworks
- 5.6.3 Bilateral & Multilateral Trade Agreements
- 5.6.4 Cross-Border Operating, Licensing & Localization Requirements
Note: This chapter applies where cross-border trade or delivery is relevant to Power By The Hour. Goods, services, and digital offerings are assessed using applicable classifications and transaction measures. Import-export volumes, trade balances, and route analyses are included only where meaningful to the market.
Chapter 6. Competitive Landscape & Company Benchmarking
- 6.1 Power By The Hour Market Concentration & Structure
- 6.1.1 Herfindahl-Hirschman Index (HHI) – vs. 2024
- 6.1.2 Leading, Mid-Sized & Emerging Player Structure
- 6.1.3 Global, Regional & Local Player Dynamics
- 6.2 Power By The Hour Market Share Analysis – 2024
- 6.2.1 Global Revenue Share by Company
- 6.2.2 Global Volume Share by Company (Volume Where Applicable)
- 6.2.3 Regional Revenue Share
- 6.2.4 Market Share Evolution ( vs. 2024)
- 6.2.5 Company Market Share by Key Segment
- 6.2.6 Company Market Share by Customer Group
- 6.3 Operating Scale, Capacity & Infrastructure Analysis
- 6.3.1 Global Operating Scale & Supply Capacity
- 6.3.2 Resource Utilization & Operating Efficiency
- 6.3.3 Output, Service Delivery & Activity Metrics
- 6.3.4 Operating Footprint & Infrastructure Map
- 6.3.5 Planned Operational & Capacity Expansion
- 6.4 Power By The Hour Competitive Benchmarking Matrix
- 6.4.1 Revenue, Growth, Profitability & Operating Metric Comparison
- 6.4.2 Channel Revenue Mix
- 6.4.3 Geographic Revenue Exposure
- 6.4.4 R&D Intensity
- 6.4.5 Sustainability Maturity
- 6.5 Strategic Developments in Power By The Hour (Last 24 Months)
- 6.5.1 Mergers, Acquisitions & Divestments
- 6.5.2 New Products, Services & Solutions in Power By The Hour
- 6.5.3 Operational & Infrastructure Expansions
- 6.5.4 Strategic Alliances, Joint Ventures & Partnerships
- 6.5.5 Distribution Expansion & Market Entry
- 6.5.6 Sustainability & ESG Initiatives
- 6.6 Competitive Strategy Mapping
- 6.6.1 Leader, Challenger, Follower & Niche Classification
- 6.6.2 Pricing Strategy Comparison
- 6.6.3 Channel Strategy Matrix
Note: Strategic developments are included based on their materiality and the availability of reliable information.
Chapter 7. Global Power By The Hour Market – By Sales & Delivery Channel
- 7.1 Segment Overview
- 7.1.1 Volume & Revenue Split by Channel (2024 & 2032) (Volume Where Applicable)
- 7.1.2 Channel Mix Evolution (2024-2032)
Chapter 8. Regional Market Analysis – Global Overview
- 8.1 Global Regional Overview
- 8.1.1 Regional Volume Share (Volume Where Applicable)
- 8.1.2 Regional Revenue Share
- 8.1.3 Regional Volume by Region (Volume Where Applicable)
- 8.1.4 Regional Revenue by Region
- 8.1.5 Regional Forecast Through 2032
- 8.2 Cross-Regional Segment Analysis
- 8.2.1 By Sales & Delivery Channel
- 8.2.2 By Competitive Positioning & Price Tier
Chapter 9. North America Power By The Hour Market
- 9.1 United States
- 9.2 Canada
- 9.3 Mexico
Chapter 10. Europe Power By The Hour Market
- 10.1 Germany
- 10.2 France
- 10.3 Italy
- 10.4 United Kingdom
- 10.5 Spain
- 10.6 Poland
- 10.7 Russia
- 10.8 Netherlands
- 10.9 Belgium
- 10.10 Sweden
- 10.11 Denmark
- 10.12 Norway
- 10.13 Rest of Europe
Chapter 11. Asia Pacific Power By The Hour Market
- 11.1 China
- 11.2 India
- 11.3 Japan
- 11.4 South Korea
- 11.5 Thailand
- 11.6 Indonesia
- 11.7 Vietnam
- 11.8 Malaysia
- 11.9 Australia
- 11.10 Rest of Asia Pacific
Chapter 12. Latin America Power By The Hour Market
- 12.1 Brazil
- 12.2 Argentina
- 12.3 Colombia
- 12.4 Chile
- 12.5 Rest of Latin America
Chapter 13. Middle East Power By The Hour Market
- 13.1 Saudi Arabia
- 13.2 United Arab Emirates
- 13.3 Turkey
- 13.4 Israel
- 13.5 Iran
- 13.6 Rest of the Middle East
Chapter 14. Africa Power By The Hour Market
- 14.1 South Africa
- 14.2 Egypt
- 14.3 Nigeria
- 14.4 Morocco
- 14.5 Rest of Africa
Chapter 15. Power By The Hour Company Profiles
- 15.1 [Company 01]
- 15.1.1 Company Overview
- 15.1.2 Key Management Personnel
- 15.1.3 Products & Services Portfolio
- 15.1.4 Financial Performance
- 15.1.5 Key Market Focus & Geographic Presence
- 15.1.6 Recent Developments & Strategic Initiatives
Note: The company profile list is preliminary and may change based on research findings, market developments, data availability, and client requirements.
Chapter 16. Appendices
- Appendix A – List of Abbreviations & Acronyms
- Appendix B – Industry Classification Code Reference – Full Series
- Appendix C – Supply, Output & Operating Capacity Data Tables
- Appendix D – End-Use & Demand Base Tables
- Appendix E – Demand, Adoption & Usage Assumptions
- Appendix F – Pricing & Revenue Metric Reference Tables
- Appendix G – Company Operations & Infrastructure Database
- Appendix H – Cross-Border Trade & Activity Data Tables (Where Applicable)
- Appendix I – Regulatory Summary Tables
- Appendix J – Primary Research Participant List (Anonymized)
- Appendix K – Primary Research Questionnaire Framework
- Appendix L – Data Sources & Bibliography
- Appendix M – Market Size Divergence & Source Comparison
Chapter 17. Research Methodology
- 17.1 Research Framework & Philosophy
- 17.2 Secondary Research – Sources, Hierarchy & Data Extraction
- 17.3 Data Modeling – Bottom-Up & Top-Down Market Sizing
- 17.4 Primary Research – Stakeholder Framework, LOI & Sample Sizes
- 17.5 Forecast Methodology – Regression, Scenario & Sensitivity Analysis
- 17.6 Quality Control – Four-Layer Validation Framework
- 17.7 Limitations & Standard Assumptions
- 17.8 Disclaimer
