Market Overview
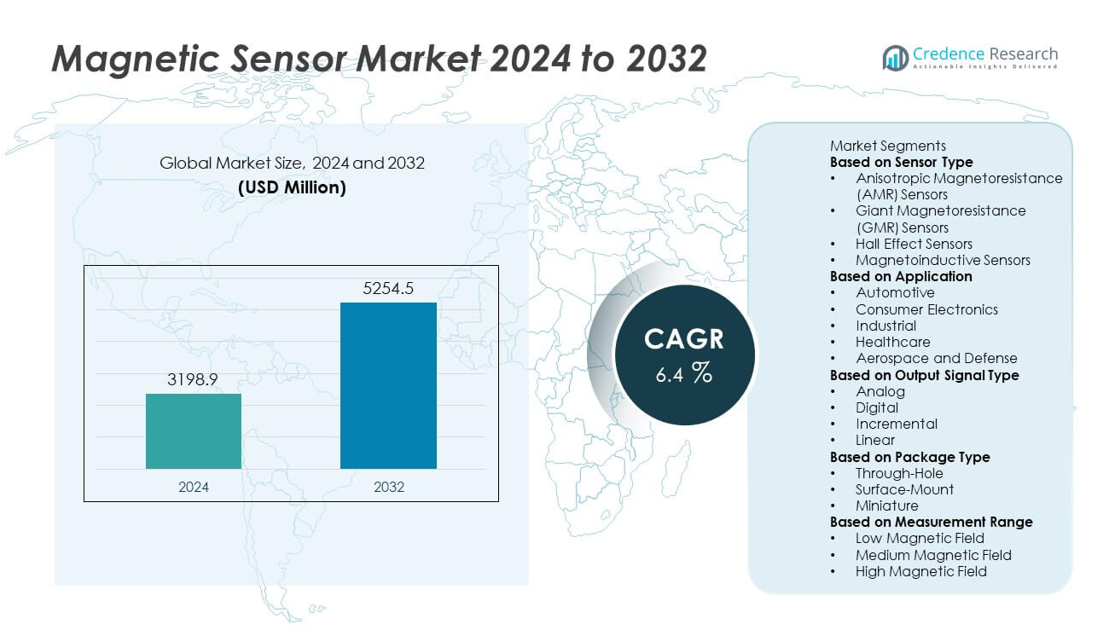
The Magnetic Sensor Market was valued at USD 3,198.9 million in 2024 and is projected to reach USD 5,254.5 million by 2032, growing at a CAGR of 6.4% during the forecast period.
| REPORT ATTRIBUTE |
DETAILS |
| Historical Period |
2020-2023 |
| Base Year |
2024 |
| Forecast Period |
2025-2032 |
| Magnetic Sensor Market Size 2024 |
USD 3,198.9 million |
| Magnetic Sensor Market, CAGR |
6.4% |
| Magnetic Sensor Market Size 2032 |
USD 5,254.5 million |
The Magnetic Sensor Market grows driven by rising adoption in automotive safety systems, electric vehicles, and industrial automation. Increasing demand for precise position, speed, and current sensing boosts integration in advanced driver assistance and robotics. Technological advancements in sensor miniaturization, sensitivity, and energy efficiency expand applications across consumer electronics and healthcare.
The Magnetic Sensor Market exhibits strong growth across North America, Europe, and Asia-Pacific, driven by rapid technological adoption and expanding industrial sectors. North America leads with advanced automotive manufacturing and robust consumer electronics demand, supported by significant R&D investments. Europe focuses on stringent safety regulations and sustainable manufacturing, fueling demand in automotive and aerospace applications. Asia-Pacific experiences rapid expansion due to large-scale industrial automation, electric vehicle production, and rising consumer electronics manufacturing, particularly in China, Japan, and South Korea. Emerging markets in Southeast Asia and Latin America show increasing opportunities as infrastructure development progresses. Key players shaping the market include NXP Semiconductors, known for its high-performance automotive sensors; Sensata Technologies, Inc., specializing in industrial and automotive applications; STMicroelectronics, offering diversified sensor portfolios; and Honeywell International Inc., recognized for its expertise in aerospace and automation sensor solutions.
Market Insights
- The Magnetic Sensor Market was valued at USD 3,198.9 million in 2024 and is projected to reach USD 5,254.5 million by 2032, growing at a CAGR of 6.4%.
- Increasing adoption in automotive safety systems, electric vehicles, and industrial automation drives market growth.
- Advances in sensor miniaturization, 3D sensing technologies, and AI integration enhance application versatility and accuracy.
- Leading players like NXP Semiconductors, Sensata Technologies, and STMicroelectronics focus on innovation and expanding product portfolios.
- High manufacturing costs and technical challenges such as electromagnetic interference limit wider market penetration.
- North America leads due to advanced automotive and industrial sectors, while Asia-Pacific experiences rapid growth fueled by industrialization and consumer electronics demand.
- Europe emphasizes compliance with stringent environmental and safety regulations, supporting steady market expansion through sustainable sensor solutions.
Access crucial information at unmatched prices!
Request your sample report today & start making informed decisions powered by Credence Research Inc.!
Download Sample
Market Drivers
Rising Demand for Automotive Safety and Automation Systems
The Magnetic Sensor Market benefits from growing adoption of advanced driver assistance systems (ADAS) and electric vehicles. These sensors play a crucial role in position sensing, speed detection, and current measurement, enhancing vehicle safety and performance. It supports features like electronic stability control, anti-lock braking systems, and autonomous driving technologies. Increasing regulatory pressure on automotive safety standards further drives integration of magnetic sensors. Manufacturers are incorporating sensors with higher sensitivity and durability to meet stringent automotive requirements. Expanding electric vehicle production fuels demand for precise current and voltage monitoring sensors, bolstering market growth.
- For instance, NXP’s KMI23/4 AMR rotational speed sensor delivers secure wheel-speed data over a wide operational temperature range and transmits speed information via a precise current-loop protocol at the supply pins.
Expansion of Consumer Electronics and Wearable Devices
The Magnetic Sensor Market experiences significant growth due to rising use in consumer electronics, including smartphones, tablets, and wearable devices. It enables functionalities such as compass navigation, motion detection, and proximity sensing. Miniaturization and low power consumption remain key factors enabling integration into compact devices. Growing consumer preference for multifunctional and smart gadgets pushes manufacturers to adopt advanced magnetic sensors with enhanced accuracy. The increasing penetration of IoT devices further expands application opportunities in smart homes and personal health monitoring.
- For instance, ST’s eCompass solution integrates a 3D accelerometer and 3D magnetometer with temperature offset compensation, offering magnetic field resolution of approximately 3 milli‑gauss and selectable magnetic full-scale ranges from ±4 to ±50 gauss.
Industrial Automation and Robotics Driving Sensor Adoption
Industrial sectors increasingly implement magnetic sensors for automation and robotics, supporting precise position and speed measurements in machinery and equipment. It enhances operational efficiency, reduces downtime, and improves safety in manufacturing processes. Rising investments in smart factories and Industry 4.0 initiatives accelerate sensor integration in conveyor systems, robotic arms, and motor control applications. The market benefits from continuous technological improvements, including robust sensor designs capable of withstanding harsh industrial environments. Demand for real-time data and predictive maintenance solutions further supports magnetic sensor adoption.
Growing Utilization in Healthcare and Medical Devices
The Magnetic Sensor Market expands with increasing incorporation in healthcare equipment and medical devices. It enables non-invasive monitoring, patient positioning, and equipment control in diagnostic and therapeutic systems. It supports applications such as MRI machines, pacemakers, and surgical tools, requiring high precision and reliability. Advances in sensor sensitivity and miniaturization allow integration into wearable health monitors and implantable devices. The growing focus on remote patient monitoring and telemedicine also fuels demand for magnetic sensors in connected healthcare solutions, driving overall market growth.
Market Trends
Advancements in Sensor Miniaturization and Integration
The Magnetic Sensor Market is witnessing a significant trend toward miniaturization, enabling integration into compact and multifunctional devices. It benefits from developments in semiconductor fabrication and MEMS technologies, allowing manufacturers to produce smaller, lighter sensors without compromising performance. These miniaturized sensors enhance energy efficiency and facilitate incorporation into wearable electronics, smartphones, and medical devices. The trend supports broader adoption across consumer electronics and healthcare sectors, meeting demands for portability and precision. Continuous research focuses on improving sensitivity and reducing power consumption, driving innovation across various applications.
- For instance, STMicroelectronics’ LSM6DSOX IMU combines a 3-axis digital accelerometer and gyroscope within a package measuring just 2.5 mm × 3 mm × 0.83 mm, drawing only 0.55 mA in high-performance mode.
Increasing Adoption of 3D Magnetic Sensing Technologies
3D magnetic sensors represent a growing trend within the Magnetic Sensor Market due to their ability to detect magnetic fields across multiple axes. It offers enhanced accuracy and spatial resolution for applications requiring precise position and motion detection. These sensors find increasing use in automotive systems, robotics, and industrial automation where three-dimensional magnetic field measurement improves control and safety. The development of advanced sensor architectures and signal processing algorithms is expanding 3D sensing capabilities. This trend strengthens the market by enabling new functionalities and improving system reliability.
- For instance, Infineon’s TLE493D X3XX 3D magnetic sensor family delivers enhanced magnetic accuracy with deviations under 1.7% in the X/Y axes and 6.75% in the Z axis, supports magnetic ranges from ±50 mT to ±160 mT, and functions across −40 °C to 150 °C.
Integration of Magnetic Sensors with IoT and Smart Systems
The Magnetic Sensor Market is evolving through integration with Internet of Things (IoT) platforms and smart systems. It enables real-time data collection and remote monitoring in applications ranging from smart homes to industrial equipment. Wireless connectivity and cloud-based analytics complement magnetic sensor technology, enhancing operational efficiency and predictive maintenance. This integration supports the shift toward automated and connected environments. Manufacturers focus on developing sensor modules with embedded processing and communication features to meet these requirements, driving market growth and diversification.
Growing Emphasis on High-Temperature and Harsh Environment Sensors
Demand for magnetic sensors capable of operating reliably under high temperatures and harsh environmental conditions is rising within the Magnetic Sensor Market. Industries such as automotive, aerospace, and oil & gas require sensors that maintain accuracy and durability in extreme settings. It drives innovation in materials science and sensor design to enhance thermal stability, corrosion resistance, and mechanical robustness. Enhanced packaging techniques and protective coatings contribute to extended sensor lifespans. This trend supports expanding market penetration in demanding industrial applications requiring robust and long-lasting magnetic sensing solutions.
Market Challenges Analysis
High Manufacturing Costs and Complex Production Processes Restrict Market Expansion
The Magnetic Sensor Market faces challenges related to the high manufacturing costs associated with advanced sensor technologies. Precision fabrication techniques such as MEMS and semiconductor processing require significant capital investment, impacting overall product pricing. It limits adoption among price-sensitive end-users, especially in emerging markets. Complex production processes also lead to longer lead times and higher defect rates, affecting supply chain reliability. Manufacturers must balance cost reduction with maintaining sensor performance and quality standards. These factors constrain widespread deployment, particularly in cost-competitive industries like consumer electronics.
Interference and Calibration Issues Affecting Sensor Accuracy and Reliability
The Magnetic Sensor Market contends with technical challenges involving electromagnetic interference and the need for frequent calibration. External magnetic fields from nearby electronic devices can disrupt sensor signals, leading to inaccurate readings. It demands robust shielding and advanced signal processing to maintain reliability in diverse operating environments. Calibration complexity increases maintenance requirements and operational costs for end-users. Variability in sensor performance across temperature and environmental conditions further complicates application design. Addressing these challenges is critical for ensuring sensor precision and expanding usage in high-accuracy domains such as automotive and healthcare.
Market Opportunities
Expanding Applications in Electric Vehicles and Autonomous Systems
The Magnetic Sensor Market holds substantial opportunities through increasing adoption in electric vehicles (EVs) and autonomous driving technologies. It supports essential functions such as wheel speed detection, rotor position sensing, and battery management systems, enabling enhanced vehicle safety and efficiency. Rising EV production worldwide fuels demand for highly accurate and durable sensors capable of operating in harsh automotive environments. Autonomous systems rely on magnetic sensors for precise navigation and obstacle detection, driving innovation in sensor sensitivity and integration. Manufacturers focusing on automotive-grade sensor development can capitalize on this expanding market segment and strengthen industry presence.
Growth Potential in Industrial Automation and Healthcare Monitoring
The Magnetic Sensor Market benefits from growing implementation in industrial automation and healthcare monitoring applications. It facilitates precise position sensing, speed control, and real-time diagnostics in robotic manufacturing and smart factory setups. Increasing investment in Industry 4.0 initiatives encourages the integration of magnetic sensors with IoT-enabled devices for predictive maintenance and operational optimization. Healthcare applications, including wearable devices and medical imaging equipment, demand compact, high-sensitivity sensors for non-invasive monitoring and improved patient outcomes. Expanding these sectors offers diverse avenues for product innovation and market expansion, positioning magnetic sensor manufacturers to meet evolving technological and regulatory requirements.
Market Segmentation Analysis:
By Sensor Type
The Magnetic Sensor Market segments into Hall effect sensors, magnetoresistive sensors, fluxgate sensors, and inductive sensors. Hall effect sensors dominate due to their robustness, cost-effectiveness, and wide range of applications including automotive and consumer electronics. Magnetoresistive sensors offer high sensitivity and precision, making them suitable for industrial automation and medical devices. Fluxgate sensors provide excellent accuracy for low-field measurements, commonly used in navigation and geophysical applications. Inductive sensors are preferred for proximity detection and metal object sensing. Continuous technological advancements in sensor miniaturization and performance are expanding capabilities across these types, supporting broader industry adoption.
- For instance, Honeywell’s HMC1001/1002 AMR (anisotropic magnetoresistive) sensors support low-field detection from tens of micro‑gauss up to 6 gauss, provide sensitivity around 3.2 mV/V per gauss, and operate from –40 °C to 85 °C.
By Application
Applications in the Magnetic Sensor Market include automotive, consumer electronics, industrial automation, healthcare, aerospace, and others. Automotive applications lead the market, leveraging magnetic sensors for wheel speed detection, anti-lock braking systems, and electric motor control. Consumer electronics utilize magnetic sensors for compasses, position detection, and user interface enhancements in smartphones and wearables. Industrial automation benefits from magnetic sensors in robotics, conveyor systems, and safety devices, improving operational efficiency. Healthcare applications involve magnetic resonance imaging (MRI) and wearable health monitors. Aerospace uses magnetic sensors for navigation and control systems. It continues to penetrate emerging fields, including IoT and smart city infrastructure, broadening market reach.
- For instance, Allegro’s ACS712 Hall-effect current sensor operates in an SOIC‑8 package with 5 µs output rise time, 80 kHz bandwidth, and offers output sensitivity between 66 to 185 mV/A
By Output Signal Type
The Magnetic Sensor Market divides into analog and digital output signal types. Analog sensors provide continuous output proportional to magnetic field strength and are widely used where precise measurement is required, such as current sensing and motor control. Digital sensors offer discrete output signals, often integrated with microcontrollers for applications requiring digital communication, including position detection and speed measurement. Digital outputs enable easier integration with modern electronic systems and support features like self-calibration and noise immunity. Innovations in mixed-signal processing combine analog sensitivity with digital flexibility, enhancing sensor functionality and expanding application potential across industries.
Segments:
Based on Sensor Type
- Anisotropic Magnetoresistance (AMR) Sensors
- Giant Magnetoresistance (GMR) Sensors
- Hall Effect Sensors
- Magnetoinductive Sensors
Based on Application
- Automotive
- Consumer Electronics
- Industrial
- Healthcare
- Aerospace and Defense
Based on Output Signal Type
- Analog
- Digital
- Incremental
- Linear
Based on Package Type
- Through-Hole
- Surface-Mount
- Miniature
Based on Measurement Range
-
- Low Magnetic Field
- Medium Magnetic Field
- High Magnetic Field
Based on the Geography:
- North America
- Europe
- UK
- France
- Germany
- Italy
- Spain
- Russia
- Belgium
- Netherlands
- Austria
- Sweden
- Poland
- Denmark
- Switzerland
- Rest of Europe
- Asia Pacific
- China
- Japan
- South Korea
- India
- Australia
- Thailand
- Indonesia
- Vietnam
- Malaysia
- Philippines
- Taiwan
- Rest of Asia Pacific
- Latin America
- Brazil
- Argentina
- Peru
- Chile
- Colombia
- Rest of Latin America
- Middle East
- UAE
- KSA
- Israel
- Turkey
- Iran
- Rest of Middle East
- Africa
- Egypt
- Nigeria
- Algeria
- Morocco
- Rest of Africa
Regional Analysis
North America
North America holds a significant share of the Magnetic Sensor Market, accounting for approximately 35% of the global market in 2024. The region benefits from strong automotive and industrial sectors, with extensive adoption of magnetic sensors in advanced driver assistance systems (ADAS), electric vehicles, and industrial automation. The United States leads the market due to robust R&D investments, presence of major sensor manufacturers, and early adoption of innovative sensor technologies. Canada and Mexico contribute through expanding manufacturing and automotive assembly operations. North America also sees growing integration of magnetic sensors in consumer electronics and healthcare devices, supported by a mature digital infrastructure and regulatory frameworks promoting automotive safety and industrial modernization.
Europe
Europe represents around 28% of the Magnetic Sensor Market, driven by stringent automotive safety regulations and increasing industrial automation across countries such as Germany, France, and the United Kingdom. The region emphasizes the development and adoption of high-precision magnetoresistive sensors for automotive and aerospace applications. Growth in renewable energy infrastructure and smart factory initiatives further stimulate demand for magnetic sensors in monitoring and control systems. Europe prioritizes sustainability, encouraging manufacturers to develop energy-efficient sensors with lower environmental impact. Regional collaborations between research institutions and industry players accelerate technological advancements, reinforcing Europe’s competitive position in the global market.
Asia-Pacific
Asia-Pacific accounts for about 30% of the global Magnetic Sensor Market and is the fastest-growing region. China dominates the market with large-scale automotive production, expanding consumer electronics manufacturing, and rising industrial automation. Japan, South Korea, and India contribute through technological innovation and increasing adoption of magnetic sensors in robotics, healthcare, and IoT devices. Rapid urbanization, government initiatives promoting smart manufacturing, and expanding electric vehicle markets drive sensor demand. The region benefits from competitive manufacturing costs and growing local sensor producers. Southeast Asian countries are emerging as key markets for consumer electronics and automotive components, contributing to the region’s accelerated growth trajectory.
Latin America
Latin America holds approximately 5% of the Magnetic Sensor Market. Brazil and Mexico lead regional demand due to expanding automotive production and industrial sectors. Increasing investments in infrastructure and energy projects create additional opportunities for magnetic sensor deployment in monitoring and control applications. The region faces challenges including economic volatility and uneven industrial development, but government incentives to promote manufacturing and technology adoption support gradual market expansion. Growing awareness of vehicle safety standards further boosts automotive sensor integration.
Middle East & Africa
The Middle East & Africa region represents around 2% of the global Magnetic Sensor Market. Adoption centers primarily in Gulf Cooperation Council (GCC) countries like Saudi Arabia, UAE, and Qatar, driven by investments in automotive, oil and gas, and industrial automation sectors. South Africa stands out in Africa for healthcare and mining equipment applications. The region faces infrastructure and regulatory challenges, limiting broader market penetration. However, strategic collaborations and increasing focus on smart city initiatives provide growth potential. Investments in technology transfer and local manufacturing capabilities aim to enhance magnetic sensor adoption in the coming years.
Shape Your Report to Specific Countries or Regions & Enjoy 30% Off!
Key Player Analysis
Competitive Analysis
The Magnetic Sensor Market is highly competitive, led by prominent players such as NXP Semiconductors, TE Connectivity Ltd., Sensata Technologies, Inc., STMicroelectronics, Honeywell International Inc., Amphenol Corporation, LEM Holding SA, Measurement Specialties, Inc., Knowles Corporation, and HBM Prenscia. These companies focus on continuous innovation, expanding their product portfolios, and strengthening global distribution networks to maintain market leadership. NXP Semiconductors leverages its expertise in automotive-grade sensors to supply high-performance solutions for ADAS and electric vehicles. Sensata Technologies emphasizes industrial and automotive applications, investing in robust, durable sensors that meet stringent performance standards. STMicroelectronics advances sensor integration by combining magnetic sensing with MEMS technology, enhancing functionality and miniaturization. Honeywell International Inc. targets aerospace and industrial sectors with specialized sensor technologies designed for harsh environments. TE Connectivity and Amphenol Corporation strengthen their market presence through strategic acquisitions and broad application coverage. The competition also intensifies around developing energy-efficient sensors with enhanced accuracy and AI-enabled features to meet growing demand in IoT and consumer electronics. Overall, the market competition centers on technological advancements, cost optimization, and regional expansion to capture diverse end-user segments globally.
Recent Developments
- In July 2025, STMicroelectronics entered into an agreement to acquire NXP’s MEMS sensor business for up to $950 million, aiming to strengthen its position in automotive, industrial, and consumer sensor markets.
- In May 2025, Honeywell introduced a Hydrogen Leak Detector (HLD) designed to identify microscopic hydrogen leaks in real time, utilizing Thermal Conductivity Detection technology to detect leaks as small as 50 parts per million.
- In October 2024, Amphenol Corporation acquired the LÜTZE Group, a railway and automation specialist, to expand its capabilities in industrial sensors and automation.
Market Concentration & Characteristics
The Magnetic Sensor Market demonstrates a moderately concentrated structure, with a mix of global leaders and specialized niche players competing through technological innovation and product diversification. It is characterized by high entry barriers due to complex manufacturing processes, stringent quality standards, and significant R&D investment requirements. Leading companies focus on precision, miniaturization, and integration of magnetic sensing capabilities into multifunctional devices to meet the demands of automotive, industrial, medical, and consumer electronics sectors. It benefits from advancements in Hall effect, magnetoresistive, and fluxgate technologies that enhance sensitivity, accuracy, and operational reliability in diverse environments. Customization capabilities, such as tailoring sensors for extreme temperatures or specific magnetic field ranges, further define competitive differentiation. It shows strong adoption in applications requiring non-contact position, speed, and current detection, with demand driven by electrification trends, automation, and smart device proliferation.
Report Coverage
The research report offers an in-depth analysis based on Sensor Type, Application, Output Signal Type, Package Type, Measurement Range and Geography. It details leading market players, providing an overview of their business, product offerings, investments, revenue streams, and key applications. Additionally, the report includes insights into the competitive environment, SWOT analysis, current market trends, as well as the primary drivers and constraints. Furthermore, it discusses various factors that have driven market expansion in recent years. The report also explores market dynamics, regulatory scenarios, and technological advancements that are shaping the industry. It assesses the impact of external factors and global economic changes on market growth. Lastly, it provides strategic recommendations for new entrants and established companies to navigate the complexities of the market.
Future Outlook
- Demand for magnetic sensors will grow with the expansion of electric vehicles and charging infrastructure.
- Integration of magnetic sensing technologies into autonomous driving systems will increase.
- Miniaturized magnetic sensors will see higher adoption in wearable and portable consumer electronics.
- Growth in industrial automation will drive the need for high-precision position and speed sensing solutions.
- Advancements in magnetoresistive and Hall effect technologies will enhance performance and efficiency.
- Use of magnetic sensors in renewable energy systems will expand, especially in wind and solar applications.
- Smart manufacturing and robotics will create opportunities for advanced magnetic sensing solutions.
- Healthcare applications for magnetic sensors will increase in diagnostic and monitoring equipment.
- Wireless and contactless magnetic sensor technologies will gain traction in harsh and hazardous environments.
- Strategic collaborations between sensor manufacturers and semiconductor companies will boost innovation.


