Market Overview
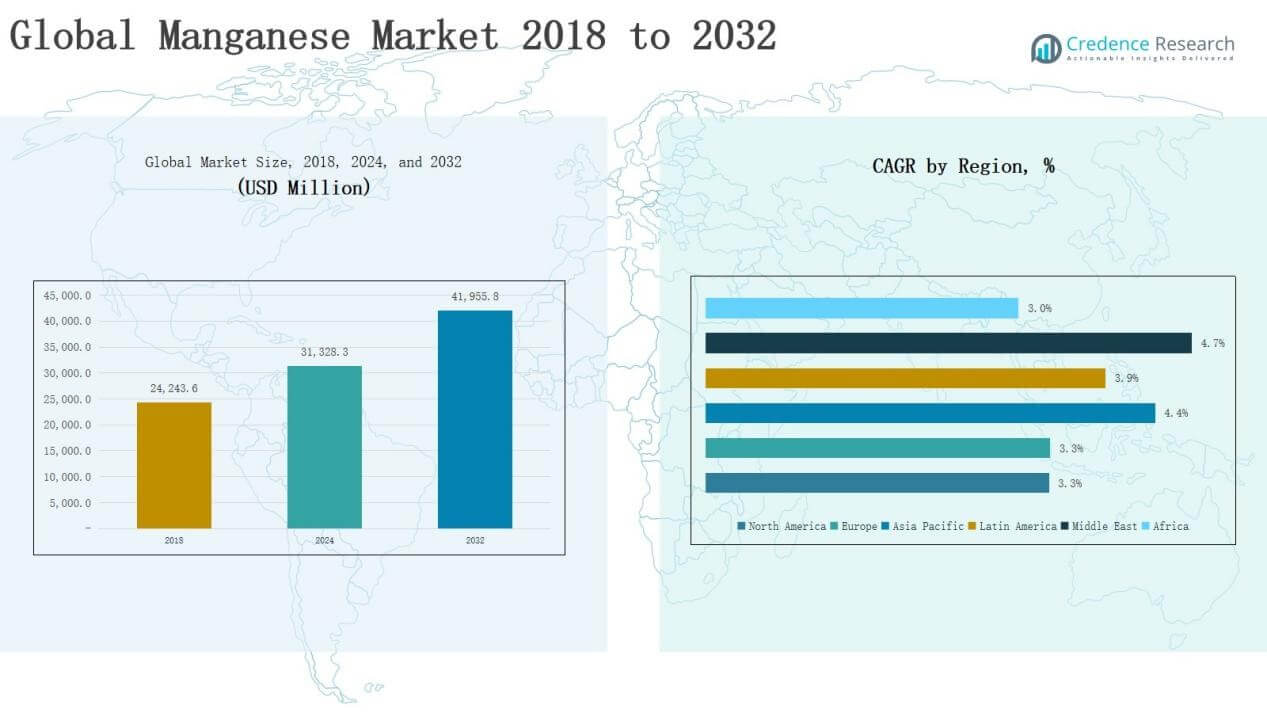
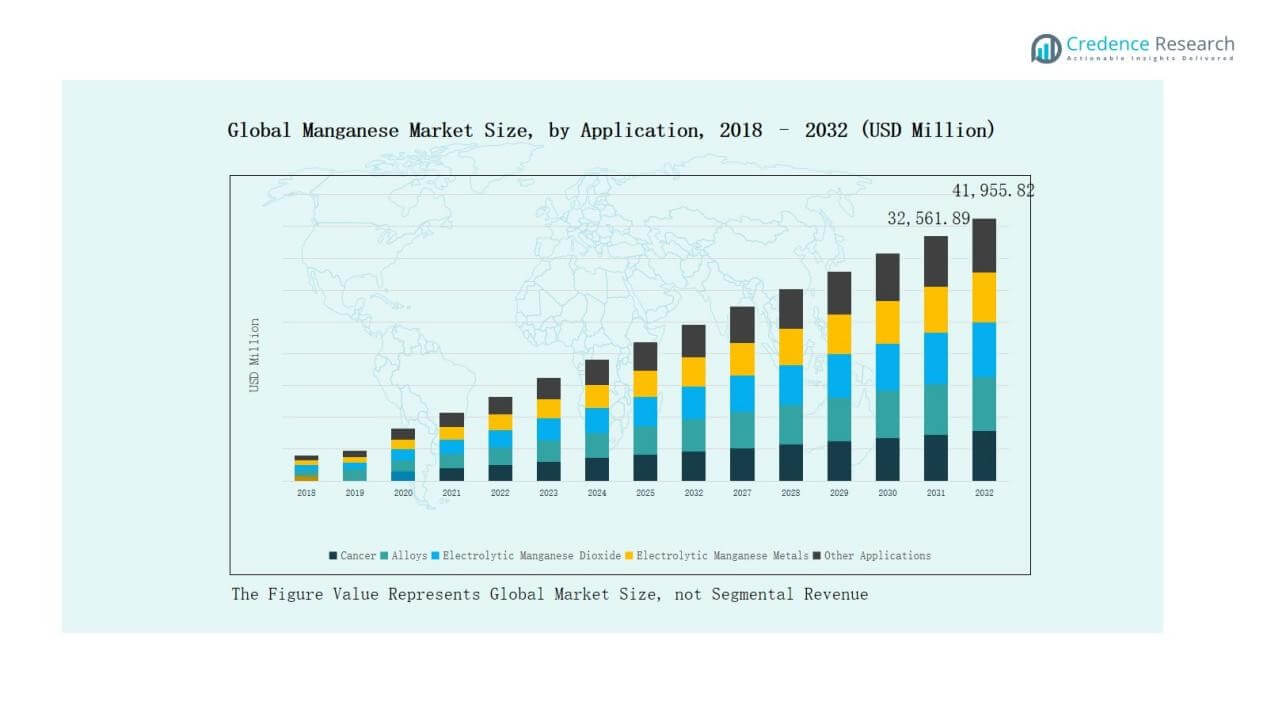
Global Manganese Market size was valued at USD 24,243.6 million in 2018 to USD 31,328.3 million in 2024 and is anticipated to reach USD 41,955.8 million by 2032, at a CAGR of 3.69 % during the forecast period.
| REPORT ATTRIBUTE |
DETAILS |
| Historical Period |
2020-2023 |
| Base Year |
2024 |
| Forecast Period |
2025-2032 |
| Manganese Market Size 2024 |
USD 31,328.3 Million |
| Manganese Market, CAGR |
3.69% |
| Manganese Market Size 2032 |
USD 41,955.8 Million |
The Global Manganese Market is shaped by leading players such as Anglo American PLC, Assore Limited, BHP, Carus Group Inc., Eramet, Jupiter Mines Limited, Mesa Minerals Limited, Ningxia Tianyuan Manganese Industry Group Co. Ltd., and Sibelco. These companies maintain strong positions through extensive mining reserves, integrated refining operations, and global distribution networks. Strategic initiatives such as capacity expansions, sustainability investments, and partnerships with battery manufacturers further enhance competitiveness. Regionally, North America led the market in 2024 with a 26% share, supported by advanced steel production, growing automotive demand, and increasing adoption of electrolytic manganese dioxide in energy storage applications.
Access crucial information at unmatched prices!
Request your sample report today & start making informed decisions powered by Credence Research Inc.!
Download Sample
Market Insights
- The Global Manganese Market grew from USD 24,243.6 million in 2018 to USD 31,328.3 million in 2024 and is expected to reach USD 41,955.8 million by 2032.
- Alloys dominate applications with 68% share in 2024, driven by steelmaking, construction, and automotive sectors, while electrolytic manganese dioxide (18%) rises with battery and energy storage demand.
- By end user, the industrial sector leads with 52% share in 2024, followed by construction at 28% and power storage at 15%, reflecting strong global infrastructure and EV trends.
- North America holds the largest regional share at 26% in 2024, supported by advanced steel output, automotive demand, and growing EMD adoption in electric vehicle batteries.
- Key players include Anglo American PLC, Assore Limited, BHP, Carus Group Inc., Eramet, Jupiter Mines Limited, Mesa Minerals Limited, Ningxia Tianyuan Manganese Industry Group Co. Ltd., and Sibelco.
Market Segment Insights
By Application
Alloys dominate the global manganese market, accounting for nearly 68% share in 2024. Demand is led by steelmaking, where manganese acts as a critical deoxidizer and desulfurizer. Growth is further supported by infrastructure expansion and rising automotive production, which require strong and durable steel. Electrolytic manganese dioxide (EMD) follows with around 18% share, driven by its role in batteries and energy storage. Electrolytic manganese metals (EMM) hold about 9% share, supported by their use in specialty alloys and electronics. Other applications collectively contribute the remaining 5%, mainly from chemicals and pigments.
- For instance, Tesla announced in 2022 that it was working on high-manganese cathode battery cells to further reduce its reliance on cobalt and lower costs, in addition to its existing use of manganese in certain lithium-ion battery chemistries.
By End User
The industrial sector leads the manganese market, capturing nearly 52% share in 2024. Its dominance is driven by heavy usage in steel, machinery, and manufacturing processes that require high-strength alloys. The construction segment follows with 28% share, supported by large infrastructure projects and growing urbanization worldwide. Power storage and electricity hold around 15% share, expanding rapidly with the adoption of lithium-ion and alkaline batteries that use EMD. Other end uses, including chemicals and pigments, represent about 5% share, showing steady but limited contribution compared to major industries.
- For instance, ArcelorMittal reported that over 90% of manganese consumption in its supply chain is tied to steelmaking, where manganese enhances both strength and durability.
Market Overview
Key Growth Drivers
Rising Steel Production and Infrastructure Development
Steel manufacturing accounts for the largest consumption of manganese, making alloys essential in construction, transportation, and industrial machinery. Expanding urban infrastructure and automotive demand in Asia-Pacific and other emerging markets significantly drive growth. Governments are investing heavily in bridges, railways, and smart cities, which require high-strength steel. This reliance ensures manganese remains vital in alloy production, sustaining strong demand. Rapid industrialization and modernization initiatives further amplify consumption, positioning steel-related applications as the backbone of global manganese growth.
- For instance, automakers like Toyota have increasingly incorporated manganese in electric vehicle batteries as a cathode material, while employing lightweight materials like advanced high-strength steel (AHSS) and aluminum alloys for casings and components to improve safety and efficiency.
Expanding Battery and Energy Storage Applications
Electrolytic manganese dioxide (EMD) is a critical material for lithium-ion and alkaline batteries. With rising electric vehicle (EV) adoption and the global shift toward renewable energy, demand for efficient storage solutions continues to climb. Manganese-based batteries offer cost-effective, safe, and high-capacity alternatives, giving the metal increasing importance in the clean energy transition. Nations prioritizing energy independence and sustainability further fuel this growth. Investment in gigafactories and grid-scale energy storage projects ensures long-term demand for manganese in the power storage sector.
- For instance, GM’s Ultium battery platform primarily incorporates nickel-cobalt-manganese-aluminum (NCMA) chemistry, though it is designed to be flexible and will incorporate future chemistries like lithium-manganese-rich (LMR) cells to support long-range vehicle performance.
Industrial Diversification and Specialty Applications
Beyond alloys and batteries, manganese supports diverse industrial uses, including fertilizers, pigments, and water treatment. Electrolytic manganese metals (EMM) are vital in aluminum alloys and electronics, contributing to lightweight materials for aerospace and advanced manufacturing. Chemical industries also rely on manganese compounds for catalytic processes and specialized formulations. Growing research into manganese’s catalytic and anti-corrosive properties widens its applications in specialty chemicals. This broadening base reduces dependency on steel alone, driving market resilience and ensuring sustained growth across multiple downstream sectors.
Key Trends & Opportunities
Growing Role in Electric Mobility and Green Transition
The rapid adoption of electric vehicles and renewable energy highlights manganese as a strategic mineral. Automotive OEMs and battery manufacturers are investing in manganese-rich cathode chemistries for affordability and stability. This positions manganese as a cost-competitive alternative to cobalt and nickel in EV supply chains. Nations promoting carbon neutrality and circular economies accelerate the opportunity, creating long-term demand in energy storage. This shift places manganese at the center of the clean mobility revolution, offering significant opportunities for suppliers and refiners globally.
- For instance, Volkswagen announced in 2021 that most of its mainstream EVs would use a high-manganese chemistry to optimize performance and cost, while its entry-level EVs would use lithium iron phosphate (LFP) batteries.
Supply Chain Integration and Regional Expansion
Producers are increasingly focusing on vertical integration, from mining to refining, to ensure secure supply chains. Asia-Pacific, particularly China, continues to dominate manganese production and processing, but investments in Africa and Latin America are reshaping regional dynamics. Multinationals are partnering with local governments to establish refining capacity closer to mining sites, reducing logistical costs. This trend presents opportunities for diversified sourcing, minimizing risks tied to single-region dependence. Regional expansion also strengthens value chains, supporting both local economic growth and global market stability.
- For instance, South32 has expanded its manganese ore operations in South Africa’s Kalahari Basin. While South32 has divested from the Metalloys smelter, its new owner, Khwelamet (a joint venture of Menar and Ntiso Investment Holdings), is now supporting the smelter’s development.
Key Challenges
Price Volatility and Market Uncertainty
Manganese prices are highly volatile due to fluctuations in steel demand, mining output, and global trade policies. Seasonal shifts in infrastructure projects and energy consumption patterns often create unpredictable pricing cycles. Producers and end-users face challenges in planning long-term contracts under uncertain market conditions. Trade restrictions, shipping disruptions, and geopolitical tensions further amplify risks. Such instability impacts profitability, particularly for small and mid-sized enterprises, creating barriers to sustainable investment. Stabilizing pricing mechanisms remains a key challenge for the manganese market.
Environmental and Regulatory Pressures
Mining and refining manganese pose significant environmental challenges, including land degradation, water contamination, and carbon emissions. Growing regulatory scrutiny is forcing producers to invest in sustainable practices and advanced waste management. Compliance with stricter environmental laws raises operational costs, particularly in regions with underdeveloped infrastructure. Social opposition to mining projects also delays approvals and creates reputational risks. Companies must balance profitability with responsible mining practices. Achieving sustainability without eroding margins represents a persistent challenge, especially as global demand rises.
Supply Concentration and Geopolitical Risks
The manganese supply chain is heavily concentrated in a few countries, notably South Africa, Gabon, and China. This concentration exposes the market to geopolitical risks, export restrictions, and local labor disputes. Overreliance on limited producers heightens vulnerability to supply shocks, disrupting downstream industries like steel and battery manufacturing. Strategic stockpiling and diversification efforts are underway, but challenges remain in scaling alternative sources. The lack of widespread refining facilities further deepens risks. Building a more resilient and geographically diverse supply base remains critical for long-term stability.
Regional Analysis
North America
North America holds a 26% share of the global manganese market in 2024, valued at USD 10,304.34 million. Growth is supported by advanced steel production, automotive manufacturing, and significant demand from industrial machinery. The U.S. leads consumption, while Canada contributes with mining capacity and refined imports. Expanding use of electrolytic manganese dioxide (EMD) in electric vehicle batteries further strengthens regional demand. With a CAGR of 3.3%, North America is projected to reach USD 13,425.86 million by 2032, maintaining a strong position in high-value industrial applications.
Europe
Europe accounts for 22% of the global manganese market in 2024, reaching USD 8,615.29 million. Germany, France, and the UK dominate due to robust steel and automotive industries, while Eastern Europe shows steady construction-driven demand. Rising focus on green energy and battery technologies boosts electrolytic manganese dioxide (EMD) adoption. The region advances sustainability goals through recycling initiatives and stricter environmental standards. With a CAGR of 3.1%, Europe is expected to grow to USD 11,235.77 million by 2032, maintaining its role as a mature yet steadily expanding market.
Asia Pacific
Asia Pacific represents 19% share of the global manganese market in 2024, valued at USD 7,434.66 million. China remains the world’s largest manganese producer and consumer, driving alloy and battery demand. India and Japan add growth through construction and automotive sectors, while South Korea and Australia support battery-grade manganese production. The region benefits from strong infrastructure development and EV adoption. Asia Pacific shows the fastest industrial growth, with a CAGR of 4.4%, and is forecast to reach USD 10,488.95 million by 2032, strengthening its global influence.
Latin America
Latin America captures 6% of the global manganese market in 2024, valued at USD 2,500 million. Brazil is the largest contributor, supported by strong mining reserves and growing steel output. Argentina and other nations show steady demand growth in construction and industrial applications. Regional exports also support global supply chains, particularly to Asia. With a CAGR of 3.9%, the Latin American market is projected to reach USD 3,398.42 million by 2032, strengthening its role as an emerging hub for manganese production and downstream consumption.
Middle East
The Middle East accounts for 4% share of the manganese market in 2024, valued at USD 1,449.61 million. Demand is driven by infrastructure expansion, construction megaprojects, and growing industrial bases in GCC countries. Rising adoption of renewable energy systems further boosts manganese consumption in alloys and batteries. Israel and Turkey also contribute through niche manufacturing and export. With the highest CAGR of 4.7%, the region is set to reach USD 2,101.99 million by 2032, highlighting its fast-evolving role in both domestic demand and global supply.
Africa
Africa holds 3% of the global manganese market in 2024, valued at USD 1,024.44 million. South Africa leads as one of the world’s largest manganese ore exporters, supplying to Asia and Europe. Egypt and other nations contribute moderately through steel and construction industries. While domestic consumption remains limited, the region’s importance in raw material exports ensures global market relevance. With a CAGR of 3.0%, Africa is forecast to reach USD 1,304.83 million by 2032, maintaining its role as a critical supplier within the global manganese value chain.
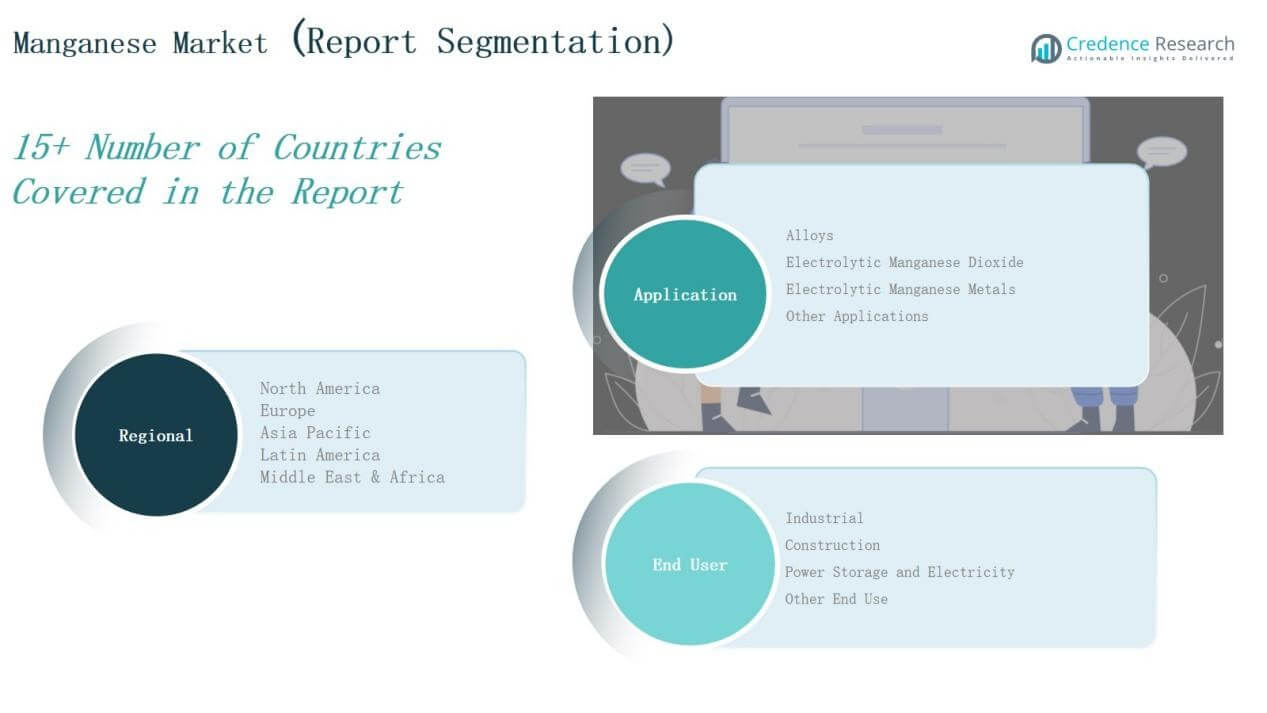
Market Segmentations:
By Application
- Alloys
- Electrolytic Manganese Dioxide (EMD)
- Electrolytic Manganese Metals (EMM)
- Other End Users
By End User
- Industrial
- Construction
- Power Storage and Electricity
- Other End Use
By Region
North America
Europe
- UK
- France
- Germany
- Italy
- Spain
- Russia
- Rest of Europe
Asia Pacific
- China
- Japan
- South Korea
- India
- Australia
- Southeast Asia
- Rest of Asia Pacific
Latin America
- Brazil
- Argentina
- Rest of Latin America
Middle East
- GCC Countries
- Israel
- Turkey
- Rest of Middle East
Africa
- South Africa
- Egypt
- Rest of Africa
Competitive Landscape
The global manganese market is moderately consolidated, with a mix of international mining giants and regional producers shaping competition. Leading players such as Anglo American PLC, BHP, Eramet, Assore Limited, Jupiter Mines Limited, and Ningxia Tianyuan Manganese Industry Group dominate through extensive reserves, vertically integrated operations, and strong global distribution networks. These companies focus on securing long-term supply contracts, expanding refining capacities, and investing in battery-grade manganese production to align with the fast-growing electric vehicle and energy storage sectors. Smaller firms, including Mesa Minerals and Carus Group, strengthen their positions through niche product offerings, technological improvements, and regional partnerships. Strategic mergers, acquisitions, and joint ventures remain common as players aim to enhance global reach and supply chain resilience. Increasing focus on sustainability and responsible mining practices is also influencing competitive strategies, with firms prioritizing reduced carbon footprints and efficient resource utilization to meet rising regulatory and consumer expectations.
Shape Your Report to Specific Countries or Regions & Enjoy 30% Off!
Key Players
Recent Developments
- In May 2025, Exxaro Resources Ltd acquired manganese assets in South Africa from Ntsimbintle Holdings and OM Holdings for about 11.67 billion rand (~US $640 million). The deal included Tshipi Borwa, Mokala, and Hotazel mines.
- In June 2025, Asia Mineral Limited partnered with Kerith Ressources to establish Kivuvu Kongo Mines in the Democratic Republic of Congo. The venture targets 2 million tonnes of annual manganese production and aims to create about 2,500 jobs.
- In August 2025, Carus Group Inc. unveiled new permanganate mining solutions CAIROX® (potassium permanganate) and CARUSOL® (liquid permanganate) designed for mining wastewater treatment, including pilot testing and system integration support.
Report Coverage
The research report offers an in-depth analysis based on Application, End User and Region. It details leading market players, providing an overview of their business, product offerings, investments, revenue streams, and key applications. Additionally, the report includes insights into the competitive environment, SWOT analysis, current market trends, as well as the primary drivers and constraints. Furthermore, it discusses various factors that have driven market expansion in recent years. The report also explores market dynamics, regulatory scenarios, and technological advancements that are shaping the industry. It assesses the impact of external factors and global economic changes on market growth. Lastly, it provides strategic recommendations for new entrants and established companies to navigate the complexities of the market.
Future Outlook
- Demand for manganese alloys will remain strong due to global steel production growth.
- Battery-grade manganese will gain momentum with rising electric vehicle adoption.
- Energy storage projects will expand manganese use in electrolytic manganese dioxide.
- Mining companies will increase investments in sustainable and low-carbon operations.
- Vertical integration across mining and refining will strengthen supply chain resilience.
- Africa will play a larger role as a global manganese ore supplier.
- Recycling and circular economy initiatives will enhance secondary manganese recovery.
- Technological advancements will improve efficiency in refining and processing manganese.
- Strategic partnerships between miners and battery manufacturers will accelerate market growth.
- Environmental regulations will push producers to adopt cleaner extraction methods.


