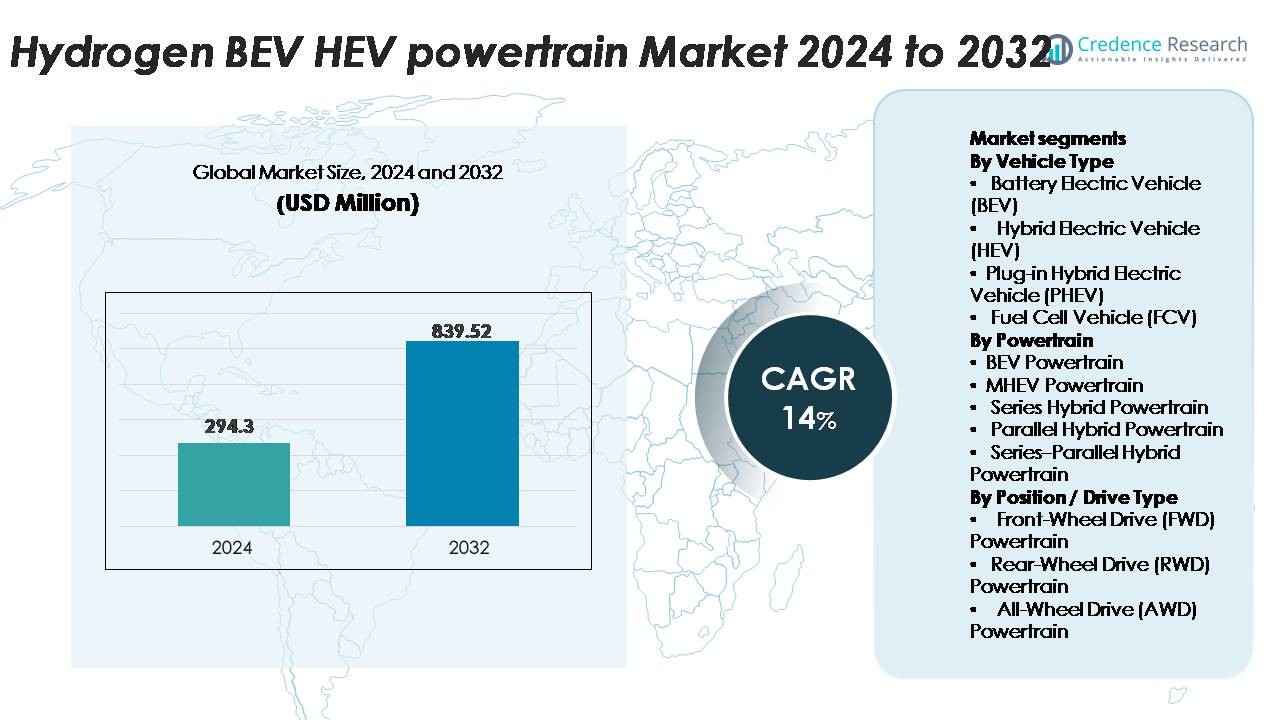
Home » Semiconductor & Electronics » Hydrogen/BEV/HEV Powertrain Market

Global Hydrogen/BEV/HEV Powertrain Market By Vehicle Type (Battery Electric Vehicle (BEV), Hybrid Electric Vehicle (HEV), Plug-in Hybrid Electric Vehicle (PHEV), and Fuel Cell Vehicle (FCV)), By Powertrain (BEV Powertrain, MHEV Powertrain, Series Hybrid Powertrain, Parallel Hybrid Powertrain, and Series-Parallel Hybrid Powertrain) Growth, Future Prospects & Competitive Analysis, 2016 – 2030

Price: $4999

Published: | Report ID: 16206 | Report Format : PDF

Key Highlights of the report

How are the major segments performing in the Hydrogen/BEV/HEV Powertrain market?

  • In 2022, the hybrid electric vehicle (HEV) type segment accounted for the largest global market revenue share. The increasing demand for eco-friendly vehicles due to growing environmental concerns fuels the adoption of HEVs. The rising need for improved fuel efficiency and reduced emissions are also driving the growth of this segment.
  • In 2022, the MHEV powertrain segment was estimated to hold a major share of the global Hydrogen/BEV/HEV powertrain market. MHEVs are considered a low-cost option for improving fuel efficiency and lowering emissions. They provide some degree of electric assistance, which helps to reduce fuel usage and emissions while being less expensive than full hybrids or BEVs.
  • In 2022, the all-wheel drive (Awd) powertrain position/drive type segment accounted for the largest market share due to the increased demand for improved traction and stability control in adverse weather conditions. AWD systems distribute power to all four wheels, which enhances vehicle handling, reduces the risk of slippage, and increases safety.
  • The heavy commercial vehicles application segment dominated the global Hydrogen/BEV/HEV powertrain market share in 2022. The increasing demand for eco-friendly transportation solutions in the commercial sector, driven by environmental regulations and emission reduction targets, promotes the adoption of electric and hydrogen powertrains.

What does the Market Size of Hydrogen/BEV/HEV Powertrain regard as value?

The global Hydrogen/BEV/HEV powertrain market is anticipated to grow at a substantial CAGR of XX% in the upcoming years. The global Hydrogen/BEV/HEV Powertrain industry was estimated to be worth USD XX billion in 2022 and was expected to be worth USD XX billion by 2028.

Design Element 2

Access crucial information at unmatched prices!

Request your free sample report today & start making informed decisions powered by Credence Research!

Download Free Sample
CTA Design Element 3

Which region dominated the Hydrogen/BEV/HEV powertrain market?

In 2022, North America was anticipated to hold the largest share of the global Hydrogen/BEV/HEV powertrain market. One of the primary drivers is rising regional customer demand for more fuel-efficient and environmentally friendly vehicles. Regulatory bodies and governments are also pushing for cleaner and more efficient vehicles, driving demand for Hydrogen/BEV/HEV powertrain technologies in the area. Moreover, North American automakers invest heavily in designing and manufacturing Hydrogen/BEV/HEV vehicles, propelling market innovation, and introducing more advanced and efficient powertrain technologies.

How is US Market Performing in the Hydrogen/BEV/HEV powertrain market?

North America currently leads the global Hydrogen/BEV/HEV powertrain market, with the United States accounting for the largest revenue share with a strong focus on passenger cars and commercial vehicles. In 2022, the US witnessed a significant increase in the sales of electric vehicles, driven by government incentives, increasing consumer awareness about the environment, and declining battery costs. As per the International Energy Agency (IEA), the US accounts for over 17% of the global electric car stock. Additionally, major manufacturers in the US, such as Ford, General Motors, and Tesla, are investing heavily in developing and producing electric and hydrogen fuel cell vehicles, indicating a strong growth potential in the US market.

How is the economy impacting the global Hydrogen/BEV/HEV powertrain market growth?

The global economy has been experiencing impacts from various factors such as recession, inflation, and geopolitical tensions like the Russia-Ukraine war. These have resulted in reduced consumer spending and economic uncertainty, which in turn affects the growth of the Hydrogen/BEV/HEV powertrain market. The high initial cost of adopting these technologies and economic impacts can hinder the market growth. However, governments and industry players are taking steps to mitigate the effects of these economic factors and stimulate demand for sustainable mobility solutions, which may help to fuel growth in the long term.

Hydrogen/BEV/HEV Powertrain Market

What is the competitive environment of the Hydrogen/BEV/HEV powertrain market?

The competitive environment of the Hydrogen/BEV/HEV powertrain market is highly fragmented, with a large number of global and regional players competing in the market. The market is dominated by major players such as Toyota Motor Corporation, Bosch, Continental AG, Hitachi, Ballard Power Systems, and Hyundai Motor Company. These companies invest heavily in research and development to introduce new and advanced technologies, such as solid-state batteries and fuel cell vehicles. In addition, several new entrants in the market are focusing on developing innovative and cost-effective powertrain solutions. For instance, Ballard Power Systems announced a partnership with China National Heavy Duty Truck Group Co. Ltd in March 2022 to develop fuel-cell electric trucks for the Chinese market.

Executive Summary

What are the key trends in the Hydrogen/BEV/HEV Powertrain market?

  • The global shift towards electrification and developing more efficient and sustainable powertrain technologies: As governments worldwide tighten emission regulations and customers demand more environmentally friendly choices, automakers and technology companies invest heavily in electric and hybrid powertrain development. The tendency towards electrification also drives innovation in battery technology, charging infrastructure, and energy management systems. This trend is anticipated to accelerate in the coming years, with hydrogen fuel cell technology getting traction as a viable alternative to traditional combustion engines. Overall, the trend towards electrification marks a substantial transformation for the automotive industry, with the potential to significantly reduce carbon emissions and improve air quality.

What are all the technical developments in the Hydrogen/BEV/HEV powertrain market?

Several technical developments have occurred in the Hydrogen/BEV/HEV powertrain market. These include improvements in battery technology, the development of solid-state batteries, advancements in hydrogen fuel cells, the use of lightweight materials, and the integration of advanced sensors and software for more efficient powertrain management. Additionally, there has been a focus on developing fast-charging infrastructure, wireless charging, and vehicle-to-grid (V2G) technology to enhance the functionality and usability of electric and hydrogen fuel cell vehicles.

Which are the key investments by the Hydrogen/BEV/HEV powertrain market players?

The major players in the Hydrogen/BEV/HEV powertrain market are investing in research and development, production facilities, partnerships and collaborations, and mergers and acquisitions. These investments focus on improving the performance and efficiency of powertrain systems, lowering production costs, and extending their global market reach. There is also substantial investment in developing charging infrastructure and battery technology.

Major global Hydrogen/BEV/HEV powertrain market players are Bosch, Mitsubishi Electric, Magna International, Continental AG, Hitachi, Ballard Power Systems, Cummins Inc, Denso Corporation, Knorr-Bremse Group, Punch Powertrain Nanjing Co Ltd, Magneti Marelli S.p.A., The Voith Group, JATCO Ltd, ZF Friedrichshafen, Aisin Seiki Co. Ltd, Borgwarner Inc, BAE Systems Plc.

What are the Major Driving Factors for the Hydrogen/BEV/HEV Powertrain Market?

The Hydrogen/BEV/HEV powertrain market is primarily driven by several factors, including increasing government initiatives and regulations for reducing carbon emissions and promoting eco-friendly transportation, growing consumer awareness and demand for fuel-efficient and low-emission vehicles, rising investments in the development of advanced powertrain technologies, and the availability of government incentives and subsidies for the adoption of electric and hybrid vehicles. Furthermore, advancements in battery technology and increasing R&D activities to enhance the efficiency and performance of electric and hybrid powertrains are expected to boost the market’s growth in the coming years.

What are the Major Risks for the Hydrogen/BEV/HEV Powertrain Market?

High initial investment costs and the high costs of leisure powerboats, limited driving range of battery electric vehicles, a lack of adequate charging infrastructure, and the complexity of the technology used in powertrain manufacturing are the major restraints for the Hydrogen/BEV/HEV powertrain market.

Which is the key application in the Hydrogen/BEV/HEV powertrain market?

Over the forecast period, the heavy commercial vehicles segment will hold a substantial revenue share of the Hydrogen/BEV/HEV powertrain market. Due to stringent government regulations and growing environmental concerns, there is an increasing demand for fuel-efficient and eco-friendly commercial vehicles, driving the adoption of advanced powertrain technologies in heavy commercial vehicles. Rising demand for heavy-duty trucks in the logistics and transit industries is also propelling the market forward. Moreover, the increasing availability of incentives and subsidies for adopting alternative fuel vehicles is anticipated to drive market development in this segment.

How is the Hydrogen/BEV/HEV powertrain market performing in regions?

The Asia Pacific region is expected to experience the fastest growth in the global Hydrogen/BEV/HEV powertrain market during the forecast period due to various drivers such as government support for electric mobility and the growing demand for sustainable transportation options in countries like China, Japan, and South Korea. The growing focus on reducing emissions and improving air quality drives the adoption of electric and hybrid vehicles in the region. Additionally, the increasing popularity of electric vehicles in the commercial sector, particularly in China, further boosts the market growth. Technological advancements in charging infrastructure and battery technology also play a significant role in driving the adoption of electric vehicles in the region.

What is the regulatory landscape for the Hydrogen/BEV/HEV powertrain market?

Government policies and regulations geared at reducing greenhouse gas emissions and encouraging the adoption of renewable energy vehicles comprise the regulatory landscape for the Hydrogen/BEV/HEV powertrain market. The US Environmental Protection Agency recently approved Toyota’s Mirai fuel cell electric vehicle (FCEV), the European Commission approved a 3.2 billion euros battery research project, and the Chinese government approved a new national standard for hydrogen refueling stations.

Shape Your Report to Specific Countries or Regions & Enjoy 30% Off!

What are the major players planning for the future of the Hydrogen/BEV/HEV powertrain market?

The main players in the Hydrogen/BEV/HEV powertrain market are planning for the future by increasing manufacturing capacity and investing in research and development to improve their product offerings. They also collaborate with other businesses and government agencies to broaden their reach and increase their market share. Magna International, for example, announced a collaboration with LG Energy Solution in November 2021 to create advanced electric powertrain systems for EVs.

REPORT ATTRIBUTE DETAILS
Hydrogen/BEV/HEV Powertrain Market by Volume Yes
Hydrogen/BEV/HEV Powertrain Market by Value Yes
Hydrogen/BEV/HEV Powertrain Market, Tornado Analysis Yes
Hydrogen/BEV/HEV Powertrain Market, STAR Analysis Yes
Hydrogen/BEV/HEV Powertrain Market, SRC Analysis Yes
Hydrogen/BEV/HEV Powertrain Market, Import-Export Data Yes (On Demand)
Hydrogen/BEV/HEV Powertrain Market Pricing Analysis Yes (On Demand)
Hydrogen/BEV/HEV Powertrain Market Segment Analysis By Vehicle Type (Battery Electric Vehicle (BEV), Hybrid Electric Vehicle (HEV), Plug-in Hybrid Electric Vehicle (PHEV), and Fuel Cell Vehicle (FCV))

By Powertrain (BEV Powertrain, MHEV Powertrain, Series Hybrid Powertrain, Parallel Hybrid Powertrain, and Series-Parallel Hybrid Powertrain)

By Position/Drive Type (Front-Wheel Drive (Fwd) Powertrain, Rear-Wheel Drive (Rwd) Powertrain, and All-Wheel Drive (Awd) Powertrain)

By Application (Passengers Cars, Light Commercial Vehicles, and Heavy Commercial Vehicles)

Hydrogen/BEV/HEV Powertrain Market, Regional Analysis North America (US and Canada)

Europe (France, Germany, Italy, the UK, Spain, and the Rest of Europe)

Asia Pacific (Japan, China, South Korea, India, South East Asia, and the Rest of Asia Pacific)

Latin America (Brazil, Mexico, and the Rest of Latin America)

Middle East and Africa (GCC Countries, South Africa, and the Rest of the Middle East and Africa)

Hydrogen/BEV/HEV Powertrain Market Key Companies Bosch, Mitsubishi Electric, Magna International, Continental AG, Hitachi, Ballard Power Systems, Cummins Inc, Denso Corporation, Knorr-Bremse Group, Punch Powertrain Nanjing Co Ltd, Magneti Marelli S.p.A., The Voith Group, JATCO Ltd, ZF Friedrichshafen, Aisin Seiki Co. Ltd, Borgwarner Inc, BAE Systems Plc
Hydrogen/BEV/HEV Powertrain Market Competitive Landscape Market Share Analysis

Competitive Benchmarking

Key Players Market Positioning

Geographical Presence Analysis

Major Strategies Adopted

Segmentation of Global Hydrogen/BEV/HEV Powertrain Market-

Global Hydrogen/BEV/HEV Powertrain Market – By Vehicle Type

  • Battery Electric Vehicle (BEV)
  • Hybrid Electric Vehicle (HEV)
  • Plug-in Hybrid Electric Vehicle (PHEV)
  • Fuel Cell Vehicle (FCV)

Global Hydrogen/BEV/HEV Powertrain Market – By Position/Drive Type

  • Front-Wheel Drive (Fwd) Powertrain
  • Rear-Wheel Drive (Rwd) Powertrain
  • All-Wheel Drive (Awd) Powertrain

Global Hydrogen/BEV/HEV Powertrain Market – By Powertrain

  • BEV Powertrain
  • MHEV Powertrain
  • Series Hybrid Powertrain
  • Parallel Hybrid Powertrain
  • Series-Parallel Hybrid Powertrain

Global Hydrogen/BEV/HEV Powertrain Market – By Application

  • Passengers Cars
  • Light Commercial Vehicles
  • Heavy Commercial Vehicles

Global Hydrogen/BEV/HEV Powertrain Market – By Region

  • North America
    • U.S.
    • Canada
  • Europe
    • Germany
    • France
    • U.K.
    • Italy
    • Spain
    • Rest of Europe
  • Asia Pacific
    • China
    • Japan
    • India
    • South Korea
    • South-east Asia
    • Rest of Asia Pacific
  • Latin America
    • Brazil
    • Mexico
    • Rest of Latin America
  • Middle East & Africa
    • GCC Countries
    • South Africa
    • Rest of the Middle East and Africa

1. Preface
1.1. Report Description
1.1.1. Purpose of the Report
1.1.2. Target Audience
1.1.3. USP and Key Offerings
1.2. Research Scope
1.3. Research Methodology
1.3.1. Phase I – Secondary Research
1.3.2. Phase II – Primary Research
1.3.3. Phase III – Expert Panel Review
1.3.4. Approach Adopted
1.3.4.1. Top-Down Approach
1.3.4.2. Bottom-Up Approach
1.3.5. Assumptions
1.4. Market Introduction
1.5. Market Research Scope

2. Executive Summary
2.1. Market Snapshot: Global Hydrogen/BEV/HEV Powertrain Market
2.2. Global Hydrogen/BEV/HEV Powertrain Market, By Powertrain
2.3. Global Hydrogen/BEV/HEV Powertrain Market, By Position/Drive Type
2.4. Global Hydrogen/BEV/HEV Powertrain Market, By Vehicle Type
2.5. Global Hydrogen/BEV/HEV Powertrain Market, By Application
2.6. Global Hydrogen/BEV/HEV Powertrain Market, By Region

3. Market Dynamics & Factors Analysis
3.1. Introduction
3.1.1. Global Hydrogen/BEV/HEV Powertrain Market Value, 2017-2030, (US$ Bn))
3.1.2. Y-o-Y Growth Trend Analysis
3.2. Market Dynamics
3.2.1. Market Drivers
3.2.2. Market Restraints
3.2.3. Market Opportunities
3.2.4. Major Industry Challenges
3.3. Growth and Development Patterns
3.4. Investment Feasibility Analysis
3.5. Market Opportunity Analysis
3.5.1. Powertrain
3.5.2. Position/Drive Type
3.5.3. Vehicle Type
3.5.4. Application
3.5.5. Geography

4. Premium Insights
4.1. STAR (Situation, Task, Action, Results) Analysis
4.2. Porter’s Five Forces Analysis
4.2.1. Threat of New Entrants
4.2.2. Bargaining Power of Buyers/Consumers
4.2.3. Bargaining Power of Suppliers
4.2.4. Threat of Substitute Types
4.2.5. Intensity of Competitive Rivalry
4.3. Key Market Trends
4.3.1. Demand Side Trends
4.3.2. Supply Side Trends
4.4. Value Chain Analysis
4.5. Technology Analysis
4.6. Analysis and Recommendations
4.7. Marketing Strategy Analysis
4.7.1. Direct Marketing
4.7.2. Indirect Marketing
4.7.3. Marketing Channel Development Trend

5. Market Positioning of Key Players, 2022
5.1. Company Market Share of Key Players, 2022
5.2. Competitive Benchmarking
5.3. Market Positioning of Key Vendors
5.4. Geographical Presence Analysis
5.5. Major Strategies Adopted by Key Players
5.5.1. Key Strategies Analysis
5.5.2. Mergers and Acquisitions
5.5.3. Partnerships
5.5.4. Product Launch
5.5.5. Geographical Expansion
5.5.6. Others

6. Economic Impact Analysis
6.1. Recession Impact
6.1.1. North America
6.1.2. Europe
6.1.3. Asia Pacific
6.1.4. Latin America
6.1.5. Middle East and Africa
6.2. Ukraine-Russia War Impact
6.2.1. North America
6.2.2. Europe
6.2.3. Asia Pacific
6.2.4. Latin America
6.2.5. Middle East and Africa
6.3. COVID-19 Impact Analysis
6.3.1. North America
6.3.2. Europe
6.3.3. Asia Pacific
6.3.4. Latin America
6.3.5. Middle East and Africa

7. Global Hydrogen/BEV/HEV Powertrain Market
7.1. Global Hydrogen/BEV/HEV Powertrain Market, by Powertrain, 2017-2030 (US$ Bn))
7.1.1. Overview
7.1.2. Global Hydrogen/BEV/HEV Powertrain Market, By Powertrain, 2022 vs 2030 (in%)
7.1.3. Global Hydrogen/BEV/HEV Powertrain Market, By BEV Powertrain, 2017-2030 (US$ Bn))
7.1.4. Global Hydrogen/BEV/HEV Powertrain Market, By MHEV Powertrain, 2017-2030 (US$ Bn))
7.1.5. Global Hydrogen/BEV/HEV Powertrain Market, By Series Hybrid Powertrain, 2017-2030 (US$ Bn))
7.1.6. Global Hydrogen/BEV/HEV Powertrain Market, By Parallel Hybrid Powertrain, 2017-2030 (US$ Bn))
7.1.7. Global Hydrogen/BEV/HEV Powertrain Market, By Series- Parallel Hybrid Powertrain, 2017-2030 (US$ Bn))
7.2. Global Hydrogen/BEV/HEV Powertrain Market, by Position/Drive Type, 2017-2030 (US$ Bn))
7.2.1. Overview
7.2.2. Global Hydrogen/BEV/HEV Powertrain Market, By Position/Drive Type, 2022 vs 2030 (in%)
7.2.3. Global Hydrogen/BEV/HEV Powertrain Market, By Front-Wheel Drive (Fwd) Powertrain, 2017-2030 (US$ Bn))
7.2.4. Global Hydrogen/BEV/HEV Powertrain Market, By Rear-Wheel Drive (Rwd) Powertrain, 2017-2030 (US$ Bn))
7.2.5. Global Hydrogen/BEV/HEV Powertrain Market, By All-Wheel Drive (Awd) Powertrain, 2017-2030 (US$ Bn))
7.3. Global Hydrogen/BEV/HEV Powertrain Market, by Vehicle Type, 2017-2030 (US$ Bn))
7.3.1. Overview
7.3.2. Global Hydrogen/BEV/HEV Powertrain Market, By Vehicle Type, 2022 vs 2030 (in%)
7.3.3. Global Hydrogen/BEV/HEV Powertrain Market, By Battery Electric Vehicle (BEV), 2017-2030 (US$ Bn))
7.3.4. Global Hydrogen/BEV/HEV Powertrain Market, By Hybrid Electric Vehicle (HEV), 2017-2030 (US$ Bn))
7.3.5. Global Hydrogen/BEV/HEV Powertrain Market, By Plug-in Hybrid Electric Vehicle (PHEV), 2017-2030 (US$ Bn))
7.3.6. Global Hydrogen/BEV/HEV Powertrain Market, By Fuel Cell Vehicle (FCV), 2017-2030 (US$ Bn))
7.4. Global Hydrogen/BEV/HEV Powertrain Market, by Application, 2017-2030 (US$ Bn))
7.4.1. Overview
7.4.2. Global Hydrogen/BEV/HEV Powertrain Market, By Application, 2022 vs 2030 (in%)
7.4.3. Global Hydrogen/BEV/HEV Powertrain Market, By Passengers Cars, 2017-2030 (US$ Bn))
7.4.4. Global Hydrogen/BEV/HEV Powertrain Market, By Light Commercial Vehicles, 2017-2030 (US$ Bn))
7.4.5. Global Hydrogen/BEV/HEV Powertrain Market, By Heavy Commercial Vehicles, 2017-2030 (US$ Bn))

8. North America Hydrogen/BEV/HEV Powertrain Market Analysis
8.1. North America Hydrogen/BEV/HEV Powertrain Market, by Powertrain, 2017-2030(US$ Bn))
8.1.1. Overview
8.1.2. SRC Analysis
8.2. North America Hydrogen/BEV/HEV Powertrain Market, by Position/Drive Type, 2017-2030(US$ Bn))
8.2.1. Overview
8.2.2. SRC Analysis
8.3. North America Hydrogen/BEV/HEV Powertrain Market, by Vehicle Type, 2017-2030(US$ Bn))
8.3.1. Overview
8.3.2. SRC Analysis
8.4. North America Hydrogen/BEV/HEV Powertrain Market, by Application, 2017-2030(US$ Bn))
8.4.1. Overview
8.4.2. SRC Analysis
8.5. North America Hydrogen/BEV/HEV Powertrain Market, by Country, 2017-2030 (US$ Bn))
8.5.1. U.S.
8.5.1.1. U.S. Hydrogen/BEV/HEV Powertrain Market Estimates and Forecast, 2017-2030 (US$ Bn))
8.5.1.2. U.S. Hydrogen/BEV/HEV Powertrain, By Powertrain, 2017-2030 (US$ Bn))
8.5.1.3. U.S. Hydrogen/BEV/HEV Powertrain, By Position/Drive Type, 2017-2030 (US$ Bn))
8.5.1.4. U.S. Hydrogen/BEV/HEV Powertrain, By Vehicle Type, 2017-2030 (US$ Bn))
8.5.1.5. U.S. Hydrogen/BEV/HEV Powertrain, By Application, 2017-2030 (US$ Bn))
8.5.2. Canada
8.5.2.1. Canada Hydrogen/BEV/HEV Powertrain Market Estimates and Forecast, 2017-2030 (US$ Bn))
8.5.2.2. Canada Hydrogen/BEV/HEV Powertrain, By Powertrain, 2017-2030 (US$ Bn))
8.5.2.3. Canada Hydrogen/BEV/HEV Powertrain, By Position/Drive Type, 2017-2030 (US$ Bn))
8.5.2.4. Canada Hydrogen/BEV/HEV Powertrain, By Vehicle Type, 2017-2030 (US$ Bn))
8.5.2.5. Canada Hydrogen/BEV/HEV Powertrain, By Application, 2017-2030 (US$ Bn))

9. Europe Hydrogen/BEV/HEV Powertrain Market Analysis
9.1. Europe Hydrogen/BEV/HEV Powertrain Market, by Powertrain, 2017-2030(US$ Bn))
9.1.1. Overview
9.1.2. SRC Analysis
9.2. Europe Hydrogen/BEV/HEV Powertrain Market, by Position/Drive Type, 2017-2030(US$ Bn))
9.2.1. Overview
9.2.2. SRC Analysis
9.3. Europe Hydrogen/BEV/HEV Powertrain Market, by Vehicle Type, 2017-2030(US$ Bn))
9.3.1. Overview
9.3.2. SRC Analysis
9.4. Europe Hydrogen/BEV/HEV Powertrain Market, by Application, 2017-2030(US$ Bn))
9.4.1. Overview
9.4.2. SRC Analysis
9.5. Europe Hydrogen/BEV/HEV Powertrain Market, by Country, 2017-2030 (US$ Bn))
9.5.1. Germany
9.5.1.1. Germany Hydrogen/BEV/HEV Powertrain Market Estimates and Forecast, 2017-2030 (US$ Bn))
9.5.1.2. Germany Hydrogen/BEV/HEV Powertrain, By Powertrain, 2017-2030 (US$ Bn))
9.5.1.3. Germany Hydrogen/BEV/HEV Powertrain, By Position/Drive Type, 2017-2030 (US$ Bn))
9.5.1.4. Germany Hydrogen/BEV/HEV Powertrain, By Vehicle Type, 2017-2030 (US$ Bn))
9.5.1.5. Germany Hydrogen/BEV/HEV Powertrain, By Application, 2017-2030 (US$ Bn))
9.5.2. France
9.5.2.1. France Hydrogen/BEV/HEV Powertrain Market Estimates and Forecast, 2017-2030 (US$ Bn))
9.5.2.2. France Hydrogen/BEV/HEV Powertrain, By Powertrain, 2017-2030 (US$ Bn))
9.5.2.3. France Hydrogen/BEV/HEV Powertrain, By Position/Drive Type, 2017-2030 (US$ Bn))
9.5.2.4. France Hydrogen/BEV/HEV Powertrain, By Vehicle Type, 2017-2030 (US$ Bn))
9.5.2.5. France Hydrogen/BEV/HEV Powertrain, By Application, 2017-2030 (US$ Bn))
9.5.3. UK
9.5.3.1. UK Hydrogen/BEV/HEV Powertrain Market Estimates and Forecast, 2017-2030 (US$ Bn))
9.5.3.2. UK Hydrogen/BEV/HEV Powertrain, By Powertrain, 2017-2030 (US$ Bn))
9.5.3.3. UK Hydrogen/BEV/HEV Powertrain, By Position/Drive Type, 2017-2030 (US$ Bn))
9.5.3.4. UK Hydrogen/BEV/HEV Powertrain, By Vehicle Type, 2017-2030 (US$ Bn))
9.5.3.5. UK Hydrogen/BEV/HEV Powertrain, By Application, 2017-2030 (US$ Bn))
9.5.4. Italy
9.5.4.1. Italy Hydrogen/BEV/HEV Powertrain Market Estimates and Forecast, 2017-2030 (US$ Bn))
9.5.4.2. Italy Hydrogen/BEV/HEV Powertrain, By Powertrain, 2017-2030 (US$ Bn))
9.5.4.3. Italy Hydrogen/BEV/HEV Powertrain, By Position/Drive Type, 2017-2030 (US$ Bn))
9.5.4.4. Italy Hydrogen/BEV/HEV Powertrain, By Vehicle Type, 2017-2030 (US$ Bn))
9.5.4.5. Italy Hydrogen/BEV/HEV Powertrain, By Application, 2017-2030 (US$ Bn))
9.5.5. Spain
9.5.5.1. Spain Hydrogen/BEV/HEV Powertrain Market Estimates and Forecast, 2017-2030 (US$ Bn))
9.5.5.2. Spain Hydrogen/BEV/HEV Powertrain, By Powertrain, 2017-2030 (US$ Bn))
9.5.5.3. Spain Hydrogen/BEV/HEV Powertrain, By Position/Drive Type, 2017-2030 (US$ Bn))
9.5.5.4. Spain Hydrogen/BEV/HEV Powertrain, By Vehicle Type, 2017-2030 (US$ Bn))
9.5.5.5. Spain Hydrogen/BEV/HEV Powertrain, By Application, 2017-2030 (US$ Bn))
9.5.6. Rest of Europe
9.5.6.1. Rest of Europe Hydrogen/BEV/HEV Powertrain Market Estimates and Forecast, 2017-2030 (US$ Bn))
9.5.6.2. Rest of Europe Hydrogen/BEV/HEV Powertrain, By Powertrain, 2017-2030 (US$ Bn))
9.5.6.3. Rest of Europe Hydrogen/BEV/HEV Powertrain, By Position/Drive Type, 2017-2030 (US$ Bn))
9.5.6.4. Rest of Europe Hydrogen/BEV/HEV Powertrain, By Vehicle Type, 2017-2030 (US$ Bn))
9.5.6.5. Rest of Europe Hydrogen/BEV/HEV Powertrain, By Application, 2017-2030 (US$ Bn))

10. Asia Pacific Hydrogen/BEV/HEV Powertrain Market Analysis
10.1. Asia Pacific Hydrogen/BEV/HEV Powertrain Market, by Powertrain, 2017-2030(US$ Bn))
10.1.1. Overview
10.1.2. SRC Analysis
10.2. Asia Pacific Hydrogen/BEV/HEV Powertrain Market, by Position/Drive Type, 2017-2030(US$ Bn))
10.2.1. Overview
10.2.2. SRC Analysis
10.3. Asia Pacific Hydrogen/BEV/HEV Powertrain Market, by Vehicle Type, 2017-2030(US$ Bn))
10.3.1. Overview
10.3.2. SRC Analysis
10.4. Asia Pacific Hydrogen/BEV/HEV Powertrain Market, by Application, 2017-2030(US$ Bn))
10.4.1. Overview
10.4.2. SRC Analysis
10.5. Asia Pacific Hydrogen/BEV/HEV Powertrain Market, by Country, 2017-2030 (US$ Bn))
10.5.1. China
10.5.1.1. China Hydrogen/BEV/HEV Powertrain Market Estimates and Forecast, 2017-2030 (US$ Bn))
10.5.1.2. China Hydrogen/BEV/HEV Powertrain, By Powertrain, 2017-2030 (US$ Bn))
10.5.1.3. China Hydrogen/BEV/HEV Powertrain, By Position/Drive Type, 2017-2030 (US$ Bn))
10.5.1.4. China Hydrogen/BEV/HEV Powertrain, By Vehicle Type, 2017-2030 (US$ Bn))
10.5.1.5. China Hydrogen/BEV/HEV Powertrain, By Application, 2017-2030 (US$ Bn))
10.5.2. Japan
10.5.2.1. Japan Hydrogen/BEV/HEV Powertrain Market Estimates and Forecast, 2017-2030 (US$ Bn))
10.5.2.2. Japan Hydrogen/BEV/HEV Powertrain, By Powertrain, 2017-2030 (US$ Bn))
10.5.2.3. Japan Hydrogen/BEV/HEV Powertrain, By Position/Drive Type, 2017-2030 (US$ Bn))
10.5.2.4. Japan Hydrogen/BEV/HEV Powertrain, By Vehicle Type, 2017-2030 (US$ Bn))
10.5.2.5. Japan Hydrogen/BEV/HEV Powertrain, By Application, 2017-2030 (US$ Bn))
10.5.3. India
10.5.3.1. India Hydrogen/BEV/HEV Powertrain Market Estimates and Forecast, 2017-2030 (US$ Bn))
10.5.3.2. India Hydrogen/BEV/HEV Powertrain, By Powertrain, 2017-2030 (US$ Bn))
10.5.3.3. India Hydrogen/BEV/HEV Powertrain, By Position/Drive Type, 2017-2030 (US$ Bn))
10.5.3.4. India Hydrogen/BEV/HEV Powertrain, By Vehicle Type, 2017-2030 (US$ Bn))
10.5.3.5. India Hydrogen/BEV/HEV Powertrain, By Application, 2017-2030 (US$ Bn))
10.5.4. South Korea
10.5.4.1. South Korea Hydrogen/BEV/HEV Powertrain Market Estimates and Forecast, 2017-2030 (US$ Bn))
10.5.4.2. South Korea Hydrogen/BEV/HEV Powertrain, By Powertrain, 2017-2030 (US$ Bn))
10.5.4.3. South Korea Hydrogen/BEV/HEV Powertrain, By Position/Drive Type, 2017-2030 (US$ Bn))
10.5.4.4. South Korea Hydrogen/BEV/HEV Powertrain, By Vehicle Type, 2017-2030 (US$ Bn))
10.5.4.5. South Korea Hydrogen/BEV/HEV Powertrain, By Application, 2017-2030 (US$ Bn))
10.5.5. South-East Asia
10.5.5.1. South-East Asia Hydrogen/BEV/HEV Powertrain Market Estimates and Forecast, 2017-2030 (US$ Bn))
10.5.5.2. South-East Asia Hydrogen/BEV/HEV Powertrain, By Powertrain, 2017-2030 (US$ Bn))
10.5.5.3. South-East Asia Hydrogen/BEV/HEV Powertrain, By Position/Drive Type, 2017-2030 (US$ Bn))
10.5.5.4. South-East Asia Hydrogen/BEV/HEV Powertrain, By Vehicle Type, 2017-2030 (US$ Bn))
10.5.5.5. South-East Asia Hydrogen/BEV/HEV Powertrain, By Application, 2017-2030 (US$ Bn))
10.5.6. Rest of Asia Pacific
10.5.6.1. Rest of Asia Pacific Hydrogen/BEV/HEV Powertrain Market Estimates and Forecast, 2017-2030 (US$ Bn))
10.5.6.2. Rest of Asia Pacific Hydrogen/BEV/HEV Powertrain, By Powertrain, 2017-2030 (US$ Bn))
10.5.6.3. Rest of Asia Pacific Hydrogen/BEV/HEV Powertrain, By Position/Drive Type, 2017-2030 (US$ Bn))
10.5.6.4. Rest of Asia Pacific Hydrogen/BEV/HEV Powertrain, By Vehicle Type, 2017-2030 (US$ Bn))
10.5.6.5. Rest of Asia Pacific Hydrogen/BEV/HEV Powertrain, By Application, 2017-2030 (US$ Bn))

11. Latin America Hydrogen/BEV/HEV Powertrain Market Analysis
11.1. Latin America Hydrogen/BEV/HEV Powertrain Market, by Powertrain, 2017-2030(US$ Bn))
11.1.1. Overview
11.1.2. SRC Analysis
11.2. Latin America Hydrogen/BEV/HEV Powertrain Market, by Position/Drive Type, 2017-2030(US$ Bn))
11.2.1. Overview
11.2.2. SRC Analysis
11.3. Latin America Hydrogen/BEV/HEV Powertrain Market, by Vehicle Type, 2017-2030(US$ Bn))
11.3.1. Overview
11.3.2. SRC Analysis
11.4. Latin America Hydrogen/BEV/HEV Powertrain Market, by Application, 2017-2030(US$ Bn))
11.4.1. Overview
11.4.2. SRC Analysis
11.5. Latin America Hydrogen/BEV/HEV Powertrain Market, by Country, 2017-2030 (US$ Bn))
11.5.1. Brazil
11.5.1.1. Brazil Hydrogen/BEV/HEV Powertrain Market Estimates and Forecast, 2017-2030 (US$ Bn))
11.5.1.2. Brazil Hydrogen/BEV/HEV Powertrain, By Powertrain, 2017-2030 (US$ Bn))
11.5.1.3. Brazil Hydrogen/BEV/HEV Powertrain, By Position/Drive Type, 2017-2030 (US$ Bn))
11.5.1.4. Brazil Hydrogen/BEV/HEV Powertrain, By Vehicle Type, 2017-2030 (US$ Bn))
11.5.1.5. Brazil Hydrogen/BEV/HEV Powertrain, By Application, 2017-2030 (US$ Bn))
11.5.2. Mexico
11.5.2.1. Mexico Hydrogen/BEV/HEV Powertrain Market Estimates and Forecast, 2017-2030 (US$ Bn))
11.5.2.2. Mexico Hydrogen/BEV/HEV Powertrain, By Powertrain, 2017-2030 (US$ Bn))
11.5.2.3. Mexico Hydrogen/BEV/HEV Powertrain, By Position/Drive Type, 2017-2030 (US$ Bn))
11.5.2.4. Mexico Hydrogen/BEV/HEV Powertrain, By Vehicle Type, 2017-2030 (US$ Bn))
11.5.2.5. Mexico Hydrogen/BEV/HEV Powertrain, By Application, 2017-2030 (US$ Bn))
11.5.3. Rest of Latin America
11.5.3.1. Rest of Latin America Hydrogen/BEV/HEV Powertrain Market Estimates and Forecast, 2017-2030 (US$ Bn))
11.5.3.2. Rest of Latin America Hydrogen/BEV/HEV Powertrain, By Powertrain, 2017-2030 (US$ Bn))
11.5.3.3. Rest of Latin America Hydrogen/BEV/HEV Powertrain, By Position/Drive Type, 2017-2030 (US$ Bn))
11.5.3.4. Rest of Latin America Hydrogen/BEV/HEV Powertrain, By Vehicle Type, 2017-2030 (US$ Bn))
11.5.3.5. Rest of Latin America Hydrogen/BEV/HEV Powertrain, By Application, 2017-2030 (US$ Bn))

12. Middle East and Africa Hydrogen/BEV/HEV Powertrain Market Analysis
12.1. Middle East and Africa Hydrogen/BEV/HEV Powertrain Market, by Powertrain, 2017-2030(US$ Bn))
12.1.1. Overview
12.1.2. SRC Analysis
12.2. Middle East and Africa Hydrogen/BEV/HEV Powertrain Market, by Position/Drive Type, 2017-2030(US$ Bn))
12.2.1. Overview
12.2.2. SRC Analysis
12.3. Middle East and Africa Hydrogen/BEV/HEV Powertrain Market, by Vehicle Type, 2017-2030(US$ Bn))
12.3.1. Overview
12.3.2. SRC Analysis
12.4. Middle East and Africa Hydrogen/BEV/HEV Powertrain Market, by Application, 2017-2030(US$ Bn))
12.4.1. Overview
12.4.2. SRC Analysis
12.5. Middle East and Africa Hydrogen/BEV/HEV Powertrain Market, by Country, 2017-2030 (US$ Bn))
12.5.1. GCC Countries
12.5.1.1. GCC Countries Hydrogen/BEV/HEV Powertrain Market Estimates and Forecast, 2017-2030 (US$ Bn))
12.5.1.2. GCC Countries Hydrogen/BEV/HEV Powertrain, By Powertrain, 2017-2030 (US$ Bn))
12.5.1.3. GCC Countries Hydrogen/BEV/HEV Powertrain, By Position/Drive Type, 2017-2030 (US$ Bn))
12.5.1.4. GCC Countries Hydrogen/BEV/HEV Powertrain, By Vehicle Type, 2017-2030 (US$ Bn))
12.5.1.5. GCC Countries Hydrogen/BEV/HEV Powertrain, By Application, 2017-2030 (US$ Bn))
12.5.2. South Africa
12.5.2.1. South Africa Hydrogen/BEV/HEV Powertrain Market Estimates and Forecast, 2017-2030 (US$ Bn))
12.5.2.2. South Africa Hydrogen/BEV/HEV Powertrain, By Powertrain, 2017-2030 (US$ Bn))
12.5.2.3. South Africa Hydrogen/BEV/HEV Powertrain, By Position/Drive Type, 2017-2030 (US$ Bn))
12.5.2.4. South Africa Hydrogen/BEV/HEV Powertrain, By Vehicle Type, 2017-2030 (US$ Bn))
12.5.2.5. South Africa Hydrogen/BEV/HEV Powertrain, By Application, 2017-2030 (US$ Bn))
12.5.3. Rest of Middle East and Africa
12.5.3.1. Rest of Middle East and Africa Hydrogen/BEV/HEV Powertrain Market Estimates and Forecast, 2017-2030 (US$ Bn))
12.5.3.2. Rest of Middle East and Africa Hydrogen/BEV/HEV Powertrain, By Powertrain, 2017-2030 (US$ Bn))
12.5.3.3. Rest of Middle East and Africa Hydrogen/BEV/HEV Powertrain, By Position/Drive Type, 2017-2030 (US$ Bn))
12.5.3.4. Rest of Middle East and Africa Hydrogen/BEV/HEV Powertrain, By Vehicle Type, 2017-2030 (US$ Bn))
12.5.3.5. Rest of Middle East and Africa Hydrogen/BEV/HEV Powertrain, By Application, 2017-2030 (US$ Bn))

13. Company Profiles
13.1. Bosch
13.1.1. Company Overview
13.1.2. Products/Services Portfolio
13.1.3. Geographical Presence
13.1.4. Financial Summary
13.1.4.1. Market Revenue and Net Profit (2019-2022)
13.1.4.2. Business Segment Revenue Analysis
13.1.4.3. Geographical Revenue Analysis
13.2. Mitsubishi Electric
13.3. Magna International
13.4. Continental AG
13.5. Hitachi
13.6. Ballard Power Systems
13.7. Cummins Inc
13.8. Denso Corporation
13.9. Knorr-Bremse Group
13.10. Punch Powertrain Nanjing Co Ltd
13.11. Magneti Marelli S.p.A.
13.12. The Voith Group
13.13. JATCO Ltd
13.14. ZF Friedrichshafen
13.15. Aisin Seiki Co. Ltd
13.16. Borgwarner Inc
13.17. BAE Systems Plc

List of Figures
FIG. 1 Global Hydrogen/BEV/HEV Powertrain Market: Research Methodology
FIG. 2 Market Size Estimation – Top Down & Bottom up Approach
FIG. 3 Global Hydrogen/BEV/HEV Powertrain Market Segmentation
FIG. 4 Global Hydrogen/BEV/HEV Powertrain Market, by Powertrain, 2022 (US$ Bn))
FIG. 5 Global Hydrogen/BEV/HEV Powertrain Market, by Position/Drive Type, 2022 (US$ Bn))
FIG. 6 Global Hydrogen/BEV/HEV Powertrain Market, by Vehicle Type, 2022 (US$ Bn))
FIG. 7 Global Hydrogen/BEV/HEV Powertrain Market, by Application, 2022 (US$ Bn))
FIG. 8 Global Hydrogen/BEV/HEV Powertrain Market, by Geography, 2022 (US$ Bn))
FIG. 9 Attractive Investment Proposition, by Powertrain, 2022
FIG. 10 Attractive Investment Proposition, by Position/Drive Type, 2022
FIG. 11 Attractive Investment Proposition, by Vehicle Type, 2022
FIG. 12 Attractive Investment Proposition, by Application, 2022
FIG. 13 Attractive Investment Proposition, by Geography, 2022
FIG. 14 Global Market Share Analysis of Key Hydrogen/BEV/HEV Powertrain Market Manufacturers, 2022
FIG. 15 Global Market Positioning of Key Hydrogen/BEV/HEV Powertrain Market Manufacturers, 2022
FIG. 16 Global Hydrogen/BEV/HEV Powertrain Market Value Contribution, By Powertrain, 2022 & 2030 (Value %)
FIG. 17 Global Hydrogen/BEV/HEV Powertrain Market, by BEV Powertrain, Value, 2017-2030 (US$ Bn))
FIG. 18 Global Hydrogen/BEV/HEV Powertrain Market, by MHEV Powertrain, Value, 2017-2030 (US$ Bn))
FIG. 19 Global Hydrogen/BEV/HEV Powertrain Market, by Series Hybrid Powertrain, Value, 2017-2030 (US$ Bn))
FIG. 20 Global Hydrogen/BEV/HEV Powertrain Market, by Parallel Hybrid Powertrain, Value, 2017-2030 (US$ Bn))
FIG. 21 Global Hydrogen/BEV/HEV Powertrain Market, by Series- Parallel Hybrid Powertrain, Value, 2017-2030 (US$ Bn))
FIG. 22 Global Hydrogen/BEV/HEV Powertrain Market Value Contribution, By Position/Drive Type, 2022 & 2030 (Value %)
FIG. 23 Global Hydrogen/BEV/HEV Powertrain Market, by Front-Wheel Drive (Fwd) Powertrain, Value, 2017-2030 (US$ Bn))
FIG. 24 Global Hydrogen/BEV/HEV Powertrain Market, by Rear-Wheel Drive (Rwd) Powertrain, 2017-2030 (US$ Bn))
FIG. 25 Global Hydrogen/BEV/HEV Powertrain Market, by All-Wheel Drive (Awd) Powertrain, 2017-2030 (US$ Bn))
FIG. 26 Global Hydrogen/BEV/HEV Powertrain Market Value Contribution, By Vehicle Type, 2022 & 2030 (Value %)
FIG. 27 Global Hydrogen/BEV/HEV Powertrain Market, by Battery Electric Vehicle (BEV), Value, 2017-2030 (US$ Bn))
FIG. 28 Global Hydrogen/BEV/HEV Powertrain Market, by Hybrid Electric Vehicle (HEV), 2017-2030 (US$ Bn))
FIG. 29 Global Hydrogen/BEV/HEV Powertrain Market, by Plug-in Hybrid Electric Vehicle (PHEV), 2017-2030 (US$ Bn))
FIG. 30 Global Hydrogen/BEV/HEV Powertrain Market, by Fuel Cell Vehicle (FCV), 2017-2030 (US$ Bn))
FIG. 31 Global Hydrogen/BEV/HEV Powertrain Market Value Contribution, By Application, 2022 & 2030 (Value %)
FIG. 32 Global Hydrogen/BEV/HEV Powertrain Market, by Passengers Cars, Value, 2017-2030 (US$ Bn))
FIG. 33 Global Hydrogen/BEV/HEV Powertrain Market, by Light Commercial Vehicles, Value, 2017-2030 (US$ Bn))
FIG. 34 Global Hydrogen/BEV/HEV Powertrain Market, by Heavy Commercial Vehicles, 2017-2030 (US$ Bn))
FIG. 35 North America Hydrogen/BEV/HEV Powertrain Market, 2017-2030 (US$ Bn))
FIG. 36 U.S. Hydrogen/BEV/HEV Powertrain Market, 2017-2030 (US$ Bn))
FIG. 37 Canada Hydrogen/BEV/HEV Powertrain Market, 2017-2030 (US$ Bn))
FIG. 38 Europe Hydrogen/BEV/HEV Powertrain Market, 2017-2030 (US$ Bn))
FIG. 39 Germany Hydrogen/BEV/HEV Powertrain Market, 2017-2030 (US$ Bn))
FIG. 40 France Hydrogen/BEV/HEV Powertrain Market, 2017-2030 (US$ Bn))
FIG. 41 U.K. Hydrogen/BEV/HEV Powertrain Market, 2017-2030 (US$ Bn))
FIG. 42 Italy Hydrogen/BEV/HEV Powertrain Market, 2017-2030 (US$ Bn))
FIG. 43 Spain Hydrogen/BEV/HEV Powertrain Market, 2017-2030 (US$ Bn))
FIG. 44 Rest of Europe Hydrogen/BEV/HEV Powertrain Market, 2017-2030 (US$ Bn))
FIG. 45 Asia Pacific Hydrogen/BEV/HEV Powertrain Market, 2017-2030 (US$ Bn))
FIG. 46 China Hydrogen/BEV/HEV Powertrain Market, 2017-2030 (US$ Bn))
FIG. 47 Japan Hydrogen/BEV/HEV Powertrain Market, 2017-2030 (US$ Bn))
FIG. 48 India Hydrogen/BEV/HEV Powertrain Market, 2017-2030 (US$ Bn))
FIG. 49 South Korea Hydrogen/BEV/HEV Powertrain Market, 2017-2030 (US$ Bn))
FIG. 50 South-East Asia Hydrogen/BEV/HEV Powertrain Market, 2017-2030 (US$ Bn))
FIG. 51 Rest of Asia Pacific Hydrogen/BEV/HEV Powertrain Market, 2017-2030 (US$ Bn))
FIG. 52 Latin America Hydrogen/BEV/HEV Powertrain Market, 2017-2030 (US$ Bn))
FIG. 53 Brazil Hydrogen/BEV/HEV Powertrain Market, 2017-2030 (US$ Bn))
FIG. 54 Mexico Hydrogen/BEV/HEV Powertrain Market, 2017-2030 (US$ Bn))
FIG. 55 Rest of Latin America Hydrogen/BEV/HEV Powertrain Market, 2017-2030 (US$ Bn))
FIG. 56 Middle East & Africa Hydrogen/BEV/HEV Powertrain Market, 2017-2030 (US$ Bn))
FIG. 57 GCC Countries Hydrogen/BEV/HEV Powertrain Market, 2017-2030 (US$ Bn))
FIG. 58 South Africa Hydrogen/BEV/HEV Powertrain Market, 2017-2030 (US$ Bn))
FIG. 59 Rest of Middle East and Africa Hydrogen/BEV/HEV Powertrain Market, 2017-2030 (US$ Bn))

List of Tables
TABLE 1 Market Snapshot: Global Hydrogen/BEV/HEV Powertrain Market
TABLE 2 Global Hydrogen/BEV/HEV Powertrain Market, by Competitive Benchmarking, 2022
TABLE 3 Global Hydrogen/BEV/HEV Powertrain Market, by Geographical Presence Analysis, 2022
TABLE 4 Global Hydrogen/BEV/HEV Powertrain Market, by Key Strategies Analysis, 2022
TABLE 5 Global Hydrogen/BEV/HEV Powertrain Market, by Powertrain, 2017-2030 (US$ Bn))
TABLE 6 Global Hydrogen/BEV/HEV Powertrain Market, by Position/Drive Type, 2017-2030 (US$ Bn))
TABLE 7 Global Hydrogen/BEV/HEV Powertrain Market, by Vehicle Type, 2017-2030 (US$ Bn))
TABLE 8 Global Hydrogen/BEV/HEV Powertrain Market, by Application, 2017-2030 (US$ Bn))
TABLE 9 Global Hydrogen/BEV/HEV Powertrain Market, by Geography, 2017-2030 (US$ Bn))
TABLE 10 North America Hydrogen/BEV/HEV Powertrain Market, by Powertrain, 2017-2030 (US$ Bn))
TABLE 11 North America Hydrogen/BEV/HEV Powertrain Market, by Position/Drive Type, 2017-2030 (US$ Bn))
TABLE 12 North America Hydrogen/BEV/HEV Powertrain Market, by Vehicle Type, 2017-2030 (US$ Bn))
TABLE 13 North America Hydrogen/BEV/HEV Powertrain Market, by Application, 2017-2030 (US$ Bn))
TABLE 14 North America Hydrogen/BEV/HEV Powertrain Market, by Country, 2017-2030 (US$ Bn))
TABLE 15 US Hydrogen/BEV/HEV Powertrain Market, by Powertrain, 2017-2030 (US$ Bn))
TABLE 16 US Hydrogen/BEV/HEV Powertrain Market, by Position/Drive Type, 2017-2030 (US$ Bn))
TABLE 17 US Hydrogen/BEV/HEV Powertrain Market, by Vehicle Type, 2017-2030 (US$ Bn))
TABLE 18 US Hydrogen/BEV/HEV Powertrain Market, by Application, 2017-2030 (US$ Bn))
TABLE 19 Canada Hydrogen/BEV/HEV Powertrain Market, by Powertrain, 2017-2030 (US$ Bn))
TABLE 20 Canada Hydrogen/BEV/HEV Powertrain Market, by Position/Drive Type, 2017-2030 (US$ Bn))
TABLE 21 Canada Hydrogen/BEV/HEV Powertrain Market, by Vehicle Type, 2017-2030 (US$ Bn))
TABLE 22 Canada Hydrogen/BEV/HEV Powertrain Market, by Application, 2017-2030 (US$ Bn))
TABLE 23 Europe Hydrogen/BEV/HEV Powertrain Market, by Powertrain, 2017-2030 (US$ Bn))
TABLE 24 Europe Hydrogen/BEV/HEV Powertrain Market, by Position/Drive Type, 2017-2030 (US$ Bn))
TABLE 25 Europe Hydrogen/BEV/HEV Powertrain Market, by Vehicle Type, 2017-2030 (US$ Bn))
TABLE 26 Europe Hydrogen/BEV/HEV Powertrain Market, by Application, 2017-2030 (US$ Bn))
TABLE 27 Europe Hydrogen/BEV/HEV Powertrain Market, by Country, 2017-2030 (US$ Bn))
TABLE 28 Germany Hydrogen/BEV/HEV Powertrain Market, by Powertrain, 2017-2030 (US$ Bn))
TABLE 29 Germany Hydrogen/BEV/HEV Powertrain Market, by Position/Drive Type, 2017-2030 (US$ Bn))
TABLE 30 Germany Hydrogen/BEV/HEV Powertrain Market, by Vehicle Type, 2017-2030 (US$ Bn))
TABLE 31 Germany Hydrogen/BEV/HEV Powertrain Market, by Application, 2017-2030 (US$ Bn))
TABLE 32 France Hydrogen/BEV/HEV Powertrain Market, by Powertrain, 2017-2030 (US$ Bn))
TABLE 33 France Hydrogen/BEV/HEV Powertrain Market, by Position/Drive Type, 2017-2030 (US$ Bn))
TABLE 34 France Hydrogen/BEV/HEV Powertrain Market, by Vehicle Type, 2017-2030 (US$ Bn))
TABLE 35 France Hydrogen/BEV/HEV Powertrain Market, by Application, 2017-2030 (US$ Bn))
TABLE 36 UK Hydrogen/BEV/HEV Powertrain Market, by Powertrain, 2017-2030 (US$ Bn))
TABLE 37 UK Hydrogen/BEV/HEV Powertrain Market, by Position/Drive Type, 2017-2030 (US$ Bn))
TABLE 38 UK Hydrogen/BEV/HEV Powertrain Market, by Vehicle Type, 2017-2030 (US$ Bn))
TABLE 39 UK Hydrogen/BEV/HEV Powertrain Market, by Application, 2017-2030 (US$ Bn))
TABLE 40 Italy Hydrogen/BEV/HEV Powertrain Market, by Powertrain, 2017-2030 (US$ Bn))
TABLE 41 Italy Hydrogen/BEV/HEV Powertrain Market, by Position/Drive Type, 2017-2030 (US$ Bn))
TABLE 42 Italy Hydrogen/BEV/HEV Powertrain Market, by Vehicle Type, 2017-2030 (US$ Bn))
TABLE 43 Italy Hydrogen/BEV/HEV Powertrain Market, by Application, 2017-2030 (US$ Bn))
TABLE 44 Spain Hydrogen/BEV/HEV Powertrain Market, by Powertrain, 2017-2030 (US$ Bn))
TABLE 45 Spain Hydrogen/BEV/HEV Powertrain Market, by Position/Drive Type, 2017-2030 (US$ Bn))
TABLE 46 Spain Hydrogen/BEV/HEV Powertrain Market, by Vehicle Type, 2017-2030 (US$ Bn))
TABLE 47 Spain Hydrogen/BEV/HEV Powertrain Market, by Application, 2017-2030 (US$ Bn))
TABLE 48 Rest of Europe Hydrogen/BEV/HEV Powertrain Market, by Powertrain, 2017-2030 (US$ Bn))
TABLE 49 Rest of Europe Hydrogen/BEV/HEV Powertrain Market, by Position/Drive Type, 2017-2030 (US$ Bn))
TABLE 50 Rest of Europe Hydrogen/BEV/HEV Powertrain Market, by Vehicle Type, 2017-2030 (US$ Bn))
TABLE 51 Rest of Europe Hydrogen/BEV/HEV Powertrain Market, by Application, 2017-2030 (US$ Bn))
TABLE 52 Asia Pacific Hydrogen/BEV/HEV Powertrain Market, by Powertrain, 2017-2030 (US$ Bn))
TABLE 53 Asia Pacific Hydrogen/BEV/HEV Powertrain Market, by Position/Drive Type, 2017-2030 (US$ Bn))
TABLE 54 Asia Pacific Hydrogen/BEV/HEV Powertrain Market, by Vehicle Type, 2017-2030 (US$ Bn))
TABLE 55 Asia Pacific Hydrogen/BEV/HEV Powertrain Market, by Application, 2017-2030 (US$ Bn))
TABLE 56 Asia Pacific Hydrogen/BEV/HEV Powertrain Market, by Country, 2017-2030 (US$ Bn))
TABLE 57 China Hydrogen/BEV/HEV Powertrain Market, by Powertrain, 2017-2030 (US$ Bn))
TABLE 58 China Hydrogen/BEV/HEV Powertrain Market, by Position/Drive Type, 2017-2030 (US$ Bn))
TABLE 59 China Hydrogen/BEV/HEV Powertrain Market, by Vehicle Type, 2017-2030 (US$ Bn))
TABLE 60 China Hydrogen/BEV/HEV Powertrain Market, by Application, 2017-2030 (US$ Bn))
TABLE 61 Japan Hydrogen/BEV/HEV Powertrain Market, by Powertrain, 2017-2030 (US$ Bn))
TABLE 62 Japan Hydrogen/BEV/HEV Powertrain Market, by Position/Drive Type, 2017-2030 (US$ Bn))
TABLE 63 Japan Hydrogen/BEV/HEV Powertrain Market, by Vehicle Type, 2017-2030 (US$ Bn))
TABLE 64 Japan Hydrogen/BEV/HEV Powertrain Market, by Application, 2017-2030 (US$ Bn))
TABLE 65 India Hydrogen/BEV/HEV Powertrain Market, by Powertrain, 2017-2030 (US$ Bn))
TABLE 66 India Hydrogen/BEV/HEV Powertrain Market, by Position/Drive Type, 2017-2030 (US$ Bn))
TABLE 67 India Hydrogen/BEV/HEV Powertrain Market, by Vehicle Type, 2017-2030 (US$ Bn))
TABLE 68 India Hydrogen/BEV/HEV Powertrain Market, by Application, 2017-2030 (US$ Bn))
TABLE 69 South Korea Hydrogen/BEV/HEV Powertrain Market, by Powertrain, 2017-2030 (US$ Bn))
TABLE 70 South Korea Hydrogen/BEV/HEV Powertrain Market, by Position/Drive Type, 2017-2030 (US$ Bn))
TABLE 71 South Korea Hydrogen/BEV/HEV Powertrain Market, by Vehicle Type, 2017-2030 (US$ Bn))
TABLE 72 South Korea Hydrogen/BEV/HEV Powertrain Market, by Application, 2017-2030 (US$ Bn))
TABLE 73 South-East Asia Hydrogen/BEV/HEV Powertrain Market, by Powertrain, 2017-2030 (US$ Bn))
TABLE 74 South-East Asia Hydrogen/BEV/HEV Powertrain Market, by Position/Drive Type, 2017-2030 (US$ Bn))
TABLE 75 South-East Asia Hydrogen/BEV/HEV Powertrain Market, by Vehicle Type, 2017-2030 (US$ Bn))
TABLE 76 South-East Asia Hydrogen/BEV/HEV Powertrain Market, by Application, 2017-2030 (US$ Bn))
TABLE 77 Rest of Asia Pacific Hydrogen/BEV/HEV Powertrain Market, by Powertrain, 2017-2030 (US$ Bn))
TABLE 78 Rest of Asia Pacific Hydrogen/BEV/HEV Powertrain Market, by Position/Drive Type, 2017-2030 (US$ Bn))
TABLE 79 Rest of Asia Pacific Hydrogen/BEV/HEV Powertrain Market, by Vehicle Type, 2017-2030 (US$ Bn))
TABLE 80 Rest of Asia Pacific Hydrogen/BEV/HEV Powertrain Market, by Application, 2017-2030 (US$ Bn))
TABLE 81 Latin America Hydrogen/BEV/HEV Powertrain Market, by Powertrain, 2017-2030 (US$ Bn))
TABLE 82 Latin America Hydrogen/BEV/HEV Powertrain Market, by Position/Drive Type, 2017-2030 (US$ Bn))
TABLE 83 Latin America Hydrogen/BEV/HEV Powertrain Market, by Vehicle Type, 2017-2030 (US$ Bn))
TABLE 84 Latin America Hydrogen/BEV/HEV Powertrain Market, by Application, 2017-2030 (US$ Bn))
TABLE 85 Latin America Hydrogen/BEV/HEV Powertrain Market, by Country, 2017-2030 (US$ Bn))
TABLE 86 Brazil Hydrogen/BEV/HEV Powertrain Market, by Powertrain, 2017-2030 (US$ Bn))
TABLE 87 Brazil Hydrogen/BEV/HEV Powertrain Market, by Position/Drive Type, 2017-2030 (US$ Bn))
TABLE 88 Brazil Hydrogen/BEV/HEV Powertrain Market, by Vehicle Type, 2017-2030 (US$ Bn))
TABLE 89 Brazil Hydrogen/BEV/HEV Powertrain Market, by Application, 2017-2030 (US$ Bn))
TABLE 90 Mexico Hydrogen/BEV/HEV Powertrain Market, by Powertrain, 2017-2030 (US$ Bn))
TABLE 91 Mexico Hydrogen/BEV/HEV Powertrain Market, by Position/Drive Type, 2017-2030 (US$ Bn))
TABLE 92 Mexico Hydrogen/BEV/HEV Powertrain Market, by Vehicle Type, 2017-2030 (US$ Bn))
TABLE 93 Mexico Hydrogen/BEV/HEV Powertrain Market, by Application, 2017-2030 (US$ Bn))
TABLE 94 Rest of Latin America Hydrogen/BEV/HEV Powertrain Market, by Powertrain, 2017-2030 (US$ Bn))
TABLE 95 Rest of Latin America Hydrogen/BEV/HEV Powertrain Market, by Position/Drive Type, 2017-2030 (US$ Bn))
TABLE 96 Rest of Latin America Hydrogen/BEV/HEV Powertrain Market, by Vehicle Type, 2017-2030 (US$ Bn))
TABLE 97 Rest of Latin America Hydrogen/BEV/HEV Powertrain Market, by Application, 2017-2030 (US$ Bn))
TABLE 98 Middle East and Africa Hydrogen/BEV/HEV Powertrain Market, by Powertrain, 2017-2030 (US$ Bn))
TABLE 99 Middle East and Africa Hydrogen/BEV/HEV Powertrain Market, by Position/Drive Type, 2017-2030 (US$ Bn))
TABLE 100 Middle East and Africa Hydrogen/BEV/HEV Powertrain Market, by Vehicle Type, 2017-2030 (US$ Bn))
TABLE 101 Middle East and Africa Hydrogen/BEV/HEV Powertrain Market, by Application, 2017-2030 (US$ Bn))
TABLE 102 Middle East and Africa Hydrogen/BEV/HEV Powertrain Market, by Country, 2017-2030 (US$ Bn))
TABLE 103 GCC Countries Hydrogen/BEV/HEV Powertrain Market, by Powertrain, 2017-2030 (US$ Bn))
TABLE 104 GCC Countries Hydrogen/BEV/HEV Powertrain Market, by Position/Drive Type, 2017-2030 (US$ Bn))
TABLE 105 GCC Countries Hydrogen/BEV/HEV Powertrain Market, by Vehicle Type, 2017-2030 (US$ Bn))
TABLE 106 GCC Countries Hydrogen/BEV/HEV Powertrain Market, by Application, 2017-2030 (US$ Bn))
TABLE 107 South Africa Hydrogen/BEV/HEV Powertrain Market, by Powertrain, 2017-2030 (US$ Bn))
TABLE 108 South Africa Hydrogen/BEV/HEV Powertrain Market, by Position/Drive Type, 2017-2030 (US$ Bn))
TABLE 109 South Africa Hydrogen/BEV/HEV Powertrain Market, by Vehicle Type, 2017-2030 (US$ Bn))
TABLE 110 South Africa Hydrogen/BEV/HEV Powertrain Market, by Application, 2017-2030 (US$ Bn))
TABLE 111 Rest of Middle East and Africa Hydrogen/BEV/HEV Powertrain Market, by Powertrain, 2017-2030 (US$ Bn))
TABLE 112 Rest of Middle East and Africa Hydrogen/BEV/HEV Powertrain Market, by Position/Drive Type, 2017-2030 (US$ Bn))
TABLE 113 Rest of Middle East and Africa Hydrogen/BEV/HEV Powertrain Market, by Vehicle Type, 2017-2030 (US$ Bn))
TABLE 114 Rest of Middle East and Africa Hydrogen/BEV/HEV Powertrain Market, by Application, 2017-2030 (US$ Bn))

Frequently asked questions

How does COVID-19 impact the global Hydrogen/BEV/HEV powertrain market?

The COVID-19 pandemic has impacted the global Hydrogen/BEV/HEV powertrain market due to various factors such as supply chain disruptions, reduced demand, and economic uncertainty. The pandemic has led to a decline in sales and production of vehicles, affecting market growth.

Which is the leading region of the Hydrogen/BEV/HEV powertrain market?

In 2022, North America held the largest revenue share of the global Hydrogen/BEV/HEV powertrain market.

What are the key drivers for the growth of the Hydrogen/BEV/HEV powertrain market?

The main drivers for the growth of the Hydrogen/BEV/HEV powertrain market include increased government regulations on emission control, growing demand for fuel-efficient vehicles, and technological advancements.

Which is the major Hydrogen/BEV/HEV powertrain market segment by vehicle type?

The hybrid electric vehicle (HEV) segment had a major global market share in 2022.

Which is the major segment in the Hydrogen/BEV/HEV powertrain market by application?

The heavy commercial vehicles segment had a major share in the global market.

North America High Capacity Power Banks Market

Published:
Report ID: 14188

3D Printing Market

Published:
Report ID: 994

South Asia and Oceania Residential Electric Grill Market

Published:
Report ID: 35022

Industrial Motherboards Market

Published:
Report ID: 35012

Air Handling Units Market

Published:
Report ID: 1365

Washing Appliance Market

Published:
Report ID: 34938

Gas Sensors Market

Published:
Report ID: 6251

Ultrasonic Sensors Market

Published:
Report ID: 34496

Roll To Roll (R2R) Technology For Flexible Device Market

Published:
Report ID: 10099

Industrial Sensor Market

Published:
Report ID: 34177

Articulated Arm Machine Market

Published:
Report ID: 1742

Circuit Protection Market

Published:
Report ID: 34128

Purchase Options

$2999
Delivery Format: Excel.
$4999
Designed for the individual purchaser.
$6999
Users located at a single corporate site or regional office.
$7999
Allowed for unlimited sharing globally within one company.
Smallform of Sample request

Have a question?

User Profile

Don’t settle for less – trust Mitul to help you find the best solution.

Report delivery within 24 to 48 hours

– Other Info –

What people say?-

User Review

I am very impressed with the information in this report. The author clearly did their research when they came up with this product and it has already given me a lot of ideas.

Jana Schmidt
CEDAR CX Technologies

– Connect with us –

Phone

+91 6232 49 3207


support

24/7 Research Support


sales@credenceresearch.com

– Research Methodology –

Going beyond the basics: advanced techniques in research methodology

– Trusted By –

Pepshi, LG, Nestle
Motorola, Honeywell, Johnson and johnson
LG Chem, SIEMENS, Pfizer
Unilever, Samsonite, QIAGEN