
Market Overview
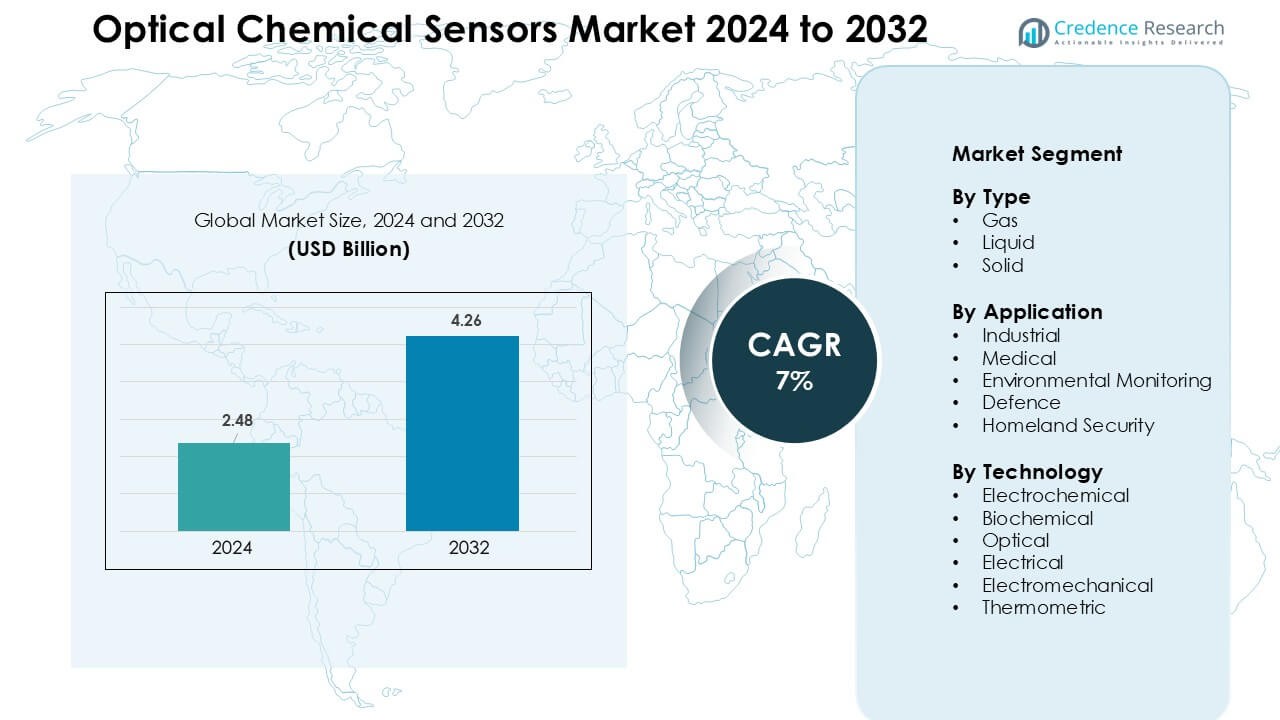
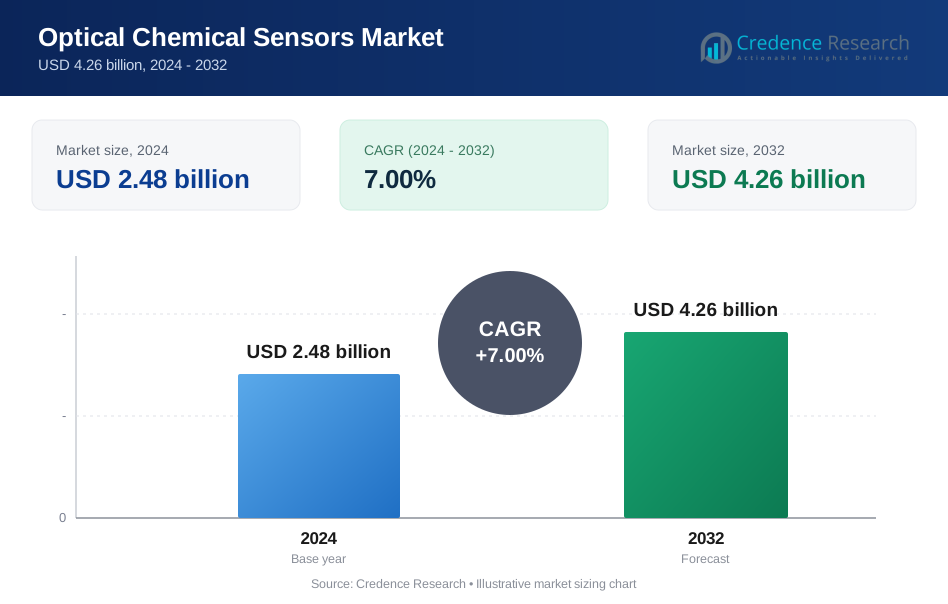
Optical Chemical Sensors Market was valued at USD 2.48 billion in 2024 and is anticipated to reach USD 4.26 billion by 2032, growing at a CAGR of 7 % during the forecast period.
| REPORT ATTRIBUTE | DETAILS |
|---|---|
| Historical Period | 2020-2023 |
| Base Year | 2024 |
| Forecast Period | 2025-2032 |
| Optical Chemical Sensors Market Size 2024 | USD 2.48 Billion |
| Optical Chemical Sensors Market, CAGR | 7% |
| Optical Chemical Sensors Market Size 2032 | USD 4.26 Billion |
The Optical Chemical Sensors Market includes leading players such as Honeywell International, ABB, Teledyne Technologies, Robert Bosch, Alpha MOS, Siemens, Halma, Emerson Electric, General Electric, and Abbott Laboratories. These companies strengthen their position by advancing fiber-optic platforms, enhancing biochemical detection capability, and integrating AI-supported analytics for real-time monitoring. Product innovation, regulatory compliance, and strong OEM partnerships help them scale across industrial, medical, and environmental applications. North America remained the leading region in 2024 with 36% share, supported by high technology adoption, strong R&D investments, and strict emission-control and safety regulations across major industries.
Market Insights
- The Optical Chemical Sensors Market reached USD 2.48 billion in 2024 and is projected to hit USD 4.26 billion by 2032, growing at a 7% CAGR.
- Growth is driven by rising demand for real-time gas and liquid monitoring across industrial, medical, and environmental applications, with gas-sensing type leading at 47% share due to strong adoption in process-safety systems.
- Miniaturized optical platforms, AI-enabled analytics, and fiber-optic integration shape major trends as industries shift toward automated and remote monitoring solutions.
- Competition remains strong among global players focusing on advanced optical precision, sensor durability, and integrated diagnostics, supported by partnerships in industrial safety, healthcare, and environmental surveillance.
- North America dominates with 36% share, followed by Europe at 29% and Asia-Pacific at 25%, while industrial applications lead with 42% share due to increased adoption in emission control, chemical processing, and automation programs.
Market Segmentation Analysis:
By Type
Gas sensors held the dominant position in 2024 with an estimated 47% share due to their strong adoption in leak detection, process monitoring, and emission control across industrial sites. These sensors offer fast response, high sensitivity, and stable performance in harsh environments, which increases demand in oil & gas, chemicals, and power facilities. Liquid sensors gained traction in wastewater testing and clinical diagnostics, while solid sensors expanded their use in food quality checks and material analysis as industries adopted stricter contamination standards.
- For instance, INFICON a global supplier of leak detectors and gas analyzers provides fixed gas leak detectors used in refrigeration, HVAC, and industrial chemical plants; INFICON’s instruments are used worldwide for rapid detection of trace leaks, helping prevent hazardous incidents across facilities.
By Application
Industrial applications led this segment with nearly 42% share in 2024, driven by stricter safety rules, automation growth, and rising process-monitoring needs in manufacturing and energy sectors. Medical use grew steadily as optical sensors supported non-invasive diagnostics, real-time imaging, and clinical analyzers. Environmental monitoring adoption increased through rising air and water quality checks, especially in urban areas. Defence and homeland security markets used these sensors for chemical-agent detection and perimeter surveillance, with growing investment in early-warning systems.
- For instance, Honeywell produces a broad portfolio of fixed and portable gas & flame detectors more than 300 products detecting 28 different gases used in petrochemical plants and refineries for continuous leak and combustion-gas monitoring, safeguarding workers and process safety.
By Technology
Optical technology remained the dominant sub-segment with roughly 44% share in 2024 because it delivers high accuracy, immunity to electromagnetic interference, and compatibility with remote and fiber-based sensing. Its strong performance in gas detection, biomedical imaging, and environmental testing supported wider installation across critical facilities. Biochemical sensing advanced through demand for biomarker detection, while electrochemical and electrical platforms served cost-sensitive applications. Electromechanical and thermometric technologies grew in niche uses where thermal drift analysis and mechanical change detection were required.
Key Growth Drivers
Rising Demand for Real-Time Monitoring Across Industries
Growing need for continuous and accurate chemical detection drives strong adoption of optical chemical sensors across industrial, medical, and environmental sectors. Manufacturers rely on real-time monitoring to control gas leaks, prevent chemical exposure, and maintain process stability in oil & gas, power plants, and chemical facilities. Healthcare systems use these sensors for quick diagnostic screening, non-invasive imaging, and point-of-care testing. Environmental agencies deploy fiber-optic platforms to track pollutants in air and water with higher precision than conventional tools. Strict regulations on emissions, workplace safety, and contamination further push industries to adopt advanced optical sensors. Their fast response, immunity to electromagnetic noise, and suitability for harsh conditions make them ideal for automated systems and remote operations. With smart factories expanding and urban air-quality programs increasing, the need for reliable optical detection continues to strengthen global market growth.
- For instance, optical chemical sensors employing absorption, fluorescence or refractive-index change detection have been demonstrated for rapid detection of metal ions and biomolecules in liquids, enabling in-situ analysis without elaborate sample preparation.
Expanding Use in Medical Diagnostics and Clinical Applications
Optical chemical sensors gain strong traction in medical diagnostics due to their ability to detect biomarkers, gases, and biochemical changes with high sensitivity. Hospitals rely on these sensors for optical imaging, breath analysis, glucose monitoring, and cancer screening tools. Their non-invasive measurement capability reduces patient discomfort and accelerates diagnostic turnaround time. Microfluidic devices and lab-on-chip systems further integrate optical sensing to support portable and rapid testing in emergency care and home-health settings. Increased adoption of personalized medicine and early disease detection fuels demand for optical platforms with improved accuracy and faster detection cycles. Growth in chronic diseases drives broader deployment of optical biosensors for continuous monitoring. As healthcare moves toward advanced digital diagnostics and AI-enabled decision support, optical sensors play a key role in delivering precise, real-time biochemical information. This expanding clinical relevance continues to strengthen market expansion worldwide.
- For instance, new wearable optical devices using nanophotonic or plasmonic sensing are being developed to continuously monitor biomarkers (e.g. glucose) non-invasively via sweat or other bodily fluids promising continuous patient monitoring outside hospital settings.
Environmental Monitoring and Government Regulatory Pressure
Governments worldwide increase investments in environmental surveillance, creating strong demand for optical chemical sensors in air and water monitoring programs. These sensors detect pollutants such as VOCs, nitrates, ammonia, and heavy metals at trace levels, which helps agencies meet tighter environmental compliance limits. Industrial plants adopt these systems to track emission levels, reduce ecological impact, and avoid regulatory penalties. Optical sensors are preferred due to their stability, long operational life, and ability to function in remote areas with minimal maintenance. Expanding smart-city projects also integrate optical sensing networks into environmental stations for real-time pollutant mapping and public-health risk alerts. Growth in climate-related risks increases the need for continuous monitoring of greenhouse gases and hazardous discharge. With stricter global sustainability targets, optical chemical sensing becomes essential for meeting reporting standards and supporting ecological protection efforts across key regions.
Key Trends & Opportunities
Integration of AI, IoT, and Fiber-Optic Platforms
The market sees strong momentum from the integration of optical sensors with AI-enabled analytics, IoT networks, and cloud-based platforms. AI algorithms enhance signal interpretation, reduce errors, and support advanced predictive analysis for industrial and medical systems. IoT connectivity enables wireless data transfer, remote calibration, and continuous monitoring across distributed environments such as manufacturing lines, clinics, and environmental stations. Fiber-optic sensors gain popularity due to their lightweight design, flexibility, and immunity to electromagnetic interference. Expanded use in smart factories, oil rigs, and hazardous sites creates opportunities for automated safety systems. Vendors invest in compact, low-power optical modules that simplify installation and scale across multi-sensor networks. Growth in digital transformation across industries makes intelligent optical sensing a major opportunity for system integrators and hardware manufacturers.
- For instance, a specific study using recent research shows that combining Distributed Acoustic Sensing (DAS) a fiber-optic sensing technique with machine-learning models can raise event-recognition accuracy from about 83.4% to 95.4% on data from previously unseen environments.
Miniaturization and Advancement of Lab-on-Chip Technologies
The shift toward miniaturized and portable optical chemical sensors opens significant growth prospects in clinical diagnostics, environmental testing, and consumer electronics. Lab-on-chip devices integrate optical sensing elements into compact formats that deliver rapid, low-volume analysis, making them ideal for point-of-care and home-based testing. Advances in microfabrication, nanophotonics, and plasmonic materials help improve detection limits while reducing power requirements. Wearable optical sensors gain interest for continuous monitoring of biomarkers, gases, and physiological indicators. Miniaturization also enables deployment in smart appliances, industrial robots, and mobile detection units. Startups and research institutes increasingly develop hybrid optical-biochemical devices that combine fluorescence, Raman, and fiber-optic techniques to expand sensing functionality. This trend supports new commercial opportunities in diagnostics, food-quality analysis, and field-deployable environmental tools.
- For instance, microfluidic “lab-on-a-chip” platforms using integrated optical detection have been demonstrated to analyze bacteria susceptibility in sample volumes as small as 150 picolitres a dramatic reduction compared to conventional lab assays enabling rapid and resource-efficient microbial testing for food-safety or clinical diagnostics.
Key Challenges
High Cost of Advanced Optical Sensor Technologies
Despite their accuracy and reliability, advanced optical chemical sensors remain expensive due to complex materials, precision fabrication, and integration with photonic components. Many industries, especially small and mid-sized manufacturers, face budget constraints when upgrading to high-end optical platforms. Costs also rise with the need for supporting hardware such as light sources, detectors, calibration tools, and data-processing units. Limited price competitiveness compared to electrochemical sensors slows adoption in cost-sensitive industries like agriculture and municipal services. Maintenance and replacement expenses further challenge long-term deployment. Vendors must innovate low-cost materials and scalable production methods to reduce pricing gaps and expand market penetration globally.
Technical Limitations in Harsh and Complex Environments
Optical chemical sensors face performance challenges in environments with high temperature, extreme humidity, strong vibrations, or heavy contamination. Optical components may degrade or lose calibration when exposed to corrosive chemicals or high particulate levels. Signal interference, fouling on sensor surfaces, and alignment issues can reduce accuracy and response speed. In field applications such as offshore rigs, mining sites, and industrial furnaces, maintaining sensor stability becomes difficult. Environmental noise and fluctuating light conditions affect optical pathways, requiring frequent recalibration. These limitations push developers to create more rugged, self-cleaning, and interference-resistant designs. Until these challenges are mitigated, adoption in the most demanding applications may grow slower than expected.
Regional Analysis
North America
North America led the Optical Chemical Sensors Market in 2024 with around 36% share, driven by strong adoption in industrial safety, medical diagnostics, and environmental monitoring. The U.S. remained the core hub due to advanced manufacturing, high R&D spending, and strong regulatory oversight on emissions and workplace safety. Healthcare providers expanded their use of optical biosensors for rapid diagnostics and non-invasive testing. The region’s oil & gas sector relied on optical gas-detection systems to strengthen leak prevention and process control. Growing investments in smart-city air-quality networks further supported regional market expansion.
Europe
Europe accounted for nearly 29% share in 2024, supported by strict environmental policies, strong industrial automation, and advanced healthcare systems. Countries such as Germany, France, and the U.K. adopted optical sensors to enhance industrial emission control and chemical-process safety. The region’s strong research base accelerated innovations in fiber-optic sensing and biomedical diagnostics. Increasing focus on climate monitoring and air-quality improvement boosted deployment in environmental stations. Expanding pharmaceutical manufacturing also elevated the use of optical biochemical sensors for precision analysis. Supportive EU regulations promoting low-pollution technologies continued to strengthen market demand across major industries.
Asia-Pacific
Asia-Pacific held about 25% share in 2024 and remained the fastest-growing region due to rapid industrial expansion, rising pollution concerns, and increased healthcare investment. China, Japan, South Korea, and India adopted optical sensing systems in manufacturing plants, chemical processing, and environmental surveillance. Governments accelerated air and water monitoring initiatives due to urbanization and stricter pollution-control measures. Demand in medical diagnostics rose as hospitals expanded imaging and point-of-care testing capabilities. Growth in semiconductor and electronics manufacturing supported advanced optical-sensor integration. Regional innovation hubs invested in miniaturized and low-cost optical sensing technologies to meet rising domestic and export demand.
Latin America
Latin America captured nearly 6% share in 2024, driven by increased industrial modernization and environmental-monitoring programs in Brazil, Mexico, and Argentina. Petrochemical and mining operations adopted optical sensors to strengthen leak detection, workplace safety, and emission tracking. Governments invested in air-quality testing networks due to rising urban pollution. Healthcare facilities slowly expanded optical-based diagnostic equipment, although budget constraints limited high-end adoption. Demand for water-quality monitoring technologies grew as industries moved toward stricter compliance. While market progress remains gradual, rising investments in industrial automation and public-health surveillance are expected to support steady growth across the region.
Middle East & Africa (MEA)
MEA accounted for around 4% share in 2024, supported by adoption in oil & gas, petrochemicals, and security applications. Gulf nations implemented optical gas-detection and fiber-optic monitoring systems to enhance pipeline safety and refinery operations. Environmental agencies expanded water-salinity and air-quality tracking due to arid-climate challenges. Healthcare growth in the UAE and Saudi Arabia increased the use of optical diagnostic tools. African regions showed rising interest in pollution-monitoring solutions but faced cost constraints. Growing homeland-security spending and industrial-safety regulations continued to create demand for reliable optical chemical sensing systems.
Market Segmentations:
By Type
- Gas
- Liquid
- Solid
By Application
- Industrial
- Medical
- Environmental Monitoring
- Defence
- Homeland Security
By Technology
- Electrochemical
- Biochemical
- Optical
- Electrical
- Electromechanical
- Thermometric
By Geography
- North America
- U.S.
- Canada
- Mexico
- Europe
- Germany
- France
- U.K.
- Italy
- Spain
- Rest of Europe
- Asia Pacific
- China
- Japan
- India
- South Korea
- South-east Asia
- Rest of Asia Pacific
- Latin America
- Brazil
- Argentina
- Rest of Latin America
- Middle East & Africa
- GCC Countries
- South Africa
- Rest of the Middle East and Africa
Competitive Landscape
The competitive landscape of the Optical Chemical Sensors Market features strong participation from global leaders such as Honeywell International, ABB, Teledyne Technologies, Robert Bosch, Alpha MOS, Siemens, Halma, Emerson Electric, General Electric, and Abbott Laboratories. These companies compete by advancing high-precision optical platforms, expanding product portfolios, and integrating AI-enabled analytics for faster and more reliable detection. Many players invest in miniaturized and fiber-optic designs to serve industrial, medical, and environmental applications. Strategic partnerships with chemical plants, healthcare facilities, and environmental-monitoring agencies help strengthen market reach. Firms also focus on improving sensor durability, lowering maintenance needs, and enhancing compatibility with automated systems. Growing demand for real-time monitoring drives companies to accelerate innovation and expand manufacturing capabilities across key regions.
Key Player Analysis
- Honeywell International
- ABB
- Teledyne Technologies
- Robert Bosch
- Alpha MOS
- Siemens
- Halma
- Emerson Electric
- General Electric (GE)
- Abbot Laboratories
Recent Developments
- In November 2025 (and earlier 2024–2025 activity), Teledyne Technologies: Teledyne has been rolling out new optical/imaging sensor products and space-qualified CMOS/imaging sensors that feed into environmental and scientific sensing markets (announcements include Teledyne FLIR product introductions at SPIE/VISION in 2024 and a Nov 13, 2025 Teledyne Space Imaging announcement about upscreened sensors and evaluation kits). These developments expand Teledyne’s portfolio of digital/optical imaging sensors used in environmental monitoring, spectroscopy, and other optical sensing applications that overlap with the optical chemical sensor market.
- In May 2025, Honeywell: Honeywell announced a new Hydrogen Leak Detector (HLD) solution engineered to detect microscopic hydrogen leaks in real time (sensing solution announced May 6, 2025). Honeywell continues to market optical/infrared gas-detection products as part of its gas-detection portfolio (e.g., the Searchline open-path infrared gas detector family), positioning the company in applications that overlap with the optical chemical-sensing market (gas leak detection, industrial safety, hydrogen economy).
- In 2024, ABB announced an acquisition (press release dated 8 Jan 2024) of an innovative optical-sensor company to expand its smart-water and environmental monitoring offering a strategic move that strengthens ABB’s optical sensor capabilities (including optical analyzers and hyperspectral/laser-based detection) relevant to chemical- and emissions-monitoring applications. ABB has also highlighted optical solutions such as UviTec optical water analyzers and laser-based MobileGuard™ gas-leak detection in subsequent event briefings (ENVEX 2025).
Report Coverage
The research report offers an in-depth analysis based on Type, Application, Technology and Geography. It details leading market players, providing an overview of their business, product offerings, investments, revenue streams, and key applications. Additionally, the report includes insights into the competitive environment, SWOT analysis, current market trends, as well as the primary drivers and constraints. Furthermore, it discusses various factors that have driven market expansion in recent years. The report also explores market dynamics, regulatory scenarios, and technological advancements that are shaping the industry. It assesses the impact of external factors and global economic changes on market growth. Lastly, it provides strategic recommendations for new entrants and established companies to navigate the complexities of the market.
Future Outlook
- Demand for real-time monitoring will rise as industries adopt smarter safety systems.
- Medical diagnostics will expand optical biosensor adoption for faster and non-invasive testing.
- Environmental agencies will increase deployment for advanced air and water quality tracking.
- Miniaturized and wearable optical sensors will gain wider use in healthcare and consumer devices.
- AI-driven analytics will enhance detection accuracy and support predictive monitoring.
- Fiber-optic platforms will see stronger uptake in harsh and remote industrial environments.
- Smart-city programs will integrate optical sensors for continuous pollution mapping.
- Defense and homeland security will adopt compact optical units for chemical-threat detection.
- Industrial automation will boost demand for high-precision optical sensing modules.
- Manufacturers will invest in rugged, self-calibrating designs to overcome environmental limitations.
Request a Free Sample
Fill in your details and we'll send you a free sample report.
- Sample data tables & charts
- Research methodology
Need a Custom Version of This Report?
Tailor the scope, geography, or segments to your exact requirements.
- Custom geography or segment scope
- Direct access to our analyst team
Frequently Asked Questions
What is the current market size for Optical Chemical Sensors Market, and what is its projected size in 2032?
At what Compound Annual Growth Rate is Optical Chemical Sensors Market projected to grow between 2024 and 2032?
Which Optical Chemical Sensors Market segment held the largest share in 2024?
What are the primary factors fueling the growth of Optical Chemical Sensors Market?
Who are the leading companies in Optical Chemical Sensors Market?
Which region commanded the largest share of Optical Chemical Sensors Market?
Table of Content
Chapter 1. Report Introduction
- 1.1 Report Description & Purpose
- 1.1.1 Report Title & Market Definition
- 1.1.2 Unique Selling Propositions (USP) & Key Differentiators
- 1.1.3 Value Proposition for Stakeholders
- 1.2 Research Objectives
- 1.2.1 Market Sizing Objectives (Volume & Revenue)
- 1.2.2 Segmentation Objectives
- 1.2.3 Competitive Intelligence Objectives
- 1.2.4 Forecast & Scenario Objectives
- 1.3 Report Scope
- 1.3.1 Optical Chemical Sensors Scope – Types & Subtypes Covered
- 1.3.2 Geographic Scope – Regions & Countries Covered
- 1.3.3 Historical Period, Base Year & Forecast Period (2024; forecast to 2032)
- 1.3.4 Inclusions & Exclusions
- 1.4 HS Code & Classification Framework
- 1.5 Currency, Units & Pricing Basis
- 1.6 Target Stakeholders
- 1.7 Limitations & Assumptions
Chapter 2. Executive Summary
- 2.1 Global Optical Chemical Sensors Market Snapshot
- 2.1.1 Market Size – Historical (2024) & Forecast (2024-2032) (2024: USD 2.48 billion → 2032: USD 4.26 billion)
- 2.1.2 Volume & Revenue – Global Totals
- 2.1.3 Key Market Highlights – Top Five Facts
- 2.2 Optical Chemical Sensors Market Segmentation Snapshot
- 2.2.1 Market Split by Region – 2024 vs. 2032
- 2.3 Competitive Snapshot
- 2.3.1 Top 10 Players by Revenue Share – 2024
- 2.3.2 Top 10 Players by Volume Share – 2024
- 2.3.3 Recent Strategic Developments (18-Month Summary)
- 2.4 Key Investment Highlights & Strategic Conclusions
Chapter 3. Optical Chemical Sensors Market Dynamics & Industry Analysis
- 3.1 Market Overview & Context
- 3.1.1 Optical Chemical Sensors Market Position in the Broader Automotive Value Chain
- 3.1.2 OEM vs. Replacement Market Dynamics
- 3.1.3 Market Maturity & Development Stage by Region
- 3.2 Optical Chemical Sensors Market Drivers
- 3.3 Optical Chemical Sensors Market Restraints & Challenges
- 3.4 Optical Chemical Sensors Market Opportunities
- 3.5 Porter's Five Forces Analysis
- 3.5.1 Threat of New Entrants
- 3.5.2 Bargaining Power of Suppliers
- 3.5.3 Bargaining Power of Buyers
- 3.5.4 Threat of Substitutes
- 3.5.5 Competitive Rivalry – Intensity Assessment
- 3.6 Optical Chemical Sensors Value Chain Analysis
- 3.6.1 Upstream – Raw Material/Input Suppliers
- 3.6.1.1 Raw Material/Input 1
- 3.6.1.2 Raw Material/Input 2
- 3.6.1.3 Raw Material/Input 3
- 3.6.2 Midstream – Production/Manufacturing/Service Delivery
- 3.6.2.1 Production/Process Overview
- 3.6.2.2 Key Facility Locations & Capacity by Manufacturer
- 3.6.3 Downstream – Distribution & End Consumer
- 3.6.3.1 Primary Channel – B2B/OEM
- 3.6.3.2 Secondary Channels – Dealer, Retail, Online, Direct
- 3.6.4 Value Chain Profitability Analysis
- 3.6.1 Upstream – Raw Material/Input Suppliers
- 3.7 PESTEL Analysis
- 3.7.1 Political Factors
- 3.7.2 Economic Factors
- 3.7.3 Social Factors
- 3.7.4 Technological Factors
- 3.7.5 Environmental Factors
- 3.7.6 Legal Factors
- 3.8 Optical Chemical Sensors Supply Chain Analysis
- 3.8.1 Raw Material/Input Supply Risk Assessment
- 3.8.2 Manufacturing Concentration Risk (Geographic Exposure)
- 3.8.3 Trade Disruption Impact Analysis
- 3.9 Regulatory & Policy Landscape
Note: The regulatory and policy landscape section covers regulations based on their applicability to the market, Optical Chemical Sensors category, geography, and scope of the study. Only regulatory frameworks with a material impact on operations, compliance, trade, sustainability, or market access are analyzed in detail.
Chapter 4. Key Investment Pockets & Opportunity Analysis
- 4.1 Optical Chemical Sensors Market Attractiveness Analysis
- 4.1.1 By Region – Investment Attractiveness Matrix (Volume × CAGR)
- 4.2 Absolute Revenue Growth Opportunity
- 4.2.1 By Region – Absolute USD Growth Through 2032
- 4.3 Incremental Volume Opportunity
- 4.3.1 By Region – Incremental Volume Through 2032
- 4.3.2 Segment – Incremental Volume
- 4.4 Emerging Submarket Opportunity Deep Dive (Subject to Applicability)
- 4.5 Emerging Market Opportunity Scorecards
- 4.5.1 United States
- 4.5.2 Europe
- 4.5.3 Asia
- 4.5.4 Middle East & Africa
Note: Emerging Market Opportunity Scorecards will be included based on relevance and strategic importance. Regions listed are indicative and may vary depending on data availability and market dynamics.
Chapter 5. Optical Chemical Sensors Import-Export Analysis & Trade Flows
- 5.1 Global Trade Overview
- 5.1.1 Global Export Value by Country (2024)
- 5.1.2 Global Export Volume by Country (2024)
- 5.1.3 Global Import Value by Country (2024)
- 5.1.4 Global Import Volume by Country (2024)
- 5.1.5 Net Trade Balance by Country (2024)
- 5.2 Export Analysis – Segment
- 5.2.1 Type 1 (HS Code)
- 5.2.2 Type 2 (HS Code)
- 5.2.3 Type 3 (HS Code)
- 5.2.4 Type 4 (HS Code)
- 5.2.5 Type 5 (HS Code)
- 5.3 Import Analysis – Segment
- 5.3.1 Type 1 (HS Code)
- 5.3.2 Type 2 (HS Code)
- 5.3.3 Type 3 (HS Code)
- 5.3.4 Type 4 (HS Code)
- 5.3.5 Type 5 (HS Code)
- 5.4 Average Unit Trade Prices
- 5.4.1 Average Export Price – Segment & Country
- 5.4.2 Average Import Price – Segment & Source Country
- 5.4.3 Price Trends (2024)
- 5.5 Key Trade Route Analysis
- 5.5.1 Trade Route 1
- 5.5.2 Trade Route 2
- 5.5.3 Trade Route 3
- 5.5.4 Trade Route 4
- 5.5.5 Trade Route 5
- 5.6 Trade Policy Impact Assessment
- 5.6.1 US Anti-Dumping & Section 301 Tariffs
- 5.6.2 EU Customs Union Impact
- 5.6.3 Major Free Trade Agreements
- 5.6.4 USMCA Rules of Origin
Note: Trade policy analysis will be included only where relevant to the Optical Chemical Sensors market.
Chapter 6. Competitive Landscape & Company Benchmarking
- 6.1 Optical Chemical Sensors Market Concentration & Structure
- 6.1.1 Herfindahl-Hirschman Index (HHI) – vs. 2024
- 6.1.2 Tier 1, Tier 2 & Tier 3 Market Structure
- 6.1.3 Global, Regional & Local Player Dynamics
- 6.2 Optical Chemical Sensors Market Share Analysis – 2024
- 6.2.1 Global Revenue Share by Company
- 6.2.2 Global Volume Share by Company
- 6.2.3 Regional Revenue Share
- 6.2.4 Market Share Evolution ( vs. 2024)
- 6.2.5 OEM Segment Share by Company
- 6.2.6 Replacement Segment Share by Company
- 6.3 Production/Delivery Capacity & Facility Analysis
- 6.3.1 Global Installed Capacity
- 6.3.2 Capacity Utilization Rates
- 6.3.3 Production/Output Volume
- 6.3.4 Facility Locations & Capacity Map
- 6.3.5 Planned Capacity Additions
- 6.4 Optical Chemical Sensors Competitive Benchmarking Matrix
- 6.4.1 Revenue, Volume, CAGR & Profitability Comparison
- 6.4.2 Channel Revenue Mix
- 6.4.3 Geographic Revenue Exposure
- 6.4.4 R&D Intensity
- 6.4.5 Sustainability Maturity
- 6.5 Strategic Developments in Optical Chemical Sensors (Last 24 Months)
- 6.5.1 Mergers, Acquisitions & Divestments
- 6.5.2 New Optical Chemical Sensors Launches
- 6.5.3 Facility Expansions
- 6.5.4 Strategic Alliances, Joint Ventures & Partnerships
- 6.5.5 Distribution Expansion & Market Entry
- 6.5.6 Sustainability & ESG Initiatives
- 6.6 Competitive Strategy Mapping
- 6.6.1 Leader, Challenger, Follower & Niche Classification
- 6.6.2 Pricing Strategy Comparison
- 6.6.3 Channel Strategy Matrix
Note: Strategic developments are included based on their materiality and the availability of reliable information.
Chapter 7. Global Optical Chemical Sensors Market – By Distribution Channel
- 7.1 Segment Overview
- 7.1.1 Volume & Revenue Split by Channel (2024 & 2032)
- 7.1.2 Channel Mix Evolution (2024-2032)
Chapter 8. Regional Market Analysis – Global Overview
- 8.1 Global Regional Overview
- 8.1.1 Regional Volume Share
- 8.1.2 Regional Revenue Share
- 8.1.3 Regional Volume by Region
- 8.1.4 Regional Revenue by Region
- 8.1.5 Regional Forecast Through 2032
- 8.2 Cross-Regional Segment Analysis
- 8.2.1 By Distribution Channel
- 8.2.2 By Brand/Price Tier
Chapter 9. North America Optical Chemical Sensors Market
- 9.1 United States
- 9.2 Canada
- 9.3 Mexico
Chapter 10. Europe Optical Chemical Sensors Market
- 10.1 Germany
- 10.2 France
- 10.3 Italy
- 10.4 United Kingdom
- 10.5 Spain
- 10.6 Poland
- 10.7 Russia
- 10.8 Netherlands
- 10.9 Belgium
- 10.10 Sweden
- 10.11 Denmark
- 10.12 Norway
- 10.13 Rest of Europe
Chapter 11. Asia Pacific Optical Chemical Sensors Market
- 11.1 China
- 11.2 India
- 11.3 Japan
- 11.4 South Korea
- 11.5 Thailand
- 11.6 Indonesia
- 11.7 Vietnam
- 11.8 Malaysia
- 11.9 Australia
- 11.10 Rest of Asia Pacific
Chapter 12. Latin America Optical Chemical Sensors Market
- 12.1 Brazil
- 12.2 Argentina
- 12.3 Colombia
- 12.4 Chile
- 12.5 Rest of Latin America
Chapter 13. Middle East Optical Chemical Sensors Market
- 13.1 Saudi Arabia
- 13.2 United Arab Emirates
- 13.3 Turkey
- 13.4 Israel
- 13.5 Iran
- 13.6 Rest of the Middle East
Chapter 14. Africa Optical Chemical Sensors Market
- 14.1 South Africa
- 14.2 Egypt
- 14.3 Nigeria
- 14.4 Morocco
- 14.5 Rest of Africa
Chapter 15. Optical Chemical Sensors Company Profiles
- 15.1 [Company 01]
- 15.1.1 Company Overview
- 15.1.2 Key Management Personnel
- 15.1.3 Products & Services Portfolio
- 15.1.4 Financial Performance
- 15.1.5 Key Market Focus & Geographic Presence
- 15.1.6 Recent Developments & Strategic Initiatives
Note: The company profile list is preliminary and may change based on research findings, market developments, data availability, and client requirements.
Chapter 16. Appendices
- Appendix A – List of Abbreviations & Acronyms
- Appendix B – Industry Classification Code Reference – Full Series
- Appendix C – Production & Capacity Data Tables
- Appendix D – End-Use & Demand Base Tables
- Appendix E – Consumption & Replacement Rate Assumptions
- Appendix F – ASP Reference Tables
- Appendix G – Manufacturing & Facility Database
- Appendix H – Import-Export Data Tables
- Appendix I – Regulatory Summary Tables
- Appendix J – Primary Research Participant List (Anonymized)
- Appendix K – Primary Research Questionnaire Framework
- Appendix L – Data Sources & Bibliography
- Appendix M – Market Size Divergence & Source Comparison
Chapter 17. Research Methodology
- 17.1 Research Framework & Philosophy
- 17.2 Secondary Research – Sources, Hierarchy & Data Extraction
- 17.3 Data Modeling – Bottom-Up & Top-Down Market Sizing
- 17.4 Primary Research – Stakeholder Framework, LOI & Sample Sizes
- 17.5 Forecast Methodology – Regression, Scenario & Sensitivity Analysis
- 17.6 Quality Control – Four-Layer Validation Framework
- 17.7 Limitations & Standard Assumptions
- 17.8 Disclaimer
