
Market Overview
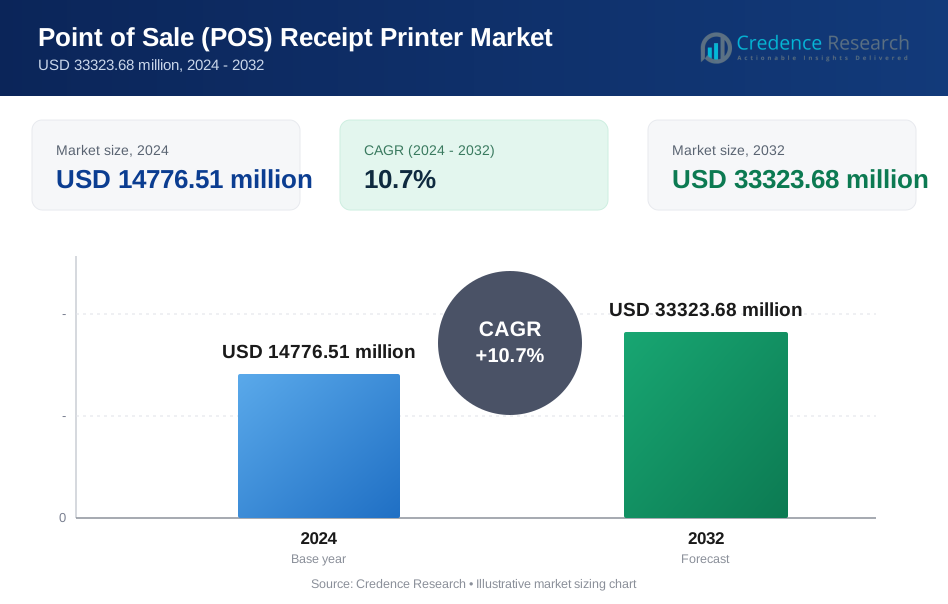
Point of Sale (POS) Software Market size was valued at USD 14776.51 million in 2024 and is anticipated to reach USD 33323.68 million by 2032, at a CAGR of 10.7% during the forecast period.
| REPORT ATTRIBUTE | DETAILS |
|---|---|
| Historical Period | 2020-2023 |
| Base Year | 2024 |
| Forecast Period | 2025-2032 |
| Point of Sale (POS) Software Market Size 2024 | USD 14776.51 Million |
| Point of Sale (POS) Software Market, CAGR | 10.7% |
| Point of Sale (POS) Software Market Size 2032 | USD 33323.68 Million |
The Point of Sale (POS) Software Market is driven by major players including NCR Corporation, Panasonic Corporation, Square, Inc., VeriFone Systems, Inc., NEC Corporation, Diebold Nixdorf, Ingenico Group, Samsung Electronic Co. Ltd, PAX Technology, and Epicor Software Corporation. These vendors expand their reach through cloud platforms, mobile POS tools, and secure payment technologies that support faster, more integrated retail and hospitality workflows. North America led the market in 2024 with about 38% share, supported by strong digital payment adoption and rapid system upgrades. Asia Pacific followed with nearly 29% share due to fast-growing retail activity and rising cloud POS penetration.
Market Insights
- The Point of Sale (POS) Software Market reached USD 14776.51 million in 2024 and is projected to hit USD 33323.68 million by 2032, growing at a CAGR of 10.7%.
- Rising demand for digital payments and cloud-based POS platforms drives market expansion, supported by strong adoption among large enterprises holding about 61% share.
- Mobile POS systems continue to gain traction as businesses enhance service speed and support contactless transactions, reflecting a clear trend toward flexible payment environments.
- Competitive activity remains strong as vendors introduce AI features, deeper analytics, and integrated payment solutions to strengthen market position despite concerns related to cybersecurity threats and integration complexity.
- North America led the market with nearly 38% share in 2024, followed by Asia Pacific at around 29%, while mobile POS dominated the application segment with about 54% share.
Market Segmentation Analysis:
By Organization Size
Large enterprises held the dominant share in 2024 with about 61% of the Point of Sale (POS) Software Market. Large enterprises adopted advanced POS platforms to manage high transaction loads, multi-store networks, and integrated inventory systems. Demand rose as retailers and restaurants upgraded legacy systems to improve billing accuracy and customer flow. Strong focus on omnichannel engagement and data-driven insights pushed major players to invest in scalable POS suites. Small and medium enterprises continued to grow as cloud-based tools became more affordable and easier to deploy.
- For instance, Walmart Inc. reported serving approximately 270 million customers and members each week across more than 10,750 stores in 19 countries.
By Deployment Mode
Cloud deployment led this segment in 2024 with nearly 67% share of the Point of Sale (POS) Software Market. Retailers and hospitality firms shifted to cloud systems to gain remote access, low upfront costs, and automatic updates. Cloud models supported real-time sales tracking and multi-device syncing, which improved operational speed. Rapid expansion of e-commerce and mobile payments increased reliance on flexible cloud platforms. On-premise solutions held a smaller share due to higher setup costs and limited scalability, though they remained useful for firms with strict data control needs.
- For instance, Lightspeed Commerce disclosed that its cloud-based platform served about 144,000 customer locations across more than 100 countries as of March 31 2025, underlining how cloud POS has become the core deployment model for many retailers and hospitality operators.
By Application
Mobile POS dominated the segment in 2024 with around 54% share of the Point of Sale (POS) Software Market. Adoption grew as businesses used handheld devices to reduce queue times and support checkout anywhere in the store. Restaurants, quick-service chains, and retail outlets favored mobile systems to improve staff mobility and serve customers faster. Strong growth in contactless payments and digital wallets helped mobile POS gain wider traction. Fixed POS systems still played a key role in handling high-volume counters, but mobility and flexibility drove stronger demand for handheld solutions.
Key Growth Drivers
Rising Demand for Digital Payments
Digital payments expanded across retail and hospitality, pushing businesses to adopt modern POS software. Merchants preferred systems that supported contactless cards, QR payments, and mobile wallets to speed up transactions. Growth in online-to-offline commerce also required unified billing tools that linked physical and digital channels. Strong consumer preference for fast and secure payments encouraged firms to upgrade outdated platforms. This shift created steady demand for scalable POS solutions with real-time processing.
- For instance, Apple Pay had an estimated 744 million users worldwide in 2024, illustrating how large-scale wallet adoption is pushing merchants to deploy POS software that can securely accept tokenized and contactless digital payments at the checkout.
Expansion of Omnichannel Retail
Retailers adopted omnichannel models that linked stores, websites, and mobile apps, which increased the need for integrated POS software. Companies wanted unified inventory, common customer data, and consistent pricing across channels. POS platforms with analytics, loyalty features, and centralized dashboards supported smoother operations. This expansion helped businesses offer flexible services like click-and-collect and real-time stock visibility. Rising competition in retail pushed brands to use advanced POS features for stronger customer engagement.
- For instance, Target expected its network of sortation centers (initially 9, growing to 10 by mid-2023) to process approximately 50 million packages in 2023, nearly double the volume processed in 2022.
Growing Adoption of Cloud-Based POS Systems
Cloud deployment grew as firms sought lower upfront investment, easy updates, and remote access. Cloud POS offered seamless scalability, allowing businesses to expand locations without major infrastructure costs. Real-time data access helped managers track sales, staff activity, and inventory from any device. The model also improved security through automated backups and regular patches. These features made cloud systems attractive for both SMEs and large enterprises seeking agility.
Key Trends & Opportunities
Rising Use of Mobile POS Solutions
Mobile POS gained traction as retailers and restaurants favored handheld systems that reduced queues and improved service flow. Compact devices enabled staff to process payments on the move, creating faster checkout points. Growth in contactless methods encouraged wider use across supermarkets, cafés, and outdoor events. Mobile POS also supported integration with loyalty apps and digital receipts. This shift created strong opportunities for vendors offering lightweight and flexible platforms.
- For instance, Toast stated that its restaurant-focused cloud POS platform was deployed in approximately 106,000restaurant locations as of December 31, 2023, a 34% increase from the previous year, reflecting rapid uptake of mobile and tablet-based checkout in foodservice environments.
Integration of AI and Analytics
Businesses adopted AI-driven POS tools to gain deeper insights into customer behavior and purchasing trends. These analytics helped retailers refine pricing, personalize offers, and optimize stock levels. Predictive features improved demand forecasting and reduced waste. AI-enabled fraud detection strengthened transaction security and enhanced monitoring capabilities. Vendors offering intelligent dashboards and automation found strong market opportunities as firms sought smarter decision-making tools.
- For instance, Starbucks reported 34.6 million 90-day active Starbucks Rewards members in the United States in Q1 2025, giving the company a very large transactional dataset that feeds AI-driven personalization and offer analytics within its POS and mobile ecosystem.
Growth in Self-Checkout and Automation
Self-checkout systems expanded in supermarkets and large retail chains, boosting demand for POS software that supports automated billing and product recognition. Automation helped reduce labor pressure and improved customer throughput during peak hours. Retailers also embraced hybrid models where staff assisted only when needed. This trend opened new opportunities for software providers specializing in touchless and rapid-scanning solutions. Integration with loyalty programs and mobile apps strengthened this shift toward automation.
Key Challenges
Rising Cybersecurity Risks
POS systems faced growing threats from payment fraud, data breaches, and malware attacks. Retailers handled sensitive customer details, which required strong encryption and continuous monitoring. Smaller firms struggled to maintain advanced security due to limited budgets. Compliance with evolving data protection rules added operational pressure. Vendors needed to enhance threat detection and secure cloud environments to maintain user confidence.
High Integration and Maintenance Complexity
Many businesses found it challenging to integrate POS software with legacy tools, inventory platforms, and e-commerce systems. Complex deployments increased setup time and required skilled support teams. Regular updates, hardware compatibility, and data synchronization added to maintenance burdens. SMEs often faced higher costs when customizing systems for unique workflows. These issues slowed adoption and made firms cautious about switching to new platforms.
Regional Analysis
North America
North America held the largest share of the Point of Sale (POS) Software Market in 2024 with about 38%. Strong adoption came from retail chains, restaurants, and hospitality operators upgrading to cloud POS platforms. Businesses in the United States and Canada embraced digital payments, mobile POS, and omnichannel tools to manage rising transaction volumes. High investment in analytics and automation supported wider platform upgrades. The presence of major POS vendors and strong technology infrastructure helped the region maintain its lead. Ongoing focus on contactless payments and faster checkout systems continued to drive substantial market expansion.
Europe
Europe accounted for nearly 27% of the Point of Sale (POS) Software Market in 2024, supported by strong digital payment penetration and rapid modernization across retail and food service. Countries such as Germany, the United Kingdom, and France adopted mobile POS systems to improve in-store efficiency and customer engagement. Growth in self-checkout terminals and cloud deployment strengthened the region’s position. Regulatory focus on secure transactions encouraged businesses to upgrade outdated systems. Expanding e-commerce also pushed retailers to integrate POS with unified inventory and customer-data platforms to support smooth cross-channel operations.
Asia Pacific
Asia Pacific captured about 29% of the Point of Sale (POS) Software Market in 2024, driven by rapid expansion of digital payments and strong retail growth across China, India, Japan, and Southeast Asia. Small and medium enterprises accelerated cloud POS adoption to improve billing accuracy and inventory control. Mobile POS gained traction in high-traffic retail environments and quick-service restaurants. Government support for cashless ecosystems encouraged faster platform upgrades. Growing penetration of e-commerce created strong demand for integrated POS systems that connected online and offline channels, strengthening the region’s long-term growth outlook.
Latin America
Latin America held around 4% share of the Point of Sale (POS) Software Market in 2024. Retailers in Brazil, Mexico, and Argentina adopted cloud-based POS platforms to reduce upfront costs and improve operational flexibility. Mobile POS use increased in small shops and quick-service outlets due to rising digital payment acceptance. Economic recovery and growing fintech activity supported wider adoption of modern POS solutions. Despite challenges related to infrastructure and cost, demand grew steadily as businesses sought faster checkout, better inventory management, and secure payment processing to enhance customer satisfaction.
Middle East and Africa
The Middle East and Africa accounted for nearly 2% of the Point of Sale (POS) Software Market in 2024. Growth came from rising adoption of digital payment systems in the Gulf region and expanding retail investments in countries like the UAE, Saudi Arabia, and South Africa. Businesses implemented cloud and mobile POS tools to enhance service speed and reduce operational complexity. Hospitality and tourism sectors adopted advanced platforms to streamline guest transactions. While market penetration remained low, increasing smartphone use and fintech expansion supported gradual uptake of modern POS software across emerging markets.
Market Segmentations:
By Organization Size
- Large Enterprise
- Small & Medium Enterprise (SME)
By Deployment Mode
- Cloud
- On-premise
By Application
- Fixed POS
- Mobile POS
By End User
- Restaurants
- Hospitality
- Healthcare
- Retail
- Warehouse
- Entertainment
- Other
By Geography
- North America
- U.S.
- Canada
- Mexico
- Europe
- Germany
- France
- U.K.
- Italy
- Spain
- Rest of Europe
- Asia Pacific
- China
- Japan
- India
- South Korea
- South-east Asia
- Rest of Asia Pacific
- Latin America
- Brazil
- Argentina
- Rest of Latin America
- Middle East & Africa
- GCC Countries
- South Africa
- Rest of the Middle East and Africa
Competitive Landscape
The competitive landscape of the Point of Sale (POS) Software Market is shaped by key players such as NCR Corporation, Panasonic Corporation, Square, Inc., VeriFone Systems, Inc., NEC Corporation, Diebold Nixdorf, Ingenico Group, Samsung Electronic Co. Ltd, PAX Technology, and Epicor Software Corporation. Vendors focused on delivering scalable cloud platforms, mobile POS solutions, and advanced integration tools to support seamless retail and hospitality operations. Companies enhanced analytics, payment security, and multichannel compatibility to meet rising digital payment demand. Product upgrades centered on faster transaction processing, flexible deployment, and stronger data-driven insights. Competition intensified as firms expanded global reach, strengthened partnerships with payment providers, and developed industry-specific software modules. Continuous innovation across AI-enabled features, contactless payment support, and automation positioned leading vendors to capture emerging opportunities while addressing evolving customer expectations.
Key Player Analysis
- NCR Corporation
- Panasonic Corporation
- Square, Inc.
- VeriFone Systems, Inc.
- NEC Corporation
- Diebold Nixdorf
- Ingenico Group
- Samsung Electronic Co. Ltd
- PAX Technology
- Epicor Software Corporation
Recent Developments
- In 2025, Diebold Nixdorf partnered with LOC Software for self-checkout. LOC’s ThriVersA POS now runs natively on Diebold Nixdorf kiosks and self-checkout systems
- In 2025, Ingenico launched the AXIUM CX9000 all-in-one Android POS. The system combines checkout, integrated payments, and inventory management in a single software-driven terminal.
- In 2024, Panasonic Connect North America unveiled Stingray JS9900 kiosks and JS988 POS terminals at MURTEC.
Report Coverage
The research report offers an in-depth analysis based on Organization Size, Deployment Mode, Application, End-User and Geography. It details leading market players, providing an overview of their business, product offerings, investments, revenue streams, and key applications. Additionally, the report includes insights into the competitive environment, SWOT analysis, current market trends, as well as the primary drivers and constraints. Furthermore, it discusses various factors that have driven market expansion in recent years. The report also explores market dynamics, regulatory scenarios, and technological advancements that are shaping the industry. It assesses the impact of external factors and global economic changes on market growth. Lastly, it provides strategic recommendations for new entrants and established companies to navigate the complexities of the market.
Future Outlook
- The market will shift further toward cloud-based POS platforms with faster deployment.
- Mobile POS adoption will rise as retailers and restaurants seek greater service flexibility.
- AI-driven analytics will strengthen decision-making for pricing, inventory, and customer behavior.
- Integration with omnichannel systems will become essential for smooth cross-platform operations.
- Contactless and digital wallet payments will continue to drive upgrades in POS software.
- Automation and self-checkout solutions will expand across supermarkets and large retail formats.
- Cybersecurity features will advance as businesses demand stronger data protection.
- POS systems will integrate deeper with loyalty, CRM, and marketing tools.
- SMEs will adopt POS platforms faster due to affordable subscription-based models.
- Industry consolidation will grow as major vendors acquire smaller software innovators.
Request a Free Sample
Fill in your details and we'll send you a free sample report.
- Sample data tables & charts
- Research methodology
Need a Custom Version of This Report?
Tailor the scope, geography, or segments to your exact requirements.
- Custom geography or segment scope
- Direct access to our analyst team
Frequently Asked Questions
What is the current market size for Point of Sale (POS) Software Market, and what is its projected size in 2032?
At what Compound Annual Growth Rate is the Point of Sale (POS) Software Market projected to grow between 2024 and 2032?
Which Point of Sale (POS) Software Market segment held the largest share in 2024?
What are the primary factors fueling the growth of the Point of Sale (POS) Software Market?
Who are the leading companies in the Point of Sale (POS) Software Market?
Which region commanded the largest share of the Point of Sale (POS) Software Market in 2024?
Table of Content
Chapter 1. Report Introduction
- 1.1 Report Description & Purpose
- 1.1.1 Report Title & Market Definition
- 1.1.2 Unique Selling Propositions (USP) & Key Differentiators
- 1.1.3 Value Proposition for Stakeholders
- 1.2 Research Objectives
- 1.2.1 Market Sizing Objectives (Volume & Revenue)
- 1.2.2 Segmentation Objectives
- 1.2.3 Competitive Intelligence Objectives
- 1.2.4 Forecast & Scenario Objectives
- 1.3 Report Scope
- 1.3.1 Point of Sale (POS) Receipt Printer Scope – Types & Subtypes Covered
- 1.3.2 Geographic Scope – Regions & Countries Covered
- 1.3.3 Historical Period, Base Year & Forecast Period (2024; forecast to 2032)
- 1.3.4 Inclusions & Exclusions
- 1.4 HS Code & Classification Framework
- 1.5 Currency, Units & Pricing Basis
- 1.6 Target Stakeholders
- 1.7 Limitations & Assumptions
Chapter 2. Executive Summary
- 2.1 Global Point of Sale (POS) Receipt Printer Market Snapshot
- 2.1.1 Market Size – Historical (2024) & Forecast (2024-2032) (2024: USD 14776.51 million → 2032: USD 33323.68 million)
- 2.1.2 Volume & Revenue – Global Totals
- 2.1.3 Key Market Highlights – Top Five Facts
- 2.2 Point of Sale (POS) Receipt Printer Market Segmentation Snapshot
- 2.2.1 Market Split by Region – 2024 vs. 2032
- 2.3 Competitive Snapshot
- 2.3.1 Top 10 Players by Revenue Share – 2024
- 2.3.2 Top 10 Players by Volume Share – 2024
- 2.3.3 Recent Strategic Developments (18-Month Summary)
- 2.4 Key Investment Highlights & Strategic Conclusions
Chapter 3. Point of Sale (POS) Receipt Printer Market Dynamics & Industry Analysis
- 3.1 Market Overview & Context
- 3.1.1 Point of Sale (POS) Receipt Printer Market Position in the Broader Automotive Value Chain
- 3.1.2 OEM vs. Replacement Market Dynamics
- 3.1.3 Market Maturity & Development Stage by Region
- 3.2 Point of Sale (POS) Receipt Printer Market Drivers
- 3.3 Point of Sale (POS) Receipt Printer Market Restraints & Challenges
- 3.4 Point of Sale (POS) Receipt Printer Market Opportunities
- 3.5 Porter's Five Forces Analysis
- 3.5.1 Threat of New Entrants
- 3.5.2 Bargaining Power of Suppliers
- 3.5.3 Bargaining Power of Buyers
- 3.5.4 Threat of Substitutes
- 3.5.5 Competitive Rivalry – Intensity Assessment
- 3.6 Point of Sale (POS) Receipt Printer Value Chain Analysis
- 3.6.1 Upstream – Raw Material/Input Suppliers
- 3.6.1.1 Raw Material/Input 1
- 3.6.1.2 Raw Material/Input 2
- 3.6.1.3 Raw Material/Input 3
- 3.6.2 Midstream – Production/Manufacturing/Service Delivery
- 3.6.2.1 Production/Process Overview
- 3.6.2.2 Key Facility Locations & Capacity by Manufacturer
- 3.6.3 Downstream – Distribution & End Consumer
- 3.6.3.1 Primary Channel – B2B/OEM
- 3.6.3.2 Secondary Channels – Dealer, Retail, Online, Direct
- 3.6.4 Value Chain Profitability Analysis
- 3.6.1 Upstream – Raw Material/Input Suppliers
- 3.7 PESTEL Analysis
- 3.7.1 Political Factors
- 3.7.2 Economic Factors
- 3.7.3 Social Factors
- 3.7.4 Technological Factors
- 3.7.5 Environmental Factors
- 3.7.6 Legal Factors
- 3.8 Point of Sale (POS) Receipt Printer Supply Chain Analysis
- 3.8.1 Raw Material/Input Supply Risk Assessment
- 3.8.2 Manufacturing Concentration Risk (Geographic Exposure)
- 3.8.3 Trade Disruption Impact Analysis
- 3.9 Regulatory & Policy Landscape
Note: The regulatory and policy landscape section covers regulations based on their applicability to the market, Point of Sale (POS) Receipt Printer category, geography, and scope of the study. Only regulatory frameworks with a material impact on operations, compliance, trade, sustainability, or market access are analyzed in detail.
Chapter 4. Key Investment Pockets & Opportunity Analysis
- 4.1 Point of Sale (POS) Receipt Printer Market Attractiveness Analysis
- 4.1.1 By Region – Investment Attractiveness Matrix (Volume × CAGR)
- 4.2 Absolute Revenue Growth Opportunity
- 4.2.1 By Region – Absolute USD Growth Through 2032
- 4.3 Incremental Volume Opportunity
- 4.3.1 By Region – Incremental Volume Through 2032
- 4.3.2 Segment – Incremental Volume
- 4.4 Emerging Submarket Opportunity Deep Dive (Subject to Applicability)
- 4.5 Emerging Market Opportunity Scorecards
- 4.5.1 United States
- 4.5.2 Europe
- 4.5.3 Asia
- 4.5.4 Middle East & Africa
Note: Emerging Market Opportunity Scorecards will be included based on relevance and strategic importance. Regions listed are indicative and may vary depending on data availability and market dynamics.
Chapter 5. Point of Sale (POS) Receipt Printer Import-Export Analysis & Trade Flows
- 5.1 Global Trade Overview
- 5.1.1 Global Export Value by Country (2024)
- 5.1.2 Global Export Volume by Country (2024)
- 5.1.3 Global Import Value by Country (2024)
- 5.1.4 Global Import Volume by Country (2024)
- 5.1.5 Net Trade Balance by Country (2024)
- 5.2 Export Analysis – Segment
- 5.2.1 Type 1 (HS Code)
- 5.2.2 Type 2 (HS Code)
- 5.2.3 Type 3 (HS Code)
- 5.2.4 Type 4 (HS Code)
- 5.2.5 Type 5 (HS Code)
- 5.3 Import Analysis – Segment
- 5.3.1 Type 1 (HS Code)
- 5.3.2 Type 2 (HS Code)
- 5.3.3 Type 3 (HS Code)
- 5.3.4 Type 4 (HS Code)
- 5.3.5 Type 5 (HS Code)
- 5.4 Average Unit Trade Prices
- 5.4.1 Average Export Price – Segment & Country
- 5.4.2 Average Import Price – Segment & Source Country
- 5.4.3 Price Trends (2024)
- 5.5 Key Trade Route Analysis
- 5.5.1 Trade Route 1
- 5.5.2 Trade Route 2
- 5.5.3 Trade Route 3
- 5.5.4 Trade Route 4
- 5.5.5 Trade Route 5
- 5.6 Trade Policy Impact Assessment
- 5.6.1 US Anti-Dumping & Section 301 Tariffs
- 5.6.2 EU Customs Union Impact
- 5.6.3 Major Free Trade Agreements
- 5.6.4 USMCA Rules of Origin
Note: Trade policy analysis will be included only where relevant to the Point of Sale (POS) Receipt Printer market.
Chapter 6. Competitive Landscape & Company Benchmarking
- 6.1 Point of Sale (POS) Receipt Printer Market Concentration & Structure
- 6.1.1 Herfindahl-Hirschman Index (HHI) – vs. 2024
- 6.1.2 Tier 1, Tier 2 & Tier 3 Market Structure
- 6.1.3 Global, Regional & Local Player Dynamics
- 6.2 Point of Sale (POS) Receipt Printer Market Share Analysis – 2024
- 6.2.1 Global Revenue Share by Company
- 6.2.2 Global Volume Share by Company
- 6.2.3 Regional Revenue Share
- 6.2.4 Market Share Evolution ( vs. 2024)
- 6.2.5 OEM Segment Share by Company
- 6.2.6 Replacement Segment Share by Company
- 6.3 Production/Delivery Capacity & Facility Analysis
- 6.3.1 Global Installed Capacity
- 6.3.2 Capacity Utilization Rates
- 6.3.3 Production/Output Volume
- 6.3.4 Facility Locations & Capacity Map
- 6.3.5 Planned Capacity Additions
- 6.4 Point of Sale (POS) Receipt Printer Competitive Benchmarking Matrix
- 6.4.1 Revenue, Volume, CAGR & Profitability Comparison
- 6.4.2 Channel Revenue Mix
- 6.4.3 Geographic Revenue Exposure
- 6.4.4 R&D Intensity
- 6.4.5 Sustainability Maturity
- 6.5 Strategic Developments in Point of Sale (POS) Receipt Printer (Last 24 Months)
- 6.5.1 Mergers, Acquisitions & Divestments
- 6.5.2 New Point of Sale (POS) Receipt Printer Launches
- 6.5.3 Facility Expansions
- 6.5.4 Strategic Alliances, Joint Ventures & Partnerships
- 6.5.5 Distribution Expansion & Market Entry
- 6.5.6 Sustainability & ESG Initiatives
- 6.6 Competitive Strategy Mapping
- 6.6.1 Leader, Challenger, Follower & Niche Classification
- 6.6.2 Pricing Strategy Comparison
- 6.6.3 Channel Strategy Matrix
Note: Strategic developments are included based on their materiality and the availability of reliable information.
Chapter 7. Global Point of Sale (POS) Receipt Printer Market – By Distribution Channel
- 7.1 Segment Overview
- 7.1.1 Volume & Revenue Split by Channel (2024 & 2032)
- 7.1.2 Channel Mix Evolution (2024-2032)
Chapter 8. Regional Market Analysis – Global Overview
- 8.1 Global Regional Overview
- 8.1.1 Regional Volume Share
- 8.1.2 Regional Revenue Share
- 8.1.3 Regional Volume by Region
- 8.1.4 Regional Revenue by Region
- 8.1.5 Regional Forecast Through 2032
- 8.2 Cross-Regional Segment Analysis
- 8.2.1 By Distribution Channel
- 8.2.2 By Brand/Price Tier
Chapter 9. North America Point of Sale (POS) Receipt Printer Market
- 9.1 United States
- 9.2 Canada
- 9.3 Mexico
Chapter 10. Europe Point of Sale (POS) Receipt Printer Market
- 10.1 Germany
- 10.2 France
- 10.3 Italy
- 10.4 United Kingdom
- 10.5 Spain
- 10.6 Poland
- 10.7 Russia
- 10.8 Netherlands
- 10.9 Belgium
- 10.10 Sweden
- 10.11 Denmark
- 10.12 Norway
- 10.13 Rest of Europe
Chapter 11. Asia Pacific Point of Sale (POS) Receipt Printer Market
- 11.1 China
- 11.2 India
- 11.3 Japan
- 11.4 South Korea
- 11.5 Thailand
- 11.6 Indonesia
- 11.7 Vietnam
- 11.8 Malaysia
- 11.9 Australia
- 11.10 Rest of Asia Pacific
Chapter 12. Latin America Point of Sale (POS) Receipt Printer Market
- 12.1 Brazil
- 12.2 Argentina
- 12.3 Colombia
- 12.4 Chile
- 12.5 Rest of Latin America
Chapter 13. Middle East Point of Sale (POS) Receipt Printer Market
- 13.1 Saudi Arabia
- 13.2 United Arab Emirates
- 13.3 Turkey
- 13.4 Israel
- 13.5 Iran
- 13.6 Rest of the Middle East
Chapter 14. Africa Point of Sale (POS) Receipt Printer Market
- 14.1 South Africa
- 14.2 Egypt
- 14.3 Nigeria
- 14.4 Morocco
- 14.5 Rest of Africa
Chapter 15. Point of Sale (POS) Receipt Printer Company Profiles
- 15.1 [Company 01]
- 15.1.1 Company Overview
- 15.1.2 Key Management Personnel
- 15.1.3 Products & Services Portfolio
- 15.1.4 Financial Performance
- 15.1.5 Key Market Focus & Geographic Presence
- 15.1.6 Recent Developments & Strategic Initiatives
Note: The company profile list is preliminary and may change based on research findings, market developments, data availability, and client requirements.
Chapter 16. Appendices
- Appendix A – List of Abbreviations & Acronyms
- Appendix B – Industry Classification Code Reference – Full Series
- Appendix C – Production & Capacity Data Tables
- Appendix D – End-Use & Demand Base Tables
- Appendix E – Consumption & Replacement Rate Assumptions
- Appendix F – ASP Reference Tables
- Appendix G – Manufacturing & Facility Database
- Appendix H – Import-Export Data Tables
- Appendix I – Regulatory Summary Tables
- Appendix J – Primary Research Participant List (Anonymized)
- Appendix K – Primary Research Questionnaire Framework
- Appendix L – Data Sources & Bibliography
- Appendix M – Market Size Divergence & Source Comparison
Chapter 17. Research Methodology
- 17.1 Research Framework & Philosophy
- 17.2 Secondary Research – Sources, Hierarchy & Data Extraction
- 17.3 Data Modeling – Bottom-Up & Top-Down Market Sizing
- 17.4 Primary Research – Stakeholder Framework, LOI & Sample Sizes
- 17.5 Forecast Methodology – Regression, Scenario & Sensitivity Analysis
- 17.6 Quality Control – Four-Layer Validation Framework
- 17.7 Limitations & Standard Assumptions
- 17.8 Disclaimer
