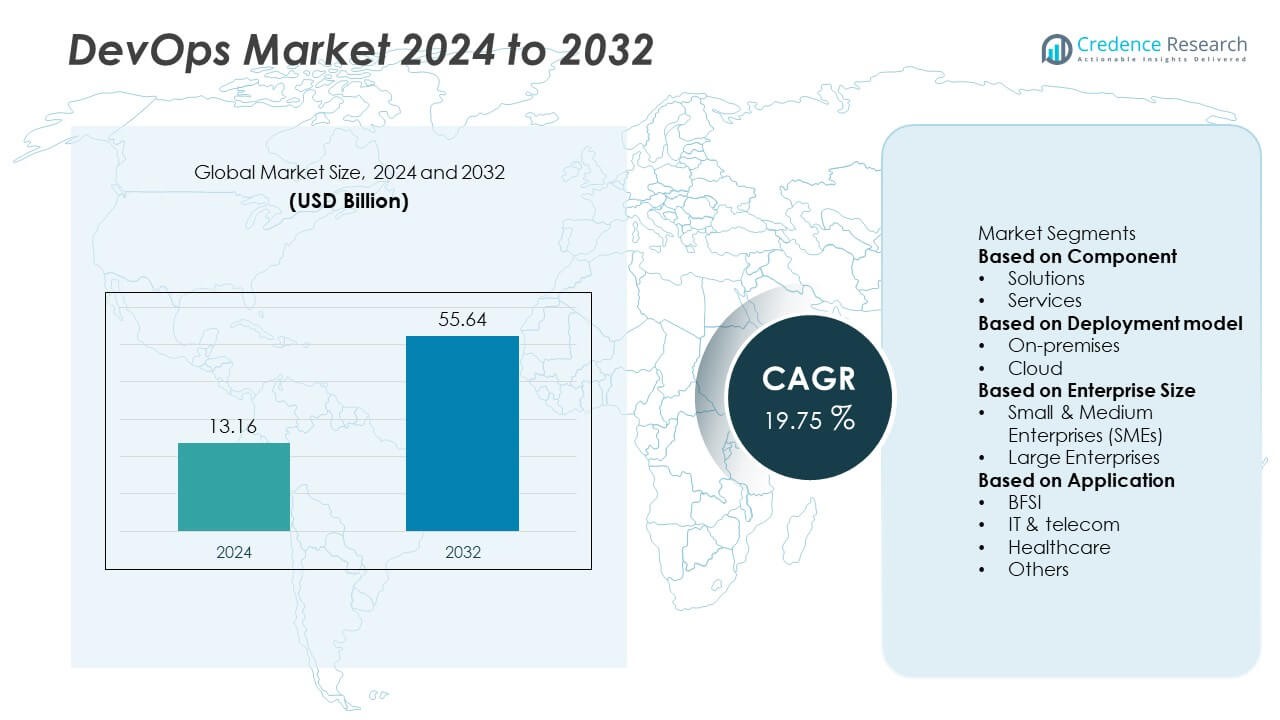
Global DevOps Market By Components (Solutions and Services), By Cloud Type (Public Cloud, Private Cloud, and Hybrid Cloud) Growth, Future Prospects & Competitive Analysis, 2016 – 2030

Price: $4999

Published: | Report ID: 17193 | Report Format : PDF

Key Highlights of the Report

How are the major segments performing in the DevOps market?

  • In 2022, the solution segment accounted for the largest share of the market due to the need to deliver continuous and rapid applications.
  • In 2022, the public cloud segment was anticipated to hold a prominent share of the global DevOps market as it is widely used by the general public.
  • In 2022, the SME segment accounted for the largest share of the market. As the segment grows, it is expected to be driven by lower costs, agility, and fast time to market.
  • In 2022, the IT & telecom segment was anticipated to hold a prominent share of the global DevOps market as it is widely used for rapid delivery services.

What is the Market Size of DevOps regarding value?

The global DevOps market is anticipated to grow at a substantial CAGR of 19.9% in the upcoming years. The global DevOps industry was estimated to be worth USD 9,846.5 million in 2022 and was expected to be worth USD 35,076.5 million by 2028.

Design Element 2

Access crucial information at unmatched prices!

Request your free sample report today & start making informed decisions powered by Credence Research!

Download Free Sample
CTA Design Element 3

Which region dominated the DevOps market?

In 2022, the North American region was anticipated to hold a prominent share of the global DevOps market. Due to the growing number of service providers and favorable government policies, the North America DevOps market is growing. Furthermore, many industries, including IT and telecommunications, retail, finance and investment, accept development to operations solutions at a high rate.

How is US Market Performing in the DevOps market?

In terms of DevOps adoption, the United States is the most advanced market due to various factors, including legislative requirements, advanced IT infrastructure, multiple companies, and availability of technical expertise. Several government organizations have begun using DevOps because of its benefits, including the US Citizenship and Immigration Service and the California Department of Health Care Services. Several small and large DevOps providers, including Microsoft, Broadcom, Oracle, IBM, and Google, are contributing to the growth of the DevOps industry in the United States.

How is the economy impacting global DevOps growth?

In the past few years, DevOps has grown rapidly; the market experienced a sudden increase in demand during the COVID-19 outbreak. During this period, there was a sudden demand for software and web-based applications as businesses sought to capitalize on their customers’ increased online presence by using software and web-based applications. In addition, government and local authorities took strict measures to limit the spread of COVID-19 cases, including social distancing and self-isolation policies and closing physical businesses and shops.

DevOps Market

What is the competitive environment of the DevOps market?

The DevOps industry’s competitive environment provides information on the entire economic profit made by suppliers and businesses, the sales and revenues created in this sector, the DevOps market share globally, the business organization summary, the introduction of new products, and the opportunities for the industrial DevOps market. For instance, in May 2020, a new release of IBM’s AIOps system, which analyzes structured and unstructured data from log files and warns development teams about unwanted situations through predictive analytics, was released. Moreover, in February 2023, Technology Magic, a leading full-cycle development firm, launched DevOps as a Service, a managed service delivering global cloud infrastructure management to customers. Clients’ cloud environments will be managed, maintained, and optimized by TechMagic’s team of AWS-certified experts, so they can focus on providing value to their customers. Enterprises can develop innovative software products and scale their operations by doing so.

Executive Summary

What are the key trends in the DevOps market?

Businesses that aim to address rapidly changing market requirements should utilize DevOps technologies as a platform for being capable, lean and agile. As a result of these technologies, IT operations, design, and business can collaborate more effectively by reducing obstacles between IT operations, design, and business. The market is projected to grow over the forecast time frame due to enterprises’ increasing use of DevOps platforms for automated software processes. The market is also predicted to grow due to a growing demand for fast and constant application delivery systems. DevOps technology can examine and monitor bottlenecks throughout an application, identify problems, optimize them, provide rapid updates, and speed up delivery due to its ability to examine and monitor bottlenecks throughout an application.

How are Manufacturers Teaming Up with Stakeholders in DevOps Market?

In the last few years, a few globally established vendors have held the majority of DevOps contracts, such as Broadcom Inc. (US), Microsoft Corporation (US), IBM (US), Atlassian Corporation Plc (Australia), and Google LLC (US). Vendors like these can bring global processes and execution capabilities, while local players can only provide local knowledge. A growing number of buyers in the DevOps market are willing to experiment/test new things due to increased disposable incomes, easy access to knowledge, and fast adoption of technological products. For instance, in September 2022, Atlassian released new smart connections, unified administrative controls, and improved work-management and collaboration products, including Trello, Confluence, Atlas, and Jira Work Management.

Which are the key investments by the DevOps market players?

Leading players operating in the DevOps market are focusing on expansion in production capacities for DevOps. Apart from this, players are concentrating on strategic mergers and acquisitions, collaborations and creating awareness among vendors via different associations formed to promote smart practices to serve more end users in the domestic market to gain a competitive edge. For instance, in February 2020, By investing 236 million USD, Amazon Web Services built a data center in Sao Paulo, Brazil, which helped public and private enterprises adopt cloud-powered DevOps services.

Some major players in the DevOps market are Amazon Web Services, inc., Broadcom, Dell Technologies, Inc., Google LLC, Hewlett Packard Enterprise Development LP, IBM Corporation, Micro focus, Microsoft Corporation, Oracle Corporation, and Rackspace Technology.

What are the Major Driving Factors for the DevOps Market?

A growing need for efficient and well-maintained operational processes, adopting cloud computing and PaaS, and reducing downtime in software development life cycles contribute to the DevOps Market’s growth. The software development operation process is being reduced in time and maintenance by organizations all over the world. By reducing the maintenance of the continuous development process, DevOps improves collaboration and synchronization among developers. Consequently, the demand for optimizing operational processes is fueling the growth of the DevOps Market. Also, automated devices operate more accurately and efficiently than manual ones, minimizing the risk of operation failure and driving the DevOps Market’s growth.

What are the Major Risks for the DevOps Market?

The enterprise-wide adoption of DevOps remains challenging for many organizations, especially when there is a lack of consistency in the technologies used, non-repeatable procedures, ad hoc practices, and cultural obstacles. Identifying the following problems and potential solutions to DevOps standardization is necessary to achieve the DevOps transformation process. According to a survey conducted among several customer teams, standardization tools and eliminating process gaps are difficult due to a lack of end-to-end orchestration, human intervention, legacy practices, inconsistent environments, long provisioning times, and several other factors. DevOps must be standardized to be repeatable, predictable, and consistent across the organization.

Which is the key vertical in the DevOps market?

The IT & telecom segment is expected to hold a prominent share of the global DevOps market during the forecast period. The IT and telecom industries face several challenges, including quality assurance, release schedules, and application downtime. The increasing demand for quick delivery services results from introducing DevOps tools and solutions that boost business productivity and adapt to changing business needs. As a result of DevOps, telecoms and ITES sectors can increase their networks’ availability, scalability, and resilience and shorten time-to-market for new software solutions and apps.

How is the DevOps market performing in regions?

Asia Pacific market is anticipated to witness the fastest growth in the global DevOps market during the forecast period. This region is predicted to experience the fastest growth due to its high concentration of startups and rapid digital changes. China and Japan are major players in this sector in the region. Regional SMEs increasingly deploy DevOps tools to streamline and agile their business operations. Developing nations of APAC are also expected to expand their markets as they expand their infrastructure and adopt smart devices, smartphones, and digital services.

What is the regulatory landscape for the DevOps market?

A significant challenge that requires new solutions is keeping up with security and data privacy regulations and standards. As regulations are almost always created only after real-world disasters, regulatory requirements do not cover emerging risks. Essentially, a company can comply with a “rigorous” security standard and fail to catch issues that can hurt their business (and customers).

Shape Your Report to Specific Countries or Regions & Enjoy 30% Off!

What are the major players planning for the future of the DevOps market?

Growing regional existence and investment in downstream applications are anticipated to deliver a competitive edge in the market. For instance, In February 2023, BigPanda, Inc., the pioneer in incident intelligence and automation powered by AIOps, announced new data engineering capabilities that help enterprises begin their AIOps journeys by maximizing the potential of monitoring and observability tools. Incorporating BigPanda’s Data Engineering skills allows us to turn event data output into high-quality, actionable warnings, facilitating the ingesting of dissimilar data sources in a novel and easier manner.

REPORT ATTRIBUTE DETAILS
DevOps Market by Value Yes
DevOps Market, Tornado Analysis Yes
DevOps Market, STAR Analysis Yes
DevOps Market, SRC Analysis Yes
DevOps Market Pricing Analysis Yes (On Demand)
DevOps Market Segment Analysis By Components (Solutions and Services)

By Cloud Type (Public Cloud, Private Cloud, and Hybrid Cloud)

By Enterprise Size (Large Enterprises and SMEs)

By Industry Vertical (IT & Telecom, BFSI, Retail, Government And Public Sector, Manufacturing, Healthcare, and Others)

DevOps Market, Regional Analysis North America (US and Canada)

Europe (Germany, UK, France, Italy, Spain, and the Rest of Europe)

Asia Pacific (China, India, Japan, South Korea, South East Asia, and the Rest of Asia Pacific)

Latin America (Brazil, Mexico, and the Rest of Latin America)

Middle East and Africa (GCC Countries, South Africa, and the Rest of Middle East and Africa)

DevOps Market Key Companies Amazon Web Services, inc., Broadcom, Dell Technologies, Inc., Google LLC, Hewlett Packard Enterprise Development LP, IBM Corporation, Micro focus, Microsoft Corporation, Oracle Corporation, Rackspace Technology
DevOps Market Competitive Landscape Market Share Analysis

Competitive Benchmarking

Key Players Market Positioning

Geographical Presence Analysis

Major Strategies Adopted

Segmentation of Global DevOps Market-

Global DevOps Market – By Component

  • Solution
  • Service

Global DevOps Market – By Cloud Type

  • Public Cloud
  • Private Cloud
  • Hybrid Cloud

Global DevOps Market – By Enterprise Size

  • Large Enterprise
  • SMEs

Global DevOps Market – By Industry Vertical

  • IT & Telecom
  • BFSI
  • Retail
  • Government And Public Sector
  • Manufacturing
  • Healthcare
  • Others

Global DevOps Market – By Region

  • North America
    • U.S.
    • Canada
  • Europe
    • Germany
    • France
    • U.K.
    • Italy
    • Spain
    • Rest of Europe
  • Asia Pacific
    • China
    • Japan
    • India
    • South Korea
    • South-east Asia
    • Rest of Asia Pacific
  • Latin America
    • Brazil
    • Mexico
    • Rest of Latin America
  • Middle East & Africa
    • GCC Countries
    • South Africa
    • Rest of the Middle East and Africa

1. Preface
1.1. Report Description
1.1.1. Purpose of the Report
1.1.2. Target Audience
1.1.3. USP and Key Offerings
1.2. Research Scope
1.3. Research Methodology
1.3.1. Phase I – Secondary Research
1.3.2. Phase II – Primary Research
1.3.3. Phase III – Expert Panel Review
1.3.4. Approach Adopted
1.3.4.1. Top-Down Approach
1.3.4.2. Bottom-Up Approach
1.3.5. Assumptions
1.4. Market Introduction
1.5. Market Research Scope

2. Executive Summary
2.1. Market Snapshot: Global DevOps Market
2.2. Global DevOps Market, By Component
2.3. Global DevOps Market, By Cloud Type
2.4. Global DevOps Market, By Enterprise Size
2.5. Global DevOps Market, By Industry Vertical
2.6. Global DevOps Market, By Region

3. Market Dynamics & Factors Analysis
3.1. Introduction
3.1.1. Global DevOps Market Value, 2017-2030, (US$ Mn))
3.1.2. Y-o-Y Growth Trend Analysis
3.2. Market Dynamics
3.2.1. Market Drivers
3.2.2. Market Restraints
3.2.3. Market Opportunities
3.2.4. Major Industry Challenges
3.3. Growth and Development Patterns
3.4. Investment Feasibility Analysis
3.5. Market Opportunity Analysis
3.5.1. Component
3.5.2. Cloud Type
3.5.3. Geography

4. Premium Insights
4.1. STAR (Situation, Task, Action, Results) Analysis
4.2. Porter’s Five Forces Analysis
4.2.1. Threat of New Entrants
4.2.2. Bargaining Power of Buyers/Consumers
4.2.3. Bargaining Power of Suppliers
4.2.4. Threat of Substitute Components
4.2.5. Intensity of Competitive Rivalry
4.3. Key Market Trends
4.3.1. Demand Side Trends
4.3.2. Supply Side Trends
4.4. Value Chain Analysis
4.5. Component Analysis
4.6. Analysis and Recommendations
4.7. Marketing Strategy Analysis
4.7.1. Direct Marketing
4.7.2. Indirect Marketing
4.7.3. Marketing Channel Development Trend

5. Market Positioning of Key Players, 2022
5.1. Company market share of key players, 2022
5.2. Competitive Benchmarking
5.3. Market Positioning of Key Vendors
5.4. Geographical Presence Analysis
5.5. Major Strategies Adopted by Key Players
5.5.1. Key Strategies Analysis
5.5.2. Mergers and Acquisitions
5.5.3. Partnerships
5.5.4. Cloud Type Launch
5.5.5. Geographical Expansion
5.5.6. Others

6. Economic Impact Analysis
6.1. Recession Impact
6.1.1. North America
6.1.2. Europe
6.1.3. Asia Pacific
6.1.4. Latin America
6.1.5. Middle East and Africa
6.2. Ukraine-Russia War Impact
6.2.1. North America
6.2.2. Europe
6.2.3. Asia Pacific
6.2.4. Latin America
6.2.5. Middle East and Africa
6.3. COVID-19 Impact Analysis
6.3.1. North America
6.3.2. Europe
6.3.3. Asia Pacific
6.3.4. Latin America
6.3.5. Middle East and Africa

7. Global DevOps Market
7.1. Global DevOps Market, by Component, 2017-2030 (US$ Mn))
7.1.1. Overview
7.1.2. Global DevOps Market, By Component, 2022 vs 2030 (in%)
7.1.3. Global DevOps Market, By Solution, 2017-2030 (US$ Mn))
7.1.4. Global DevOps Market, By Service, 2017-2030 (US$ Mn))
7.2. Global DevOps Market, by Cloud Type, 2017-2030 (US$ Mn))
7.2.1. Overview
7.2.2. Global DevOps Market, By Cloud Type, 2022 vs 2030 (in%)
7.2.3. Global DevOps Market, By Public Cloud, 2017-2030 (US$ Mn))
7.2.4. Global DevOps Market, By Private Cloud, 2017-2030 (US$ Mn))
7.2.5. Global DevOps Market, By Hybrid Cloud, 2017-2030 (US$ Mn))
7.3. Global DevOps Market, by Enterprise Size, 2017-2030 (US$ Mn))
7.3.1. Overview
7.3.2. Global DevOps Market, By Enterprise Size, 2022 vs 2030 (in%)
7.3.3. Global DevOps Market, By Large Enterprise, 2017-2030 (US$ Mn))
7.3.4. Global DevOps Market, By SMEs, 2017-2030 (US$ Mn))
7.4. Global DevOps Market, by Industry Vertical, 2017-2030 (US$ Mn))
7.4.1. Overview
7.4.2. Global DevOps Market, By Industry Vertical, 2022 vs 2030 (in%)
7.4.3. Global DevOps Market, By IT & Telecom, 2017-2030 (US$ Mn))
7.4.4. Global DevOps Market, By BFSI, 2017-2030 (US$ Mn))
7.4.5. Global DevOps Market, By Retail, 2017-2030 (US$ Mn))
7.4.6. Global DevOps Market, By Government and Public Sector, 2017-2030 (US$ Mn))
7.4.7. Global DevOps Market, By Manufacturing, 2017-2030 (US$ Mn))
7.4.8. Global DevOps Market, By Healthcare, 2017-2030 (US$ Mn))
7.4.9. Global DevOps Market, By Others, 2017-2030 (US$ Mn))

8. North America DevOps Market Analysis
8.1. North America DevOps Market, by Component, 2017-2030(US$ Mn))
8.1.1. Overview
8.1.2. SRC Analysis
8.2. North America DevOps Market, by Cloud Type, 2017-2030(US$ Mn))
8.2.1. Overview
8.2.2. SRC Analysis
8.3. North America DevOps Market, by Enterprise Size, 2017-2030(US$ Mn))
8.3.1. Overview
8.3.2. SRC Analysis
8.4. North America DevOps Market, by Industry Vertical, 2017-2030(US$ Mn))
8.4.1. Overview
8.4.2. SRC Analysis
8.5. North America DevOps Market, by Country, 2017-2030 (US$ Mn))
8.5.1. U.S.
8.5.1.1. U.S. DevOps Market Estimates and Forecast, 2017-2030 (US$ Mn))
8.5.1.2. U.S. DevOps, By Component, 2017-2030 (US$ Mn))
8.5.1.3. U.S. DevOps, By Cloud Type, 2017-2030 (US$ Mn))
8.5.1.4. U.S. DevOps, By Enterprise Size, 2017-2030 (US$ Mn))
8.5.1.5. U.S. DevOps, By Industry Vertical, 2017-2030 (US$ Mn))
8.5.2. Canada
8.5.2.1. Canada DevOps Market Estimates and Forecast, 2017-2030 (US$ Mn))
8.5.2.2. Canada DevOps, By Component, 2017-2030 (US$ Mn))
8.5.2.3. Canada DevOps, By Cloud Type, 2017-2030 (US$ Mn))
8.5.2.4. Canada DevOps, By Enterprise Size, 2017-2030 (US$ Mn))
8.5.2.5. Canada DevOps, By Industry Vertical, 2017-2030 (US$ Mn))

9. Europe DevOps Market Analysis
9.1. Europe DevOps Market, by Component, 2017-2030(US$ Mn))
9.1.1. Overview
9.1.2. SRC Analysis
9.2. Europe DevOps Market, by Cloud Type, 2017-2030(US$ Mn))
9.2.1. Overview
9.2.2. SRC Analysis
9.3. Europe DevOps Market, by Enterprise Size, 2017-2030(US$ Mn))
9.3.1. Overview
9.3.2. SRC Analysis
9.4. Europe DevOps Market, by Industry Vertical, 2017-2030(US$ Mn))
9.4.1. Overview
9.4.2. SRC Analysis
9.5. Europe DevOps Market, by Country, 2017-2030 (US$ Mn))
9.5.1. Germany
9.5.1.1. Germany DevOps Market Estimates and Forecast, 2017-2030 (US$ Mn))
9.5.1.2. Germany DevOps, By Component, 2017-2030 (US$ Mn))
9.5.1.3. Germany DevOps, By Cloud Type, 2017-2030 (US$ Mn))
9.5.1.4. Germany DevOps, By Enterprise Size, 2017-2030 (US$ Mn))
9.5.1.5. Germany DevOps, By Industry Vertical, 2017-2030 (US$ Mn))
9.5.2. France
9.5.2.1. France DevOps Market Estimates and Forecast, 2017-2030 (US$ Mn))
9.5.2.2. France DevOps, By Component, 2017-2030 (US$ Mn))
9.5.2.3. France DevOps, By Cloud Type, 2017-2030 (US$ Mn))
9.5.2.4. France DevOps, By Enterprise Size, 2017-2030 (US$ Mn))
9.5.2.5. France DevOps, By Industry Vertical, 2017-2030 (US$ Mn))
9.5.3. UK
9.5.3.1. UK DevOps Market Estimates and Forecast, 2017-2030 (US$ Mn))
9.5.3.2. UK DevOps, By Component, 2017-2030 (US$ Mn))
9.5.3.3. UK DevOps, By Cloud Type, 2017-2030 (US$ Mn))
9.5.3.4. UK DevOps, By Enterprise Size, 2017-2030 (US$ Mn))
9.5.3.5. UK DevOps, By Industry Vertical, 2017-2030 (US$ Mn))
9.5.4. Italy
9.5.4.1. Italy DevOps Market Estimates and Forecast, 2017-2030 (US$ Mn))
9.5.4.2. Italy DevOps, By Component, 2017-2030 (US$ Mn))
9.5.4.3. Italy DevOps, By Cloud Type, 2017-2030 (US$ Mn))
9.5.4.4. Italy DevOps, By Enterprise Size, 2017-2030 (US$ Mn))
9.5.4.5. Italy DevOps, By Industry Vertical, 2017-2030 (US$ Mn))
9.5.5. Spain
9.5.5.1. Spain DevOps Market Estimates and Forecast, 2017-2030 (US$ Mn))
9.5.5.2. Spain DevOps, By Component, 2017-2030 (US$ Mn))
9.5.5.3. Spain DevOps, By Cloud Type, 2017-2030 (US$ Mn))
9.5.5.4. Spain DevOps, By Enterprise Size, 2017-2030 (US$ Mn))
9.5.5.5. Spain DevOps, By Industry Vertical, 2017-2030 (US$ Mn))
9.5.6. Rest of Europe
9.5.6.1. Rest of Europe DevOps Market Estimates and Forecast, 2017-2030 (US$ Mn))
9.5.6.2. Rest of Europe DevOps, By Component, 2017-2030 (US$ Mn))
9.5.6.3. Rest of Europe DevOps, By Cloud Type, 2017-2030 (US$ Mn))
9.5.6.4. Rest of Europe DevOps, By Enterprise Size, 2017-2030 (US$ Mn))
9.5.6.5. Rest of Europe DevOps, By Industry Vertical, 2017-2030 (US$ Mn))

10. Asia Pacific DevOps Market Analysis
10.1. Asia Pacific DevOps Market, by Component, 2017-2030(US$ Mn))
10.1.1. Overview
10.1.2. SRC Analysis
10.2. Asia Pacific DevOps Market, by Cloud Type, 2017-2030(US$ Mn))
10.2.1. Overview
10.2.2. SRC Analysis
10.3. Asia Pacific DevOps Market, by Enterprise Size, 2017-2030(US$ Mn))
10.3.1. Overview
10.3.2. SRC Analysis
10.4. Asia Pacific DevOps Market, by Industry Vertical, 2017-2030(US$ Mn))
10.4.1. Overview
10.4.2. SRC Analysis
10.5. Asia Pacific DevOps Market, by Country, 2017-2030 (US$ Mn))
10.5.1. China
10.5.1.1. China DevOps Market Estimates and Forecast, 2017-2030 (US$ Mn))
10.5.1.2. China DevOps, By Component, 2017-2030 (US$ Mn))
10.5.1.3. China DevOps, By Cloud Type, 2017-2030 (US$ Mn))
10.5.1.4. China DevOps, By Enterprise Size, 2017-2030 (US$ Mn))
10.5.1.5. China DevOps, By Industry Vertical, 2017-2030 (US$ Mn))
10.5.2. Japan
10.5.2.1. Japan DevOps Market Estimates and Forecast, 2017-2030 (US$ Mn))
10.5.2.2. Japan DevOps, By Component, 2017-2030 (US$ Mn))
10.5.2.3. Japan DevOps, By Cloud Type, 2017-2030 (US$ Mn))
10.5.2.4. Japan DevOps, By Enterprise Size, 2017-2030 (US$ Mn))
10.5.2.5. Japan DevOps, By Industry Vertical, 2017-2030 (US$ Mn))
10.5.3. India
10.5.3.1. India DevOps Market Estimates and Forecast, 2017-2030 (US$ Mn))
10.5.3.2. India DevOps, By Component, 2017-2030 (US$ Mn))
10.5.3.3. India DevOps, By Cloud Type, 2017-2030 (US$ Mn))
10.5.3.4. India DevOps, By Enterprise Size, 2017-2030 (US$ Mn))
10.5.3.5. India DevOps, By Industry Vertical, 2017-2030 (US$ Mn))
10.5.4. South Korea
10.5.4.1. South Korea DevOps Market Estimates and Forecast, 2017-2030 (US$ Mn))
10.5.4.2. South Korea DevOps, By Component, 2017-2030 (US$ Mn))
10.5.4.3. South Korea DevOps, By Cloud Type, 2017-2030 (US$ Mn))
10.5.4.4. South Korea DevOps, By Enterprise Size, 2017-2030 (US$ Mn))
10.5.4.5. South Korea DevOps, By Industry Vertical, 2017-2030 (US$ Mn))
10.5.5. South-East Asia
10.5.5.1. South-East Asia DevOps Market Estimates and Forecast, 2017-2030 (US$ Mn))
10.5.5.2. South-East Asia DevOps, By Component, 2017-2030 (US$ Mn))
10.5.5.3. South-East Asia DevOps, By Cloud Type, 2017-2030 (US$ Mn))
10.5.5.4. South-East Asia DevOps, By Enterprise Size, 2017-2030 (US$ Mn))
10.5.5.5. South-East Asia DevOps, By Industry Vertical, 2017-2030 (US$ Mn))
10.5.6. Rest of Asia Pacific
10.5.6.1. Rest of Asia Pacific DevOps Market Estimates and Forecast, 2017-2030 (US$ Mn))
10.5.6.2. Rest of Asia Pacific DevOps, By Component, 2017-2030 (US$ Mn))
10.5.6.3. Rest of Asia Pacific DevOps, By Cloud Type, 2017-2030 (US$ Mn))
10.5.6.4. Rest of Asia Pacific DevOps, By Enterprise Size, 2017-2030 (US$ Mn))
10.5.6.5. Rest of Asia Pacific DevOps, By Industry Vertical, 2017-2030 (US$ Mn))

11. Latin America DevOps Market Analysis
11.1. Latin America DevOps Market, by Component, 2017-2030(US$ Mn))
11.1.1. Overview
11.1.2. SRC Analysis
11.2. Latin America DevOps Market, by Cloud Type, 2017-2030(US$ Mn))
11.2.1. Overview
11.2.2. SRC Analysis
11.3. Latin America DevOps Market, by Enterprise Size, 2017-2030(US$ Mn))
11.3.1. Overview
11.3.2. SRC Analysis
11.4. Latin America DevOps Market, by Industry Vertical, 2017-2030(US$ Mn))
11.4.1. Overview
11.4.2. SRC Analysis
11.5. Latin America DevOps Market, by Country, 2017-2030 (US$ Mn))
11.5.1. Brazil
11.5.1.1. Brazil DevOps Market Estimates and Forecast, 2017-2030 (US$ Mn))
11.5.1.2. Brazil DevOps, By Component, 2017-2030 (US$ Mn))
11.5.1.3. Brazil DevOps, By Cloud Type, 2017-2030 (US$ Mn))
11.5.1.4. Brazil DevOps, By Enterprise Size, 2017-2030 (US$ Mn))
11.5.1.5. Brazil DevOps, By Industry Vertical, 2017-2030 (US$ Mn))
11.5.2. Mexico
11.5.2.1. Mexico DevOps Market Estimates and Forecast, 2017-2030 (US$ Mn))
11.5.2.2. Mexico DevOps, By Component, 2017-2030 (US$ Mn))
11.5.2.3. Mexico DevOps, By Cloud Type, 2017-2030 (US$ Mn))
11.5.2.4. Mexico DevOps, By Enterprise Size, 2017-2030 (US$ Mn))
11.5.2.5. Mexico DevOps, By Industry Vertical, 2017-2030 (US$ Mn))
11.5.3. Rest of Latin America
11.5.3.1. Rest of Latin America DevOps Market Estimates and Forecast, 2017-2030 (US$ Mn))
11.5.3.2. Rest of Latin America DevOps, By Component, 2017-2030 (US$ Mn))
11.5.3.3. Rest of Latin America DevOps, By Cloud Type, 2017-2030 (US$ Mn))
11.5.3.4. Rest of Latin America DevOps, By Enterprise Size, 2017-2030 (US$ Mn))
11.5.3.5. Rest of Latin America DevOps, By Industry Vertical, 2017-2030 (US$ Mn))

12. Middle East and Africa DevOps Market Analysis
12.1. Middle East and Africa DevOps Market, by Component, 2017-2030(US$ Mn))
12.1.1. Overview
12.1.2. SRC Analysis
12.2. Middle East and Africa DevOps Market, by Cloud Type, 2017-2030(US$ Mn))
12.2.1. Overview
12.2.2. SRC Analysis
12.3. Middle East and Africa DevOps Market, by Enterprise Size, 2017-2030(US$ Mn))
12.3.1. Overview
12.3.2. SRC Analysis
12.4. Middle East and Africa DevOps Market, by Industry Vertical, 2017-2030(US$ Mn))
12.4.1. Overview
12.4.2. SRC Analysis
12.5. Middle East and Africa DevOps Market, by Country, 2017-2030 (US$ Mn))
12.5.1. GCC Countries
12.5.1.1. GCC Countries DevOps Market Estimates and Forecast, 2017-2030 (US$ Mn))
12.5.1.2. GCC Countries DevOps, By Component, 2017-2030 (US$ Mn))
12.5.1.3. GCC Countries DevOps, By Cloud Type, 2017-2030 (US$ Mn))
12.5.1.4. GCC Countries DevOps, By Enterprise Size, 2017-2030 (US$ Mn))
12.5.1.5. GCC Countries DevOps, By Industry Vertical, 2017-2030 (US$ Mn))
12.5.2. South Africa
12.5.2.1. South Africa DevOps Market Estimates and Forecast, 2017-2030 (US$ Mn))
12.5.2.2. South Africa DevOps, By Component, 2017-2030 (US$ Mn))
12.5.2.3. South Africa DevOps, By Cloud Type, 2017-2030 (US$ Mn))
12.5.2.4. South Africa DevOps, By Enterprise Size, 2017-2030 (US$ Mn))
12.5.2.5. South Africa DevOps, By Industry Vertical, 2017-2030 (US$ Mn))
12.5.3. Rest of Middle East and Africa
12.5.3.1. Rest of Middle East and Africa DevOps Market Estimates and Forecast, 2017-2030 (US$ Mn))
12.5.3.2. Rest of Middle East and Africa DevOps, By Component, 2017-2030 (US$ Mn))
12.5.3.3. Rest of Middle East and Africa DevOps, By Cloud Type, 2017-2030 (US$ Mn))
12.5.3.4. Rest of Middle East and Africa DevOps, By Enterprise Size, 2017-2030 (US$ Mn))
12.5.3.5. Rest of Middle East and Africa DevOps, By Industry Vertical, 2017-2030 (US$ Mn))

13. Company Profiles
13.1. Amazon Web Services, inc.
13.1.1. Company Overview
13.1.2. Cloud Types/Services Portfolio
13.1.3. Geographical Presence
13.1.4. Financial Summary
13.1.4.1. Market Revenue and Net Profit (2019-2022)
13.1.4.2. Business Segment Revenue Analysis
13.1.4.3. Geographical Revenue Analysis
13.2. Broadcom
13.3. Dell Technologies, Inc.
13.4. Google LLC
13.5. Hewlett Packard Enterprise Development LP
13.6. IBM Corporation
13.7. Micro focus
13.8. Microsoft Corporation
13.9. Oracle Corporation
13.10. Rackspace Technology

List of Figures
FIG. 1 Global DevOps Market: Research Methodology
FIG. 2 Market Size Estimation – Top Down & Bottom up Approach
FIG. 3 Global DevOps Market Segmentation
FIG. 4 Global DevOps Market, by Component, 2022 (US$ Mn))
FIG. 5 Global DevOps Market, by Cloud Type, 2022 (US$ Mn))
FIG. 6 Global DevOps Market, by Enterprise Size, 2022 (US$ Mn))
FIG. 7 Global DevOps Market, by Industry Vertical, 2022 (US$ Mn))
FIG. 8 Global DevOps Market, by Geography, 2022 (US$ Mn))
FIG. 9 Attractive Investment Proposition, by Component, 2022
FIG. 10 Attractive Investment Proposition, by Cloud Type, 2022
FIG. 11 Attractive Investment Proposition, by Enterprise Size, 2022
FIG. 12 Attractive Investment Proposition, by Industry Vertical, 2022
FIG. 13 Attractive Investment Proposition, by Geography, 2022
FIG. 14 Global Market Share Analysis of Key DevOps Market Manufacturers, 2022
FIG. 15 Global Market Positioning of Key DevOps Market Manufacturers, 2022
FIG. 16 Global DevOps Market Value Contribution, By Component, 2022 & 2030 (Value %)
FIG. 17 Global DevOps Market, by Solution, Value, 2017-2030 (US$ Mn))
FIG. 18 Global DevOps Market, by Service, Value, 2017-2030 (US$ Mn))
FIG. 19 Global DevOps Market Value Contribution, By Cloud Type, 2022 & 2030 (Value %)
FIG. 20 Global DevOps Market, by Public Cloud, Value, 2017-2030 (US$ Mn))
FIG. 21 Global DevOps Market, by Private Cloud, 2017-2030 (US$ Mn))
FIG. 22 Global DevOps Market, by Hybrid Cloud, 2017-2030 (US$ Mn))
FIG. 23 Global DevOps Market Value Contribution, By Enterprise Size, 2022 & 2030 (Value %)
FIG. 24 Global DevOps Market, By Large Enterprise, Value, 2017-2030 (US$ Mn))
FIG. 25 Global DevOps Market, By SMEs, 2017-2030 (US$ Mn))
FIG. 26 Global DevOps Market Value Contribution, By Industry Vertical, 2022 & 2030 (Value %)
FIG. 27 Global DevOps Market, by IT & Telecom, Value, 2017-2030 (US$ Mn))
FIG. 28 Global DevOps Market, by BFSI, 2017-2030 (US$ Mn))
FIG. 29 Global DevOps Market, by Retail, 2017-2030 (US$ Mn))
FIG. 30 Global DevOps Market, by Government And Public Sector, 2017-2030 (US$ Mn))
FIG. 31 Global DevOps Market, by Manufacturing, 2017-2030 (US$ Mn))
FIG. 32 Global DevOps Market, by Healthcare, 2017-2030 (US$ Mn))
FIG. 33 Global DevOps Market, by Others, 2017-2030 (US$ Mn))
FIG. 34 North America DevOps Market, 2017-2030 (US$ Mn))
FIG. 35 U.S. DevOps Market, 2017-2030 (US$ Mn))
FIG. 36 Canada DevOps Market, 2017-2030 (US$ Mn))
FIG. 37 Europe DevOps Market, 2017-2030 (US$ Mn))
FIG. 38 Germany DevOps Market, 2017-2030 (US$ Mn))
FIG. 39 France DevOps Market, 2017-2030 (US$ Mn))
FIG. 40 U.K. DevOps Market, 2017-2030 (US$ Mn))
FIG. 41 Italy DevOps Market, 2017-2030 (US$ Mn))
FIG. 42 Spain DevOps Market, 2017-2030 (US$ Mn))
FIG. 43 Rest of Europe DevOps Market, 2017-2030 (US$ Mn))
FIG. 44 Asia Pacific DevOps Market, 2017-2030 (US$ Mn))
FIG. 45 China DevOps Market, 2017-2030 (US$ Mn))
FIG. 46 Japan DevOps Market, 2017-2030 (US$ Mn))
FIG. 47 India DevOps Market, 2017-2030 (US$ Mn))
FIG. 48 South Korea DevOps Market, 2017-2030 (US$ Mn))
FIG. 49 South-East Asia DevOps Market, 2017-2030 (US$ Mn))
FIG. 50 Rest of Asia Pacific DevOps Market, 2017-2030 (US$ Mn))
FIG. 51 Latin America DevOps Market, 2017-2030 (US$ Mn))
FIG. 52 Brazil DevOps Market, 2017-2030 (US$ Mn))
FIG. 53 Mexico DevOps Market, 2017-2030 (US$ Mn))
FIG. 54 Rest of Latin America DevOps Market, 2017-2030 (US$ Mn))
FIG. 55 Middle East & Africa DevOps Market, 2017-2030 (US$ Mn))
FIG. 56 GCC Countries DevOps Market, 2017-2030 (US$ Mn))
FIG. 57 South Africa DevOps Market, 2017-2030 (US$ Mn))
FIG. 58 Rest of Middle East and Africa DevOps Market, 2017-2030 (US$ Mn))

List of Tables
TABLE 1 Market Snapshot: Global DevOps Market
TABLE 2 Global DevOps Market, by Competitive Benchmarking, 2022
TABLE 3 Global DevOps Market, by Geographical Presence Analysis, 2022
TABLE 4 Global DevOps Market, by Key Strategies Analysis, 2022
TABLE 5 Global DevOps Market, by Component, 2017-2030 (US$ Mn))
TABLE 6 Global DevOps Market, by Cloud Type, 2017-2030 (US$ Mn))
TABLE 7 Global DevOps Market, by Enterprise Size, 2017-2030 (US$ Mn))
TABLE 8 Global DevOps Market, by Industry Vertical, 2017-2030 (US$ Mn))
TABLE 9 Global DevOps Market, by Geography, 2017-2030 (US$ Mn))
TABLE 10 North America DevOps Market, by Component, 2017-2030 (US$ Mn))
TABLE 11 North America DevOps Market, by Cloud Type, 2017-2030 (US$ Mn))
TABLE 12 North America DevOps Market, by Enterprise Size, 2017-2030 (US$ Mn))
TABLE 13 North America DevOps Market, by Industry Vertical, 2017-2030 (US$ Mn))
TABLE 14 North America DevOps Market, by Country, 2017-2030 (US$ Mn))
TABLE 15 US DevOps Market, by Component, 2017-2030 (US$ Mn))
TABLE 16 US DevOps Market, by Cloud Type, 2017-2030 (US$ Mn))
TABLE 17 US DevOps Market, by Enterprise Size, 2017-2030 (US$ Mn))
TABLE 18 US DevOps Market, by Industry Vertical, 2017-2030 (US$ Mn))
TABLE 19 Canada DevOps Market, by Component, 2017-2030 (US$ Mn))
TABLE 20 Canada DevOps Market, by Cloud Type, 2017-2030 (US$ Mn))
TABLE 21 Canada DevOps Market, by Enterprise Size, 2017-2030 (US$ Mn))
TABLE 22 Canada DevOps Market, by Industry Vertical, 2017-2030 (US$ Mn))
TABLE 23 Europe DevOps Market, by Component, 2017-2030 (US$ Mn))
TABLE 24 Europe DevOps Market, by Cloud Type, 2017-2030 (US$ Mn))
TABLE 25 Europe DevOps Market, by Enterprise Size, 2017-2030 (US$ Mn))
TABLE 26 Europe DevOps Market, by Industry Vertical, 2017-2030 (US$ Mn))
TABLE 27 Europe DevOps Market, by Country, 2017-2030 (US$ Mn))
TABLE 28 Germany DevOps Market, by Component, 2017-2030 (US$ Mn))
TABLE 29 Germany DevOps Market, by Cloud Type, 2017-2030 (US$ Mn))
TABLE 30 Germany DevOps Market, by Enterprise Size, 2017-2030 (US$ Mn))
TABLE 31 Germany DevOps Market, by Industry Vertical, 2017-2030 (US$ Mn))
TABLE 32 France DevOps Market, by Component, 2017-2030 (US$ Mn))
TABLE 33 France DevOps Market, by Cloud Type, 2017-2030 (US$ Mn))
TABLE 34 France DevOps Market, by Enterprise Size, 2017-2030 (US$ Mn))
TABLE 35 France DevOps Market, by Industry Vertical, 2017-2030 (US$ Mn))
TABLE 36 UK DevOps Market, by Component, 2017-2030 (US$ Mn))
TABLE 37 UK DevOps Market, by Cloud Type, 2017-2030 (US$ Mn))
TABLE 38 UK DevOps Market, by Enterprise Size, 2017-2030 (US$ Mn))
TABLE 39 UK DevOps Market, by Industry Vertical, 2017-2030 (US$ Mn))
TABLE 40 Italy DevOps Market, by Component, 2017-2030 (US$ Mn))
TABLE 41 Italy DevOps Market, by Cloud Type, 2017-2030 (US$ Mn))
TABLE 42 Italy DevOps Market, by Enterprise Size, 2017-2030 (US$ Mn))
TABLE 43 Italy DevOps Market, by Industry Vertical, 2017-2030 (US$ Mn))
TABLE 44 Spain DevOps Market, by Component, 2017-2030 (US$ Mn))
TABLE 45 Spain DevOps Market, by Cloud Type, 2017-2030 (US$ Mn))
TABLE 46 Spain DevOps Market, by Enterprise Size, 2017-2030 (US$ Mn))
TABLE 47 Spain DevOps Market, by Industry Vertical, 2017-2030 (US$ Mn))
TABLE 48 Rest of Europe DevOps Market, by Component, 2017-2030 (US$ Mn))
TABLE 49 Rest of Europe DevOps Market, by Cloud Type, 2017-2030 (US$ Mn))
TABLE 50 Rest of Europe DevOps Market, by Enterprise Size, 2017-2030 (US$ Mn))
TABLE 51 Rest of Europe DevOps Market, by Industry Vertical, 2017-2030 (US$ Mn))
TABLE 52 Asia Pacific DevOps Market, by Component, 2017-2030 (US$ Mn))
TABLE 53 Asia Pacific DevOps Market, by Cloud Type, 2017-2030 (US$ Mn))
TABLE 54 Asia Pacific DevOps Market, by Enterprise Size, 2017-2030 (US$ Mn))
TABLE 55 Asia Pacific DevOps Market, by Industry Vertical, 2017-2030 (US$ Mn))
TABLE 56 Asia Pacific DevOps Market, by Country, 2017-2030 (US$ Mn))
TABLE 57 China DevOps Market, by Component, 2017-2030 (US$ Mn))
TABLE 58 China DevOps Market, by Cloud Type, 2017-2030 (US$ Mn))
TABLE 59 China DevOps Market, by Enterprise Size, 2017-2030 (US$ Mn))
TABLE 60 China DevOps Market, by Industry Vertical, 2017-2030 (US$ Mn))
TABLE 61 Japan DevOps Market, by Component, 2017-2030 (US$ Mn))
TABLE 62 Japan DevOps Market, by Cloud Type, 2017-2030 (US$ Mn))
TABLE 63 Japan DevOps Market, by Enterprise Size, 2017-2030 (US$ Mn))
TABLE 64 Japan DevOps Market, by Industry Vertical, 2017-2030 (US$ Mn))
TABLE 65 India DevOps Market, by Component, 2017-2030 (US$ Mn))
TABLE 66 India DevOps Market, by Cloud Type, 2017-2030 (US$ Mn))
TABLE 67 India DevOps Market, by Enterprise Size, 2017-2030 (US$ Mn))
TABLE 68 India DevOps Market, by Industry Vertical, 2017-2030 (US$ Mn))
TABLE 69 South Korea DevOps Market, by Component, 2017-2030 (US$ Mn))
TABLE 70 South Korea DevOps Market, by Cloud Type, 2017-2030 (US$ Mn))
TABLE 71 South Korea DevOps Market, by Enterprise Size, 2017-2030 (US$ Mn))
TABLE 72 South Korea DevOps Market, by Industry Vertical, 2017-2030 (US$ Mn))
TABLE 73 South-East Asia DevOps Market, by Component, 2017-2030 (US$ Mn))
TABLE 74 South-East Asia DevOps Market, by Cloud Type, 2017-2030 (US$ Mn))
TABLE 75 South-East Asia DevOps Market, by Enterprise Size, 2017-2030 (US$ Mn))
TABLE 76 South-East Asia DevOps Market, by Industry Vertical, 2017-2030 (US$ Mn))
TABLE 77 Rest of Asia Pacific DevOps Market, by Component, 2017-2030 (US$ Mn))
TABLE 78 Rest of Asia Pacific DevOps Market, by Cloud Type, 2017-2030 (US$ Mn))
TABLE 79 Rest of Asia Pacific DevOps Market, by Enterprise Size, 2017-2030 (US$ Mn))
TABLE 80 Rest of Asia Pacific DevOps Market, by Industry Vertical, 2017-2030 (US$ Mn))
TABLE 81 Latin America DevOps Market, by Component, 2017-2030 (US$ Mn))
TABLE 82 Latin America DevOps Market, by Cloud Type, 2017-2030 (US$ Mn))
TABLE 83 Latin America DevOps Market, by Enterprise Size, 2017-2030 (US$ Mn))
TABLE 84 Latin America DevOps Market, by Industry Vertical, 2017-2030 (US$ Mn))
TABLE 85 Latin America DevOps Market, by Country, 2017-2030 (US$ Mn))
TABLE 86 Brazil DevOps Market, by Component, 2017-2030 (US$ Mn))
TABLE 87 Brazil DevOps Market, by Cloud Type, 2017-2030 (US$ Mn))
TABLE 88 Brazil DevOps Market, by Enterprise Size, 2017-2030 (US$ Mn))
TABLE 89 Brazil DevOps Market, by Industry Vertical, 2017-2030 (US$ Mn))
TABLE 90 Mexico DevOps Market, by Component, 2017-2030 (US$ Mn))
TABLE 91 Mexico DevOps Market, by Cloud Type, 2017-2030 (US$ Mn))
TABLE 92 Mexico DevOps Market, by Enterprise Size, 2017-2030 (US$ Mn))
TABLE 93 Mexico DevOps Market, by Industry Vertical, 2017-2030 (US$ Mn))
TABLE 94 Rest of Latin America DevOps Market, by Component, 2017-2030 (US$ Mn))
TABLE 95 Rest of Latin America DevOps Market, by Cloud Type, 2017-2030 (US$ Mn))
TABLE 96 Rest of Latin America DevOps Market, by Enterprise Size, 2017-2030 (US$ Mn))
TABLE 97 Rest of Latin America DevOps Market, by Industry Vertical, 2017-2030 (US$ Mn))
TABLE 98 Middle East and Africa DevOps Market, by Component, 2017-2030 (US$ Mn))
TABLE 99 Middle East and Africa DevOps Market, by Cloud Type, 2017-2030 (US$ Mn))
TABLE 100 Middle East and Africa DevOps Market, by Enterprise Size, 2017-2030 (US$ Mn))
TABLE 101 Middle East and Africa DevOps Market, by Industry Vertical, 2017-2030 (US$ Mn))
TABLE 102 Middle East and Africa DevOps Market, by Country, 2017-2030 (US$ Mn))
TABLE 103 GCC Countries DevOps Market, by Component, 2017-2030 (US$ Mn))
TABLE 104 GCC Countries DevOps Market, by Cloud Type, 2017-2030 (US$ Mn))
TABLE 105 GCC Countries DevOps Market, by Enterprise Size, 2017-2030 (US$ Mn))
TABLE 106 GCC Countries DevOps Market, by Industry Vertical, 2017-2030 (US$ Mn))
TABLE 107 South Africa DevOps Market, by Component, 2017-2030 (US$ Mn))
TABLE 108 South Africa DevOps Market, by Cloud Type, 2017-2030 (US$ Mn))
TABLE 109 South Africa DevOps Market, by Enterprise Size, 2017-2030 (US$ Mn))
TABLE 110 South Africa DevOps Market, by Industry Vertical, 2017-2030 (US$ Mn))
TABLE 111 Rest of Middle East and Africa DevOps Market, by Component, 2017-2030 (US$ Mn))
TABLE 112 Rest of Middle East and Africa DevOps Market, by Cloud Type, 2017-2030 (US$ Mn))
TABLE 113 Rest of Middle East and Africa DevOps Market, by Enterprise Size, 2017-2030 (US$ Mn))
TABLE 114 Rest of Middle East and Africa DevOps Market, by Industry Vertical, 2017-2030 (US$ Mn))

Frequently asked questions

How does COVID-19 Impact the global DevOps market?

The COVID-19 outbreak positively impacted DevOps market growth because businesses suddenly needed software and web-based applications and a growing need for DevOps solutions to streamline the development of software applications by promoting collaboration between various stakeholders in the software development lifecycle.

Which is the leading region of the market for DevOps?

North America accounted for the most heightened share in the global DevOps market.

What are the key drivers for the growth of the DevOps market?

Growing enterprise demand for DevOps solutions and services is causing the DevOps Market to grow. Also, cloud-based computing will become more prevalent through services such as PaaS as enterprises rely on fast application delivery and high quality to drive the DevOps market.

Which is the major segment in the DevOps market by component?

The solution segment had a major share of the global market in 2022.

Which is the major segment in the DevOps market by industry vertical?

The IT & telecom segment had a major share in the global market.

Saudi Arabia Managed Security Services Market

Published:
Report ID: 36393

Microwave Oven Market

Published:
Report ID: 36314

Inkjet Coders Market

Published:
Report ID: 6669

Rich Communication Services Market

Published:
Report ID: 35774

Middle East and Africa Real-Time Payments Market

Published:
Report ID: 35770

Vietnam Managed Security Services (MSS) Market

Published:
Report ID: 35766

Middle East and Africa EdTech and Smart Classroom Market

Published:
Report ID: 35756

Digital Business Support System (DBSS) Market

Published:
Report ID: 35732

China Artificial Intelligence (AI) Market

Published:
Report ID: 35729

Asia-Pacific Workforce Management Software Market

Published:
Report ID: 35719

Mobile Wallet Market

Published:
Report ID: 8977

Recirculating Chillers Market

Published:
Report ID: 8862

Purchase Options

$2999
Delivery Format: Excel.
$4999
Designed for the individual purchaser.
$6999
Users located at a single corporate site or regional office.
$7999
Allowed for unlimited sharing globally within one company.
Smallform of Sample request

Have a question?

User Profile

Don’t settle for less – trust Mitul to help you find the best solution.

Report delivery within 24 to 48 hours

– Other Info –

What people say?-

User Review

I am very impressed with the information in this report. The author clearly did their research when they came up with this product and it has already given me a lot of ideas.

Jana Schmidt
CEDAR CX Technologies

– Connect with us –

Phone

+91 6232 49 3207


support

24/7 Research Support


sales@credenceresearch.com

– Research Methodology –

Going beyond the basics: advanced techniques in research methodology

– Trusted By –

Pepshi, LG, Nestle
Motorola, Honeywell, Johnson and johnson
LG Chem, SIEMENS, Pfizer
Unilever, Samsonite, QIAGEN