Home » Consumer Goods » Natural Sweeteners Market

Natural Sweeteners Market By Product (Stevia, Palm Sugar, Coconut Sugar, Honey, Maple Syrup, Monk Fruit Sugar, Agave Syrup, Lucuma Fruit Sugar, Molasses, Natural Sweetener Blends); By Application (Food, Beverages, Personal Care, Pharmaceuticals, Tabletop Sweeteners); By Form (Powder, Liquid, Crystals); By Nature (Organic, Conventional); By Sales Channel (Offline Sales, Online Sales) – Growth, Share, Opportunities & Competitive Analysis, 2024 – 2032

Report ID: 132665 | Report Format : Excel, PDF

Market Overview:

The Natural Sweeteners Market size was valued at USD 21,500.00 million in 2018 to USD 25,183.70 million in 2024 and is anticipated to reach USD 40,570.47 million by 2032, at a CAGR of 6.26% during the forecast period.

REPORT ATTRIBUTE DETAILS
Historical Period 2020-2023
Base Year 2024
Forecast Period 2025-2032
Natural Sweeteners Market Size 2024 USD 25,183.70 million
Natural Sweeteners Market, CAGR 6.26%
Natural Sweeteners Market Size 2032 USD 40,570.47 million


Growing awareness of the health risks associated with refined sugar drives adoption of natural sweeteners across global food and beverage sectors. Consumers prefer plant-based and low-calorie alternatives such as stevia, monk fruit, and agave syrup to reduce sugar intake without sacrificing flavor. Food manufacturers actively reformulate products to meet clean-label and wellness demands. Rising cases of diabetes and obesity worldwide further accelerate the shift toward natural ingredients. Continuous technological innovation enhances extraction efficiency and flavor balance, making natural sweeteners more cost-effective and widely accepted.

Geographically, North America and Europe lead the market due to high health consciousness, mature food industries, and strict sugar reduction regulations. Asia Pacific is emerging as the fastest-growing region, fueled by increasing disposable incomes, growing urbanization, and expanding food processing sectors. Countries such as China, Japan, and India witness strong uptake driven by local production of stevia and monk fruit. Latin America gains traction through expanding functional food industries, while the Middle East and Africa show gradual growth supported by changing dietary preferences and growing awareness of low-calorie alternatives.

Natural Sweeteners Market size

Market Insights:

  • The Natural Sweeteners Market was valued at USD 21,500.00 million in 2018, reaching USD 25,183.70 million in 2024 and projected at USD 40,570.47 million by 2032, growing at a CAGR of 6.26%.
  • Asia Pacific leads the market with around 37% share, supported by rising health awareness, stevia cultivation, and growing food and beverage production across China, Japan, and India.
  • North America follows with about 28% share, driven by clean-label trends, regulatory sugar reduction policies, and mature food manufacturing industries. Europe ranks third with nearly 25% share, influenced by strong consumer demand for natural and organic food ingredients.
  • Asia Pacific is also the fastest-growing region with a 7.1% CAGR, supported by local sourcing, expanding retail networks, and a shift toward natural, low-calorie product.
  • By nature, conventional sweeteners account for around 65% share, while organic variants hold about 35%, reflecting the growing but still smaller demand for certified organic alternatives.

Access crucial information at unmatched prices!

Request your sample report today & start making informed decisions powered by Credence Research Inc.!

Download Sample

Market Drivers

Rising Global Health Awareness and Shift Toward Low-Calorie Consumption

Consumers are increasingly aware of the negative effects of excessive sugar intake on health. The shift toward low-calorie and sugar-free products drives wider acceptance of natural sweeteners. Food and beverage companies invest in reformulating products to cater to diabetic and health-conscious populations. It benefits from awareness programs that promote reduced sugar consumption through natural alternatives. The availability of plant-based options like stevia and monk fruit improves consumer acceptance. Governments enforce labeling regulations that encourage clean ingredients. Nutritionists recommend natural sweeteners to lower risks of obesity and cardiovascular issues. Expanding access to health information across digital platforms continues to boost awareness globally.

  • For example, Nestlé developed a patented enzymatic process that reduces intrinsic sugar in milk, malt, and fruit juice ingredients by up to 30% without affecting taste or texture. The technology, applied to over 200,000 tons of cocoa and malt-based beverages like Milo since 2021, supports natural sweetness and cleaner formulations.

Growing Integration in the Food and Beverage Manufacturing Sector

The food and beverage industry plays a vital role in advancing adoption across product categories. Manufacturers use natural sweeteners in dairy, bakery, and beverages to replace synthetic options. It gains traction due to the ability to retain sweetness with lower caloric values. Beverage companies lead the transition by launching zero-calorie drinks without artificial components. Producers integrate advanced formulation techniques to balance taste and stability. New ingredient blends improve solubility and performance during production. The market benefits from strong partnerships between ingredient suppliers and global brands. These collaborations expand usage in mainstream and niche product lines alike.

  • For example, Danone reformulated its Danonino children’s yogurt in Mexico by reducing sugar content by 43.8%, and since 2008 has lowered sugar by 32% in its Aquadrinks portfolio. This demonstrates a tangible sugar reduction effort integrated into mainstream children’s dairy products, aligning with consumer demand for healthier, low-sugar options.

Supportive Regulatory Frameworks and Sugar Reduction Policies

Government policies that restrict sugar levels across processed foods encourage the rise of natural sweeteners. Health authorities impose sugar taxes that pressure manufacturers to adopt cleaner alternatives. The Natural Sweeteners Market experiences steady growth due to favorable labeling laws in developed regions. Food safety organizations approve several plant-derived sweeteners for safe consumption. This support enhances consumer trust and brand transparency. Industry compliance with strict quality standards promotes consistent market performance. Manufacturers respond with research programs focusing on purity and extraction efficiency. These regulations continue to shape innovation pipelines in global food sectors.

Technological Advancements and Product Innovation in Ingredient Development

Modern extraction and formulation technologies enhance sweetness profiles without compromising texture or flavor. Ingredient firms develop concentrated extracts that mimic sugar taste with higher efficiency. It benefits from biotechnology-driven improvements in yield and purity. Companies explore enzymatic and fermentation-based processes to create stable compounds. This innovation ensures scalability for large-scale production at lower costs. Startups develop customized sweetener blends targeting beverages, confectionery, and pharmaceuticals. Continuous R&D fosters competitive differentiation through improved solubility and shelf stability. The trend supports sustainable sourcing and higher environmental compliance.

Market Trends

Rising Demand for Plant-Based and Sustainable Ingredients

Consumer demand for plant-based and eco-friendly sweeteners continues to accelerate. Companies emphasize sustainable cultivation of stevia, agave, and coconut sugar to meet environmental goals. The Natural Sweeteners Market benefits from agricultural traceability programs supporting ethical sourcing. Food brands highlight sustainability credentials to attract environmentally aware buyers. Manufacturers reduce dependency on synthetic fertilizers to maintain organic certifications. Packaging innovation aligns with green branding strategies in premium product categories. Supply chain transparency strengthens confidence in product quality. This shift aligns with global sustainability objectives across major industries.

  • For instance, Sweet Harvest Foods is the first U.S. honey company approved under the USDA Process Verified Program, which independently verifies sustainable direct sourcing and provides full product traceability audited by the USDA, reinforcing environmental and ethical sourcing commitments.

Increasing Use in Functional and Nutraceutical Formulations

The growing preference for functional foods and dietary supplements fuels steady adoption. Natural sweeteners act as suitable carriers in health-focused beverages and protein blends. It aligns with wellness trends demanding low-calorie energy and recovery products. Nutraceutical brands prefer non-artificial ingredients to enhance credibility among fitness consumers. Natural ingredients support gut-friendly and diabetic-friendly formulations without taste compromise. Ingredient producers tailor sweetness intensity for specific therapeutic uses. Cross-segment collaboration between nutrition firms and food manufacturers boosts product innovation. Functional integration continues to redefine consumer health experiences across multiple sectors.

Expanding Role in Clean Label and Transparent Product Marketing

Clean label movements drive rapid expansion across the natural ingredients landscape. Brands reduce additive counts to match minimalist consumer expectations. It helps establish authenticity and reliability in health-driven product lines. Transparent ingredient labeling builds long-term brand loyalty. Companies capitalize on marketing claims that highlight purity and traceability. Retailers prefer certified natural sweeteners that meet regulatory and safety norms. Clean labeling also supports expansion into premium organic retail channels. The trend ensures compliance with evolving global health and safety requirements.

  • For instance, Ingredion employs its Truetrace system offering USDA Organic and Non-GMO Project Verified natural sweeteners, enabling clean-label certification with transparent supply chains meeting retail and regulatory standards.

Adoption of Advanced Processing and Taste Enhancement Technologies

Innovation in taste enhancement ensures better consumer satisfaction without bitterness. Advanced processing methods minimize off-notes commonly associated with certain natural sweeteners. It promotes wider acceptance among mainstream food manufacturers. AI-assisted flavor mapping helps identify optimal blends for sugar reduction. Microencapsulation techniques improve stability in liquid and baked goods. Ingredient developers use nanotechnology to increase dispersion and sweetness perception. The approach reduces aftertaste while maintaining consistent quality. Continuous R&D investment fuels technological leadership within the competitive industry.

Natural Sweeteners Market share

Market Challenges Analysis

High Production Costs and Limited Raw Material Availability

Production of natural sweeteners involves complex extraction processes that raise manufacturing expenses. The Natural Sweeteners Market faces raw material shortages during inconsistent agricultural seasons. Stevia and agave cultivation depend on specific climate conditions that restrict scalability. Farmers often lack advanced irrigation and harvesting systems needed for reliable output. Limited global supply increases price volatility and affects profit margins. Manufacturers struggle to maintain consistent sweetness profiles across batches. Smaller firms face higher procurement costs that hinder entry. Continuous investment in sustainable sourcing becomes essential to overcome these constraints.

Taste Variability, Consumer Perception, and Regulatory Complexities

Natural sweeteners exhibit taste variations that challenge product uniformity across applications. It faces issues of perceived bitterness or metallic aftertaste in high-concentration uses. Consumer skepticism about natural labels persists due to mixed messaging in marketing campaigns. Manufacturers must balance sweetness intensity without compromising nutritional standards. Regulatory frameworks differ across countries, causing compliance difficulties for exporters. Complex labeling norms delay product approvals and distribution. Food safety standards continue to evolve, requiring costly reformulations. These factors collectively slow market expansion and reduce competitive flexibility.

Market Opportunities

Rising Demand for Diabetic-Friendly and Low-Glycemic Products

The growing diabetic population opens strong prospects across global food chains. The Natural Sweeteners Market benefits from products formulated for low-glycemic diets. Consumers prefer sweeteners that support stable blood sugar levels. Food producers develop diabetic-friendly bakery and beverage options with natural alternatives. Healthcare professionals recommend these solutions for better glycemic control. Expanding wellness programs and nutritional education foster adoption among older populations. Retailers expand shelf space for certified diabetic products. This demand creates scalable opportunities in mainstream grocery categories.

Expansion of Application Scope in Pharmaceuticals and Personal Care

Pharmaceutical firms explore natural sweeteners for syrups, lozenges, and oral supplements. It enhances palatability without synthetic additives. The cosmetic industry uses natural ingredients in lip care and toothpaste for mild sweetness. These applications extend beyond traditional food and beverage use. Rising consumer demand for chemical-free formulations promotes cross-industry innovation. Global players invest in R&D to identify multi-functional properties. The widening product range supports long-term industry diversification. This diversification ensures continued relevance across wellness and lifestyle sectors.

Market Segmentation Analysis:

The Natural Sweeteners Market is segmented by product type, application, form, nature, and sales channel.

By Product Type

The Natural Sweeteners Market includes stevia, palm sugar, coconut sugar, honey, maple syrup, monk fruit sugar, agave syrup, lucuma fruit sugar, molasses, and natural sweetener blends. Stevia dominates due to its zero-calorie property and strong use in beverages and snacks. Honey and agave syrup retain popularity in bakery and confectionery products, supported by their natural origin and rich flavor. Coconut and palm sugar gain traction among diabetic consumers for their lower glycemic index. Monk fruit sugar and maple syrup strengthen presence in premium and specialty foods. Molasses and lucuma fruit sugar occupy niche roles in traditional and organic product lines. Natural sweetener blends expand rapidly as brands combine different sources to balance taste and stability in industrial production.

  • For instance, PureCircle by Ingredion has demonstrated through peer-reviewed life cycle assessments that its Reb M stevia production reduces climate change impact by 82% compared to sugar and bioconversion technology reduces it by 50%, showcasing industry-leading environmental sustainability.

By Application

The food segment holds a major share of the Natural Sweeteners Market, driven by high incorporation in bakery, confectionery, and processed meals. Beverages follow, supported by demand for low-calorie soft drinks, teas, and juices. Personal care manufacturers use natural sweeteners in oral hygiene and skincare products for mild sweetness and soothing properties. Pharmaceutical firms integrate natural options in syrups and chewable supplements to improve flavor profiles. Tabletop sweeteners maintain steady demand across households and foodservice outlets. It benefits from global sugar reduction initiatives and reformulation trends across large food and beverage brands.

By Form

The market divides into powder, liquid, and crystal forms. Powder sweeteners lead usage due to ease of handling, stable storage, and compatibility with industrial blending. Liquid forms grow in beverage, dairy, and syrup applications, offering better solubility and natural taste retention. Crystals find niche adoption in tabletop and confectionery segments requiring controlled sweetness levels. It experiences continuous formulation advancements aimed at improving solubility and stability under varied processing conditions. Manufacturers increasingly invest in flexible production lines to cater to diverse industrial requirements.

  • For example, Ingredion, through its PureCircle brand, supplies stevia-based sweeteners that are 250 to 400 times sweeter than sugar. These plant-derived ingredients are used in bakery, beverage, and dairy formulations to reduce calories while maintaining taste, supporting clean-label and natural product development across the food industry.

By Nature

Organic and conventional forms shape the Natural Sweeteners Market structure. Organic sweeteners gain momentum from rising consumer awareness of chemical-free and environmentally friendly production. Brands emphasize traceable supply chains and certification compliance to attract premium buyers. Conventional variants continue to dominate due to cost-effectiveness and broad industrial availability. It experiences competitive growth across both categories as sustainability initiatives and organic certifications evolve.

By Sales Channel

Offline sales dominate the Natural Sweeteners Market, supported by strong distribution networks through supermarkets, specialty stores, and direct B2B channels. Food manufacturers rely on established retail and wholesale suppliers for consistent bulk procurement. Online sales expand rapidly with growing e-commerce adoption and consumer awareness about health-oriented products. It gains visibility through digital marketing and subscription-based models for home consumption. Marketplaces featuring certified organic and specialty natural sweeteners enhance customer reach and global brand recognition. The shift toward hybrid retail models continues to strengthen market accessibility and growth.

Natural Sweeteners Market segmentation

Segmentation:

By Product Type

  • Stevia
  • Palm Sugar
  • Coconut Sugar
  • Honey
  • Maple Syrup
  • Monk Fruit Sugar
  • Agave Syrup
  • Lucuma Fruit Sugar
  • Molasses
  • Natural Sweetener Blends

By Application

  • Food
  • Beverages
  • Personal Care
  • Pharmaceuticals
  • Tabletop Sweeteners

By Form

  • Powder
  • Liquid
  • Crystals

By Nature

  • Organic
  • Conventional

By Sales Channel

  • Offline Sales
  • Online Sales

By Region

  • North America
    • U.S.
    • Canada
    • Mexico
  • Europe
    • Germany
    • France
    • U.K.
    • Italy
    • Spain
    • Rest of Europe
  • Asia Pacific
    • China
    • Japan
    • India
    • South Korea
    • South-east Asia
    • Rest of Asia Pacific
  • Latin America
    • Brazil
    • Argentina
    • Rest of Latin America
  • Middle East & Africa
    • GCC Countries
    • South Africa
    • Rest of the Middle East and Africa

Regional Analysis:

North America

The North America Natural Sweeteners Market size was valued at USD 6,106.00 million in 2018 to USD 7,041.21 million in 2024 and is anticipated to reach USD 11,323.29 million by 2032, at a CAGR of 6.3% during the forecast period. North America accounts for nearly 28% of the global share, driven by advanced food manufacturing and strong consumer preference for clean-label products. The region’s growth is supported by stringent regulations limiting added sugar levels across packaged goods. Manufacturers adopt natural alternatives such as stevia and monk fruit in beverage and confectionery applications. It benefits from robust R&D investments and presence of global ingredient producers in the U.S. and Canada. Increased awareness of diabetes and obesity prevention boosts consumer adoption. Expansion of organic retail stores and fitness-centered food brands enhances accessibility. Ongoing reformulation of products across major F&B companies strengthens long-term market growth.

Europe

The Europe Natural Sweeteners Market size was valued at USD 5,443.80 million in 2018 to USD 6,118.95 million in 2024 and is anticipated to reach USD 9,288.72 million by 2032, at a CAGR of 5.5% during the forecast period. Europe holds around 25% of the global market share, supported by the region’s strong regulatory alignment and consumer health awareness. Demand for low-calorie, organic-certified, and plant-based sweeteners rises steadily in key economies such as Germany, France, and the U.K. Food producers integrate sustainable sourcing and traceable supply chains to meet European food safety norms. It benefits from government initiatives to reduce refined sugar use in processed foods. The trend of vegan and keto diets strengthens the shift toward natural options. Major beverage and dairy firms expand product lines featuring stevia and erythritol. Continuous innovation from ingredient manufacturers promotes steady market penetration across the region.

Asia Pacific

The Asia Pacific Natural Sweeteners Market size was valued at USD 8,041.00 million in 2018 to USD 9,691.84 million in 2024 and is anticipated to reach USD 16,686.67 million by 2032, at a CAGR of 7.1% during the forecast period. Asia Pacific leads the market with nearly 37% share, driven by population growth, rapid urbanization, and expanding health awareness. Strong consumption of natural beverages and plant-based snacks fuels adoption in China, Japan, and India. It benefits from the growing diabetic population and rising disposable incomes across emerging economies. Manufacturers leverage local raw material availability such as stevia cultivation in China and monk fruit in Southeast Asia. Expanding e-commerce channels accelerate retail reach for clean-label products. Governments support sugar-reduction initiatives through awareness programs. Increasing foreign investments in food processing strengthen regional innovation capacity.

Latin America

The Latin America Natural Sweeteners Market size was valued at USD 1,118.00 million in 2018 to USD 1,294.19 million in 2024 and is anticipated to reach USD 1,901.54 million by 2032, at a CAGR of 5.1% during the forecast period. Latin America represents about 6% of the global share, supported by steady adoption in bakery and beverage manufacturing sectors. The region’s sugarcane industry provides raw material access for natural extraction processes. It benefits from growing consumer interest in healthier alternatives due to lifestyle-related health concerns. Brazil and Mexico drive regional consumption with strong beverage reformulation trends. Local producers focus on sustainable production aligned with export standards. Rising partnerships between global ingredient suppliers and regional food companies enhance availability. Expansion in health-oriented supermarket chains strengthens overall demand. Continuous government advocacy for dietary moderation fosters market stability.

Middle East

The Middle East Natural Sweeteners Market size was valued at USD 507.40 million in 2018 to USD 533.73 million in 2024 and is anticipated to reach USD 718.32 million by 2032, at a CAGR of 3.9% during the forecast period. The Middle East holds about 2% of the global share, with steady progress led by the Gulf Cooperation Council nations. The growing prevalence of obesity and diabetes supports gradual transition toward natural alternatives. It benefits from government health initiatives promoting sugar reduction in processed foods. Multinational beverage and dairy producers expand portfolios with low-calorie and clean-label variants. Import dependence remains high due to limited regional agricultural base. Retailers emphasize premium organic and halal-certified options to attract urban consumers. Rising disposable incomes in countries like UAE and Saudi Arabia create demand for healthier lifestyle products. Expanding distribution networks support sustained regional visibility.

Africa

The Africa Natural Sweeteners Market size was valued at USD 283.80 million in 2018 to USD 503.78 million in 2024 and is anticipated to reach USD 651.94 million by 2032, at a CAGR of 2.8% during the forecast period. Africa contributes roughly 2% of the global share, reflecting gradual market development supported by urbanization and awareness campaigns. The regional market experiences increasing import volumes from Asia and Europe due to limited local production. It gains traction in premium food and beverage categories targeting middle-income consumers. South Africa leads with adoption in health food segments and specialty stores. Limited infrastructure and price sensitivity remain key constraints. Government-driven nutrition programs promote sugar reduction and encourage education on healthier alternatives. International brands expand presence through partnerships with local distributors. Gradual improvements in retail logistics are expected to support broader future adoption.

Shape Your Report to Specific Countries or Regions & Enjoy 30% Off!

Key Player Analysis:

  • DuPont (US)
  • ADM (Archer Daniels Midland Company) (US)
  • Tate & Lyle PLC (UK)
  • Cargill Incorporated (US)
  • Ingredion Incorporated (US)
  • Roquette Frères (France)
  • FoodChem International Corporation (China)
  • PureCircle Ltd (US)
  • MacAndrews & Forbes Holdings Inc (Merisant) (US)
  • Ecogreen Oleochemicals (Indonesia)
  • Pyure Brands LLC (US)
  • Stevia Hub India (India)
  • Suminter India Organics (India)
  • Stevia Biotech Pvt Ltd (India)
  • The Real Stevia Company (Sweden)
  • Sweetly Stevia USA (UK)
  • XiliNat (Mexico)
  • Fooditive B.V. (Netherlands)
  • Saganà Association (Switzerland)
  • Hearthside Food Solutions LLC (US)

Competitive Analysis:

The competitive landscape of the Natural Sweeteners Market features major global players such as Archer‑Daniels‑Midland Company, Cargill Incorporated, Tate & Lyle PLC, and Ingredion Incorporated. These firms leverage robust R&D capabilities to innovate high-purity extracts from stevia, monk fruit, and other plant-derived sweeteners. They also focus on strategic alliances and acquisitions to expand geographic reach and integrate vertically. The market remains moderately fragmented, but the largest players exert significant influence in terms of price, quality and supply-chain control. It faces rising cost pressures from raw-material sourcing and regulatory compliance across multiple regions. Smaller niche firms compete on flavor differentiation and specialty applications, targeting premium and health-conscious segments. Large suppliers respond to consumer trends for cleaner labels with dedicated product lines and marketing initiatives. Competitive advantage increasingly hinges on formulation technology, cost-efficiency, and global distribution networks.

Recent Developments:

  • In April 2025, Tate & Lyle PLC (UK) reported that its integration with CP Kelco following an acquisition was on track, enhancing its natural-ingredient and sweetener solutions capabilities.
  • In February 2025, Oobli, a company developing a sweet protein platform, partnered with Ingredion Incorporated to advance the development of natural sweetener solutions. Their collaboration focuses on combining sweet proteins with stevia to create improved sweetener systems, with plans to unveil new products at Future Food Tech in San Francisco.
  • In October 2024, Tate & Lyle PLC partnered with Manus, a bio alternatives scale-up platform, to launch stevia Reb M, which is the first large-scale commercialization of an all-Americas-sourced, manufactured, and bio-converted stevia Reb M ingredient. This partnership represents a significant innovation in the natural sweeteners market, focusing on enhancing the availability and quality of stevia-based products.

Report Coverage:

The research report offers an in-depth analysis based on product type, application, form, nature, and sales channel. It details leading market players, providing an overview of their business, product offerings, investments, revenue streams, and key applications. Additionally, the report includes insights into the competitive environment, SWOT analysis, current market trends, as well as the primary drivers and constraints. Furthermore, it discusses various factors that have driven market expansion in recent years. The report also explores market dynamics, regulatory scenarios, and technological advancements that are shaping the industry. It assesses the impact of external factors and global economic changes on market growth. Lastly, it provides strategic recommendations for new entrants and established companies to navigate the complexities of the market.

Future Outlook:

  • Rising consumer focus on health and sugar reduction will sustain long-term demand for plant-based sweeteners.
  • Expansion of diabetic and low-calorie food categories will strengthen adoption across processed food and beverages.
  • Continuous R&D in fermentation and enzymatic extraction will improve taste profiles and production efficiency.
  • The surge in clean-label and organic certifications will shape product positioning across premium food brands.
  • Growing penetration in pharmaceutical and personal care applications will expand product diversification.
  • Investment in sustainable sourcing and agricultural innovation will enhance raw material availability.
  • Mergers among global ingredient manufacturers will consolidate market presence and optimize global supply chains.
  • Increasing digital retail and e-commerce penetration will boost accessibility of niche natural sweetener products.
  • Regional producers in Asia Pacific and Latin America will emerge as critical suppliers for global exports.
  • Evolving food safety regulations will drive compliance-based innovation and ensure consumer confidence worldwide.

CHAPTER NO. 1 :   GENESIS OF THE MARKET

1.1 Market Prelude – Introduction & Scope

1.2 The Big Picture – Objectives & Vision

1.3 Strategic Edge – Unique Value Proposition

1.4 Stakeholder Compass – Key Beneficiaries

CHAPTER NO. 2 :   EXECUTIVE LENS

2.1 Pulse of the Industry – Market Snapshot

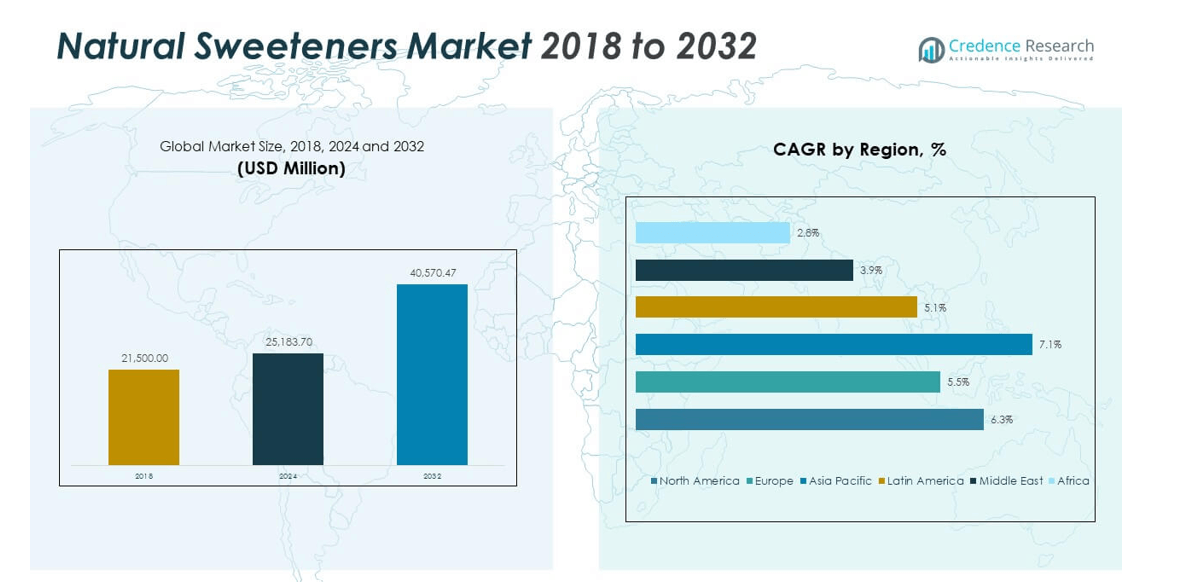
2.2 Growth Arc – Revenue Projections (USD Million)

2.3. Premium Insights – Based on Primary Interviews

CHAPTER NO. 3 :   NATURAL SWEETENERS MARKET FORCES & INDUSTRY PULSE 

3.1 Foundations of Change – Market Overview
3.2 Catalysts of Expansion – Key Market Drivers
3.2.1 Momentum Boosters – Growth Triggers
3.2.2 Innovation Fuel – Disruptive Technologies
3.3 Headwinds & Crosswinds – Market Restraints
3.3.1 Regulatory Tides – Compliance Challenges
3.3.2 Economic Frictions – Inflationary Pressures
3.4 Untapped Horizons – Growth Potential & Opportunities
3.5 Strategic Navigation – Industry Frameworks
3.5.1 Market Equilibrium – Porter’s Five Forces
3.5.2 Ecosystem Dynamics – Value Chain Analysis
3.5.3 Macro Forces – PESTEL Breakdown

3.6 Price Trend Analysis

3.6.1 Regional Price Trend
3.6.2 Price Trend by product

CHAPTER NO. 4 :   KEY INVESTMENT EPICENTER           

4.1 Regional Goldmines – High-Growth Geographies

4.2 Product Frontiers – Lucrative Product Categories

4.3 Application Sweet Spots – Emerging Demand Segments

CHAPTER NO. 5: REVENUE TRAJECTORY & WEALTH MAPPING

5.1 Momentum Metrics – Forecast & Growth Curves

5.2 Regional Revenue Footprint – Market Share Insights

5.3 Segmental Wealth Flow – Product Type & Application Revenue

CHAPTER NO. 6 :   TRADE & COMMERCE ANALYSIS      

6.1.      Import Analysis by Region

6.1.1.   Global Natural Sweeteners Market Import Revenue By Region

6.2.      Export Analysis by Region

6.2.1.   Global Natural Sweeteners Market Export Revenue By Region

CHAPTER NO. 7 :   COMPETITION ANALYSIS         

7.1.      Company Market Share Analysis

7.1.1.   Global Natural Sweeteners Market: Company Market Share

7.2.      Global Natural Sweeteners Market Company Revenue Market Share

7.3.      Strategic Developments

7.3.1.   Acquisitions & Mergers

7.3.2.   New Product Launch

7.3.3.   Regional Expansion

7.4.      Competitive Dashboard

7.5.    Company Assessment Metrics, 2024

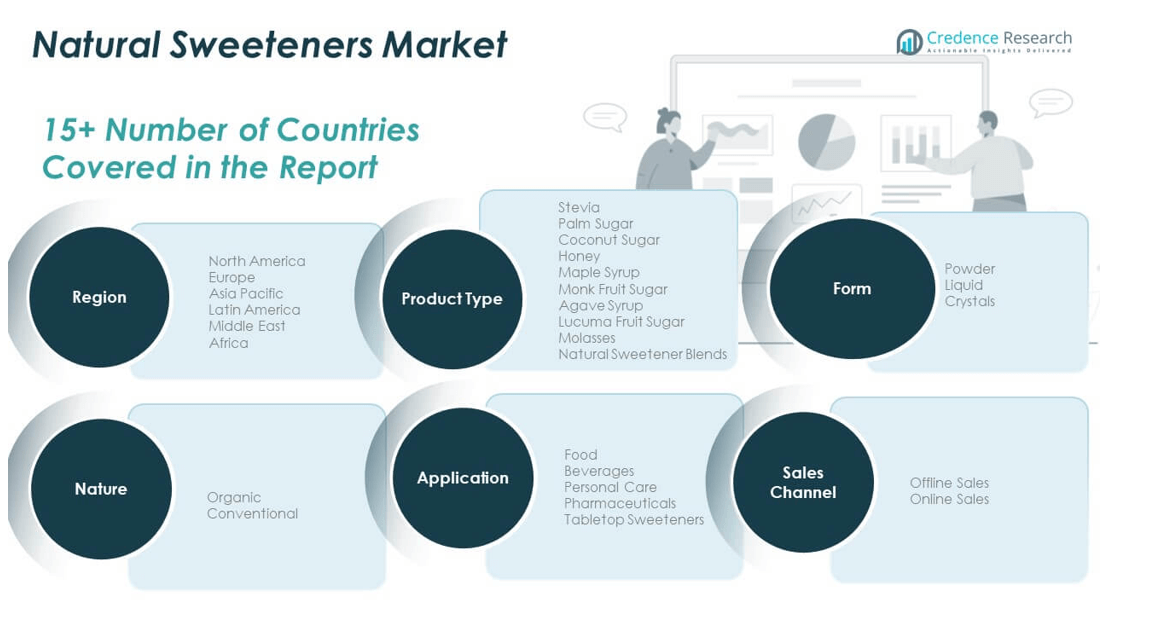
CHAPTER NO. 8 :   NATURAL SWEETENERS MARKET – BY PRODUCT TYPE  SEGMENT ANALYSIS      

8.1.      Natural Sweeteners Market Overview by Product Type Segment

8.1.1.   Natural Sweeteners Market Revenue Share By Product Type

8.2.      Stevia

8.3       Palm Sugar

8.4.      Coconut Sugar

8.5.      Honey

8.6.      Maple Syrup

8.7.      Monk Fruit Sugar

8.8.      Agave Syrup

8.9.      Lucuma Fruit Sugar

8.10.    Molasses

8.11.    Natural Sweetener Blends

CHAPTER NO. 9 :   NATURAL SWEETENERS MARKET – BY APPLICATION SEGMENT ANALYSIS 

9.1.      Natural Sweeteners Market Overview by Application Segment

9.1.1.   Natural Sweeteners Market Revenue Share By Application

9.2.      Food

9.3.      Beverages

9.4.      Personal Care

9.5.      Pharmaceuticals

9.6.      Tabletop Sweeteners


CHAPTER NO. 10 : NATURAL SWEETENERS MARKET – BY FORM SEGMENT ANALYSIS

10.1.    Natural Sweeteners Market Overview by Form Segment

10.1.1. Natural Sweeteners Market Revenue Share By Form

10.2.    Powder

10.3.    Liquid

10.4.    Crystals

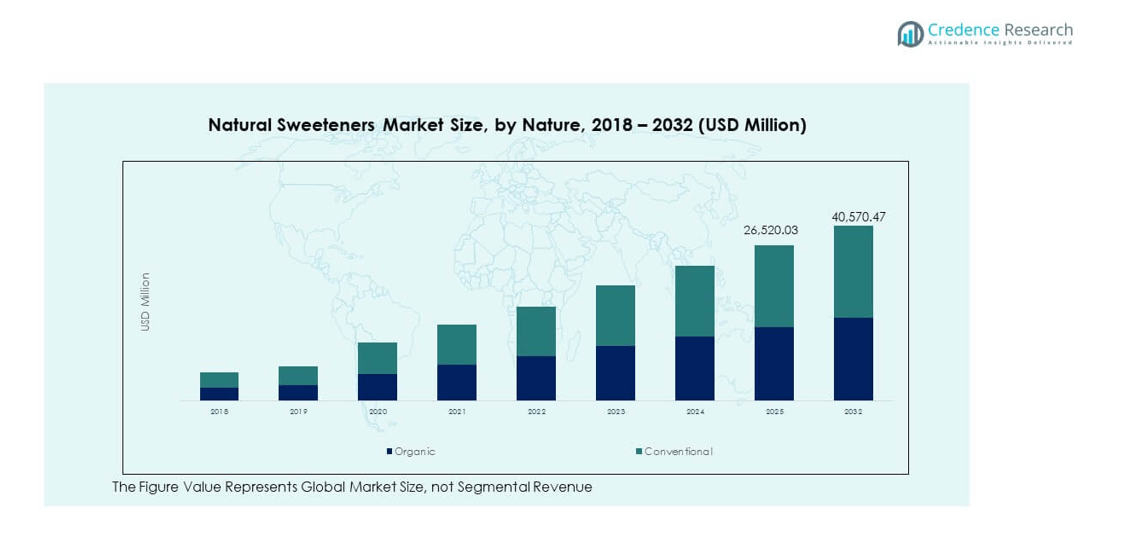
CHAPTER NO. 11 : NATURAL SWEETENERS MARKET – BY NATURE SEGMENT ANALYSIS

11.1.    Natural Sweeteners Market Overview by Nature Segment

11.1.1. Natural Sweeteners Market Revenue Share By Nature

11.2.    Organic

11.3.    Conventional

CHAPTER NO. 12 : NATURAL SWEETENERS MARKET – BY SALES CHANNEL SEGMENT ANALYSIS

12.1.    Natural Sweeteners Market Overview by Sales Channel Segment

12.1.1. Natural Sweeteners Market Revenue Share By Sales Channel

12.2.    Offline Sales

12.3.    Online Sales

CHAPTER NO. 13 : NATURAL SWEETENERS MARKET – REGIONAL ANALYSIS   

13.1.    Natural Sweeteners Market Overview by Region Segment

13.1.1. Global Natural Sweeteners Market Revenue Share By Region

13.1.2. Regions

13.1.3. Global Natural Sweeteners Market Revenue By Region

13.1.4. Product Type

13.1.5. Global Natural Sweeteners Market Revenue By Product Type

13.1.6. Application

13.1.7. Global Natural Sweeteners Market Revenue By Application

13.1.8. Form

13.1.9. Global Natural Sweeteners Market Revenue By Form

13.1.10.           Nature

13.1.12.           Global Natural Sweeteners Market Revenue By Nature

13.1.13.           Sales Channel

13.1.14.           Global Natural Sweeteners Market Revenue By Sales Channel

CHAPTER NO. 14 : NORTH AMERICA NATURAL SWEETENERS MARKET – COUNTRY ANALYSIS        

14.1.    North America Natural Sweeteners Market Overview by Country Segment

14.1.1. North America Natural Sweeteners Market Revenue Share By Region

14.2.    North America

14.2.1. North America Natural Sweeteners Market Revenue By Country

14.2.2. Product Type

14.2.3. North America Natural Sweeteners Market Revenue By Product Type

14.2.4. Application

14.2.5. North America Natural Sweeteners Market Revenue By Application

14.2.6. Form

14.2.7. North America Natural Sweeteners Market Revenue By Form

14.2.8.Nature

14.2.9. North America Natural Sweeteners Market Revenue By Nature

14.2.10.           Sales Channel

14.2.11.           North America Natural Sweeteners Market Revenue By Sales Channel

14.3.    U.S.

14.4.    Canada

14.5.    Mexico

CHAPTER NO. 15 : EUROPE NATURAL SWEETENERS MARKET – COUNTRY ANALYSIS      

15.1.    Europe Natural Sweeteners Market Overview by Country Segment

15.1.1. Europe Natural Sweeteners Market Revenue Share By Region

15.2.    Europe

15.2.1. Europe Natural Sweeteners Market Revenue By Country

15.2.2. Product Type

15.2.3. Europe Natural Sweeteners Market Revenue By Product Type

15.2.4. Application

15.2.5. Europe Natural Sweeteners Market Revenue By Application

15.2.6. Form

15.2.7. Europe Natural Sweeteners Market Revenue By Form

15.2.8.Nature

15.2.9. Europe Natural Sweeteners Market Revenue By Nature

15.2.10.           Sales Channel

15.2.11.           Europe Natural Sweeteners Market Revenue By Sales Channel

15.3.    UK

15.4.    France

15.5.    Germany

15.6.    Italy

15.7.    Spain

15.8.    Russia

15.9.   Rest of Europe

CHAPTER NO. 16 : ASIA PACIFIC NATURAL SWEETENERS MARKET – COUNTRY ANALYSIS

16.1.    Asia Pacific Natural Sweeteners Market Overview by Country Segment

16.1.1. Asia Pacific Natural Sweeteners Market Revenue Share By Region

16.2.    Asia Pacific

16.2.1. Asia Pacific Natural Sweeteners Market Revenue By Country

16.2.2. Product Type

16.2.3. Asia Pacific Natural Sweeteners Market Revenue By Product Type

16.2.4. Application

16.2.5. Asia Pacific Natural Sweeteners Market Revenue By Application

16.2.6. Form

16.2.7. Asia Pacific Natural Sweeteners Market Revenue By Form

16.2.8.Nature

16.2.9. Asia Pacific Natural Sweeteners Market Revenue By Nature

16.2.10.           Sales Channel

16.2.11.           Asia Pacific Natural Sweeteners Market Revenue By Sales Channel

16.3.    China

16.4.    Japan

16.5.    South Korea

16.6.    India

16.7.    Australia

16.8.    Southeast Asia

16.9.    Rest of Asia Pacific

CHAPTER NO. 17 : LATIN AMERICA NATURAL SWEETENERS MARKET – COUNTRY ANALYSIS

17.1.    Latin America Natural Sweeteners Market Overview by Country Segment

17.1.1. Latin America Natural Sweeteners Market Revenue Share By Region

17.2.    Latin America

17.2.1. Latin America Natural Sweeteners Market Revenue By Country

17.2.2. Product Type

17.2.3. Latin America Natural Sweeteners Market Revenue By Product Type

17.2.4. Application

17.2.5. Latin America Natural Sweeteners Market Revenue By Application

17.2.6. Form

17.2.7. Latin America Natural Sweeteners Market Revenue By Form

17.2.8.Nature

17.2.9. Latin America Natural Sweeteners Market Revenue By Nature

17.2.10.           Sales Channel

17.2.11.           Latin America Natural Sweeteners Market Revenue By Sales Channel

17.3.    Brazil

17.4.    Argentina

17.5.    Rest of Latin America

CHAPTER NO. 18 : MIDDLE EAST NATURAL SWEETENERS MARKET – COUNTRY ANALYSIS

18.1.    Middle East Natural Sweeteners Market Overview by Country Segment

18.1.1. Middle East Natural Sweeteners Market Revenue Share By Region

18.2.    Middle East

18.2.1. Middle East Natural Sweeteners Market Revenue By Country

18.2.2. Product Type

18.2.3. Middle East Natural Sweeteners Market Revenue By Product Type

18.2.4. Application

18.2.5. Middle East Natural Sweeteners Market Revenue By Application

18.2.6. Form

18.2.7. Middle East Natural Sweeteners Market Revenue By Form

18.2.8. Nature

18.2.9. Middle East Natural Sweeteners Market Revenue By Nature

18.2.10.           Sales Channel

18.2.11.           Middle East Natural Sweeteners Market Revenue By Sales Channel

18.3.    GCC Countries

18.4.    Israel

18.5.    Turkey

18.6.    Rest of Middle East

CHAPTER NO. 19 : AFRICA NATURAL SWEETENERS MARKET – COUNTRY ANALYSIS      

19.1.    Africa Natural Sweeteners Market Overview by Country Segment

19.1.1. Africa Natural Sweeteners Market Revenue Share By Region

19.2.    Africa

19.2.1. Africa Natural Sweeteners Market Revenue By Country

19.2.2. Product Type

19.2.3. Africa Natural Sweeteners Market Revenue By Product Type

19.2.4. Application

19.2.5. Africa Natural Sweeteners Market Revenue By Application

19.2.6. Form

19.2.7. Africa Natural Sweeteners Market Revenue By Form

19.2.8.Nature

19.2.9. Africa Natural Sweeteners Market Revenue By Nature

19.2.10.           Sales Channel

19.2.11.           Africa Natural Sweeteners Market Revenue By Sales Channel

19.3.    South Africa

19.4.    Egypt

19.5.    Rest of Africa

CHAPTER NO. 20 : COMPANY PROFILES     

20.1.    DuPont (US)

20.1.1. Company Overview

20.1.2. Product Portfolio

20.1.3. Financial Overview

20.1.4.Recent Developments

20.1.5. Growth Strategy

20.1.6. SWOT Analysis

20.2.    ADM (Archer Daniels Midland) (US)

20.3.    Tate & Lyle PLC (UK)

20.4.    Cargill (US)

20.5.    Ingredion Incorporated (US)

20.6.    Roquette Frères (France)

20.7.    FoodChem International Corporation (China)

20.8.    PureCircle Ltd (US)

20.9.    MacAndrews & Forbes Holdings Inc (Merisant) (US)

20.10.  Ecogreen Oleochemicals (Indonesia)

20.11.  Pyure Brands LLC (US)

20.12.  Stevia Hub India (India)

20.13.  Suminter India Organics (India)

20.14.  Stevia Biotech Pvt Ltd (India)

20.15.  The Real Stevia Company (Sweden)

20.16.  Sweetly Stevia USA (UK)

20.17.  XiliNat (Mexico)

20.18.  Fooditive B.V. (Netherlands)

20.19.  Saganà Association (Switzerland)

20.20.  Hearthside Food Solutions LLC (US)


Request Free Sample

We prioritize the confidentiality and security of your data. Our promise: your information remains private.

Ready to Transform Data into Decisions?

Request Your Sample Report and Start Your Journey of Informed Choices


Providing the strategic compass for industry titans.

cr-clients-logos

Frequently Asked Questions

What is the current market size for Natural Sweeteners, and what is its projected size in 2032?

The Natural Sweeteners Market was valued at USD 25,183.70 million in 2024 and is projected to reach USD 40,570.47 million by 2032, reflecting strong global demand across product categories.

At what Compound Annual Growth Rate is the Natural Sweeteners market projected to grow between 2025 and 2032?

The Natural Sweeteners Market is forecasted to grow at a CAGR of 6.26% during the period from 2024 to 2032, driven by increased adoption in clean-label food and beverage production

What are the primary factors fueling the growth of the Natural Sweeteners market?

The Natural Sweeteners Market grows due to rising health concerns, regulatory support, and demand for clean-label food and beverages.

Who are the leading companies in the Natural Sweeteners market?

Key companies in the Natural Sweeteners Market include Archer Daniels Midland Company, Cargill, PureCircle, and Madhava Natural Sweeteners.

Which region commanded the largest share of the Natural Sweeteners Market in 2024?

Asia Pacific held the largest share of the Natural Sweeteners Market in 2024, supported by high population density, rising disposable incomes, and expanding health-conscious consumer bases.

About Author

Rajdeep Kumar Deb

Rajdeep Kumar Deb

Lead Analyst – Consumer & Finance

Rajdeep brings a decade of consumer goods and financial services insight to strategic market analysis.

View Profile

Related Reports

Sponge and Scouring Pads Market

The Sponge and Scouring Pads Market size was valued at USD 2,679.29 million in 2024 and is anticipated to reach USD 3,752.27 million by 2032, growing at a CAGR of 4.3% during the forecast period.

Touchscreen Gloves Market

The Touchscreen Gloves Market size was valued at USD 1,489.6 million in 2024 and is anticipated to reach USD 2,860.93 million by 2032, growing at a CAGR of 8.5% during the forecast period.

Philippines Sponge and Scouring Pads Market

The Philippines Sponge and Scouring Pads Market size was valued at USD 96.35 million in 2018 and increased to USD 139.19 million in 2024. The market is anticipated to reach USD 225.57 million by 2032.

Global and Europe Football Club Merchandising Market

The Global and Europe Football Club Merchandising Market size was valued at USD 12,611.00 million in 2018 to USD 18,696.13 million in 2024 and is anticipated to reach USD 31,507.89 million by 2032, at a CAGR of 6.28% during the forecast period.

Africa Fat Filled Milk Powders (FFMP) Market

The Africa Fat Filled Milk Powders (FFMP) Market size was valued at USD 864.05 million in 2018 to USD 1,298.31 million in 2024. The market is anticipated to reach USD 2,233.71 million by 2032. The market is projected to expand at a CAGR of 6.53% during the forecast period.

Africa Beauty and Personal Care Market

The Africa Beauty & Personal Care Market size was valued at USD 7,100.00 million in 2018 to USD 8,860.27 million in 2024 and is anticipated to reach USD 15,709.85 million by 2032, at a CAGR of 7.52% during the forecast period.

U.S. Footwear Market

The U.S. Footwear Market size was valued at USD 69.53 billion in 2018 to USD 95.23 billion in 2024 and is anticipated to reach USD 142.77 billion by 2032, at a CAGR of 4.83% during the forecast period.

Potato Fiber Market

The Potato Fiber Market is projected to grow from USD 504.21 million in 2024 to an estimated USD 722.54 million by 2032, with a CAGR of 4.6% from 2024 to 2032.

Topical Pet Sprays Market

Topical Pet Sprays Market size was valued at USD 864.5 million in 2024 and is anticipated to reach USD 1,296.85 million by 2032, growing at a CAGR of 5.2% during the forecast period.

Toilet Bowl Cleaner Tablets Market

Toilet Bowl Cleaner Tablets Market size was valued at USD 1,379.79 million in 2024 and is anticipated to reach USD 1,720.91 million by 2032, at a CAGR of 2.8% during the forecast period.

Toilet Bowl Brush Market

The Toilet Bowl Brush Market size was valued at USD 7,589.6 million in 2024 and is anticipated to reach USD 11,230.39 million by 2032, growing at a CAGR of 5.02% during the forecast period.

Toddler Wear Market

Toddler Wear Market size was valued at USD 266,369.6 million in 2024 and is anticipated to reach USD 424,552.67 million by 2032, at a CAGR of 6% during the forecast period.

Licence Option

The report comes as a view-only PDF document, optimized for individual clients. This version is recommended for personal digital use and does not allow printing. Use restricted to one purchaser only.
$4999

To meet the needs of modern corporate teams, our report comes in two formats: a printable PDF and a data-rich Excel sheet. This package is optimized for internal analysis. Unlimited users allowed within one corporate location (e.g., regional office).
$6999

The report will be delivered in printable PDF format along with the report’s data Excel sheet. This license offers 100 Free Analyst hours where the client can utilize Credence Research Inc. research team. Permitted for unlimited global use by all users within the purchasing corporation, such as all employees of a single company.
$12999

Report delivery within 24 to 48 hours

Europe

North America

Email

Smallform of Sample request
User Review

Thank you for the data! The numbers are exactly what we asked for and what we need to build our business case.

Materials Scientist
(privacy requested)

User Review

The report was an excellent overview of the Industrial Burners market. This report does a great job of breaking everything down into manageable chunks.

Imre Hof
Management Assistant, Bekaert

cr-clients-logos

Request Sample