Home » Healthcare » Pharmaceuticals » Nootropics Market

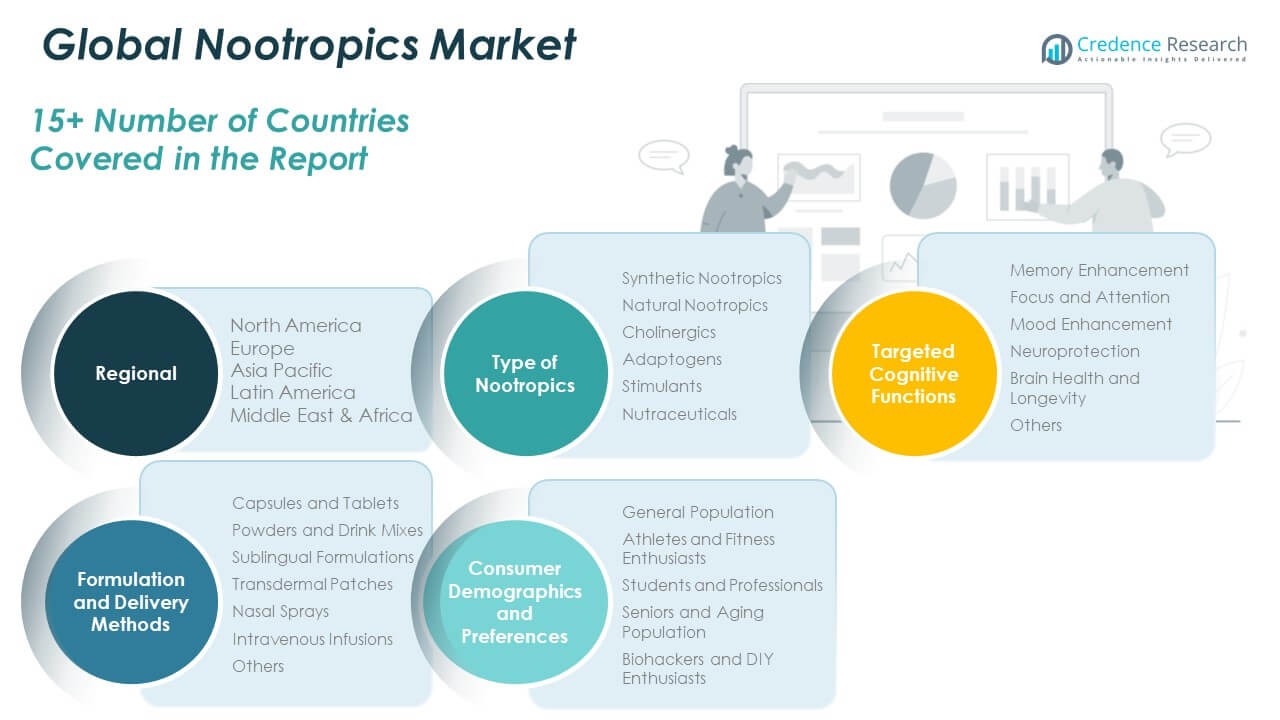
Nootropics Market By Type of Nootropics (Synthetic Nootropics, Natural Nootropics, Cholinergics, Adaptogens, Stimulants, Nutraceuticals); By Targeted Cognitive Functions (Memory Enhancement, Focus and Attention, Mood Enhancement, Neuroprotection, Brain Health and Longevity); By Formulation and Delivery Methods (Capsules and Tablets, Powders and Drink Mixes, Sublingual Formulations, Transdermal Patches, Nasal Sprays, Intravenous Infusions); By Consumer Demographics and Preferences (General Population, Athletes and Fitness Enthusiasts, Students and Professionals, Seniors and Aging Population, Biohackers and DIY Enthusiasts) – Growth, Share, Opportunities & Competitive Analysis, 2024 – 2032

Price: $3699

Published: | Report ID: 14433 | Report Format : PDF
REPORT ATTRIBUTE DETAILS
Historical Period  2019-2022
Base Year  2023
Forecast Period  2024-2032
Nootropics Market Size 2023  USD 3951.2 Million
Nootropics Market, CAGR  15.00%
Nootropics Market Size 2032  USD 13899.8 Million

Market Insights

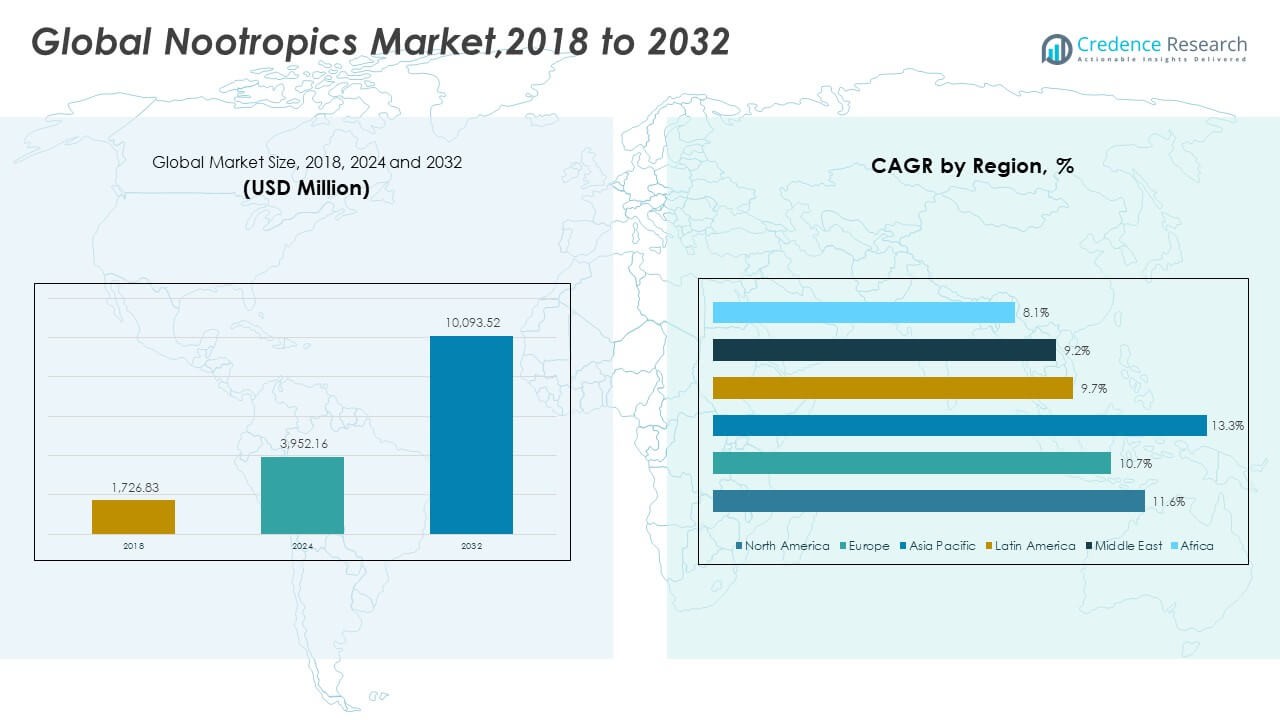
  • The global Nootropics Market reached a valuation of USD 3951.2 Million in 2023 and is anticipated to surge to USD 13899.8 Million by 2032, exhibiting a robust CAGR of 15.00% from 2024 to 2032.
  • Among the key segments, Synthetic Nootropics held the largest market share, accounting for approximately 45-50% of the total market in 2023. However, Adaptogens are projected to experience the highest growth rate during the forecast period.
  • Memory Enhancement leads the market by targeted cognitive functions, capturing around 30-32% of the market share in 2023, fueled by the increasing demand from students and professionals seeking cognitive enhancement.
  • Capsules and Tablets currently dominate the market by formulation and delivery methods, holding approximately 40-45% of the market share in 2023, due to their convenience and ease of consumption.
  • General Population constitutes the largest segment by consumer demographics and preferences, accounting for about 40-45% of the market share in 2023, driven by the availability of a wide variety of nootropic brands and competitive pricing options.
  • North America emerged as the leading region in the market in 2023, followed by Asia Pacific and Europe, collectively accounting for just under 55% of the market share.
  • The growing awareness and demand for cognitive enhancement, coupled with advancements in neurological and pharmaceutical research, are driving the expansion of the Nootropics Market.
  • Key opportunities in the market include the increasing demand for natural and sustainable products, expanding research in mental health, growing interest in new natural and medicinal products, and technological advancements in manufacturing processes, promoting market growth.

Nootropics Market

Executive Summary

Market Definition

Nootropics, also known as “smart drugs” or cognitive enhancers, are substances that are believed to improve aspects of cognitive function such as memory, creativity, motivation and concentration nootropics market identifies services that provide and is involved in the manufacture, distribution and sale of these products. There is a significant improvement in the output for potential grain yield and fertilizer potential in the output with inputs increasing through the commodities. Increased irritability, stress among professionals and stress. and a greater need for performance enhancing agents. Nootropic products come in a variety of forms including tablets, powders, capsules, drinks and energy bars. Some popular natural nootropics include caffeine, L-theanine, Ginkgo biloba, Bacopa monnieri, and Panax ginseng while alternatives such as modafinil, pyracetam and adrafinil are also widely used.

Design Element 2

Access crucial information at unmatched prices!

Request your free sample report today & start making informed decisions powered by Credence Research!

Download Free Sample

CTA Design Element 3

Market Overview

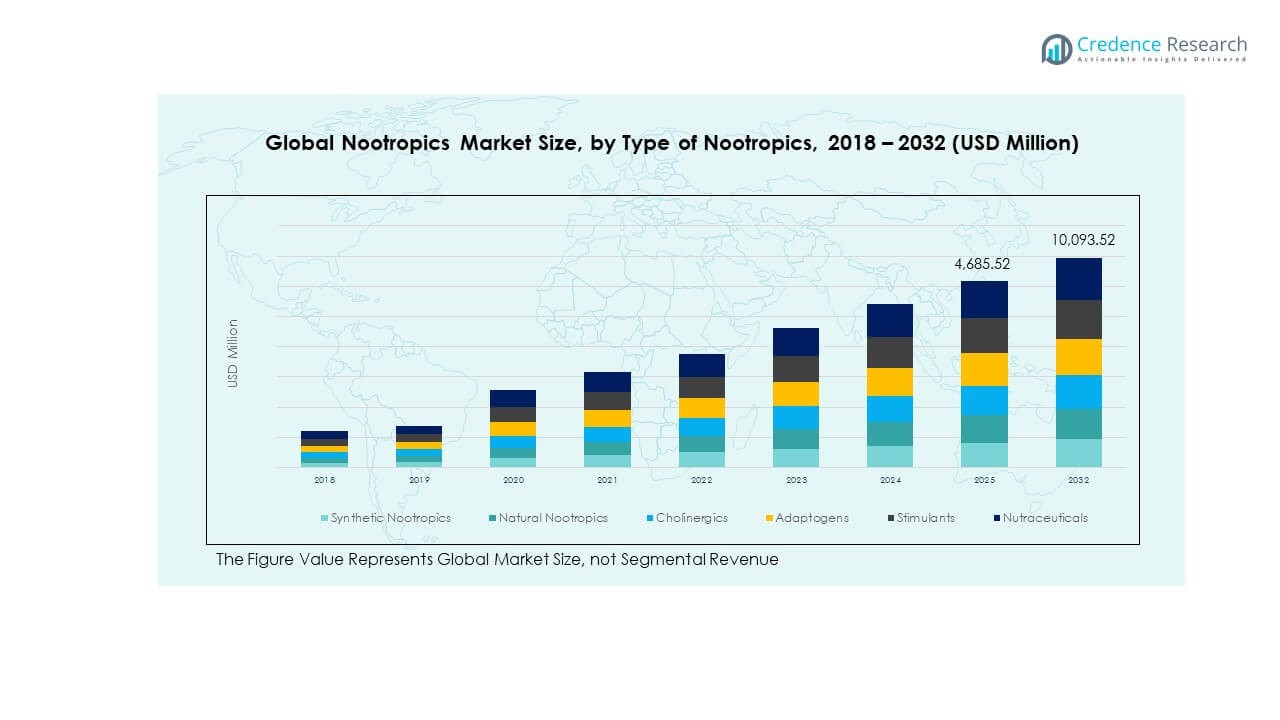
The Nootropics Market has demonstrated consistent expansion and is projected to maintain a robust CAGR of 15.00% from 2024 to 2032. Valued at USD 3951.2 million in 2023, this market is expected to reach USD 13899.8 million by 2032.

Among the key segments, Synthetic Nootropics held the largest market share, accounting for approximately 45-50% of the total market in 2023. However, Adaptogens are anticipated to experience the highest CAGR over the forecast period.

Memory Enhancement emerged as the leading targeted cognitive function segment in 2023, with a market share of about 30-32%, driven by the demand from students and professionals seeking to improve memory and cognitive performance.

Capsules and Tablets emerged as the leading targeted cognitive function segment in 2023, with a market share of about  40-45%, driven by due to their convenience and ease of consumption.

General Population emerged as the leading targeted cognitive function segment in 2023, with a market share of about 40-45%, driven by the availability of a wide variety of nootropic brands and competitive pricing options.

North America constituted the largest portion of the market in 2023, followed by Asia Pacific and Europe, collectively representing just under 55% of the market share.

The growth in the Nootropics Market is fueled by factors such as increasing consumer awareness and demand for cognitive enhancement, advancements in neurological and pharmaceutical research, and the expanding applications of nootropics across various industries.

Continuous advancements in cultivation, formulation, and delivery technologies, including improved extraction methods, are further driving the demand for nootropics, especially in industries requiring high-quality and innovative products.

Segmentation by Type of Nootropics

  • Synthetic Nootropics currently hold the largest market share approx 45-50% in 2023. The high demand for drugs to treat mood disorders is contributing this great result. Furthermore, the widespread adoption of these products by students, professionals and athletes drives this dominance.
  • Adaptogens is projected to witness the highest CAGR during the forecast period due to increasing psychiatric awareness and holistic approaches to cognitive enhancement.

Segmentation by Targeted Cognitive Functions

  • Memory Enhancement currently hold the largest market share approx 30-32% in 2023. Students and professionals who seek to preserve so well and remembered is very helpful for the users further drive the market.
  • Neuroprotection is projected to witness the highest CAGR during the forecast period owing to uses for damage caused by oxidative stress, inflammation, excitotoxicity, and environmental pollution.

Segmentation by Formulation and Delivery Methods

  • Capsules and Tablets currently hold the largest market share approx 40-45% in 2023 owing to convenient, portable, and easy to consume,
  • Transdermal Patches is projected to witness the highest CAGR during the forecast period. Using the skin as an alternative route for drug delivery, transdermal patches deliver controlled amounts of nootropic drugs directly into the systemic delivery, ensuring prolonged release.

Segmentation by Consumer Demographics and Preferences

  • General Population currently hold the largest market share approx 40-45% in 2023. The wide variety of nootropic brands available, both online and offline, combined with competitive pricing options make mood enhancement accessible to a large audience. Additionally, many manufacturers emphasize developing cost-effective start-up products, facilitating trial participation, and improving loyalty among beginner.
  • Biohackers and DIY Enthusiasts is projected to witness the highest CAGR during the forecast period. Enthusiasts about itself through their own experimentation, tinkering spirit and relentless pursuit of the utmost human performance drive the market.

Segmentation by Region

  • North America held significant share around 32-35% of the market in 2023. This dominance is primarily due to established regulatory framework, advanced design and a growing economy. Extensive research funding in this area, sophisticated distribution channels, mood enhancing factors drive the North America nootropics market.
  • Asia Pacific and Europe collectively account for just under 55% share in 2023, with Europe holding over 20% share in the same year.
  • The rest of the world, including Latin America, the Middle East, and Africa, supplies the remaining demand for Nootropics.

Regulatory framework governing food supplements, cutting-edge biotechnological industries, and growing e-commerce channels are the major factors driving the market growth.

The North America region held the largest market share of the Nootropics market can be attributed to several factors. The potential value of nootropics among consumers in this area is growing. Many individuals, especially students and professionals, are turning to nootropics to meet the demands of their busy lives and enhance their cognitive performance. Moreover, there is a very popular nutritional industry in the North American region, which includes nootropic supplements. As a result, many companies in America North enters the nootropics market, offering a wide range of products to cater to different needs and preferences. For instance, in April 2024, Pressed Juicery introduced a new line of Nootropics coffees, lattes, and matcha drinks powered by nootropics to boost energy and brain function naturally. These ready-to-drink functional beverages are made with clean ingredients and are designed to revolutionize your morning routine. However, there is significant research on nootropics in North America. Universities, hospitals and private companies are putting resources into studying the effects of nootropics on various aspects of cognition including attention, memory and executive function. This research not only helps to understand how nootropics work but helps to achieve them trust and confidence in the market. Additionally, the growth of e-commerce has boosted the nootropics market in North America. Online storefronts make it easy for consumers to find information about nootropics, compare prices and brands, and shop from the comfort of their home.

The Asia-Pacific is hold prominent share in the Nootropics Market. A key factor contributing to the growth of the nootropics market in this region is the increasing awareness of mental health and the need to improve cognitive functioning including increasing levels of stress, anxiety and sleep disorders in the population. Another reason for the popularity of the nootropics market in the Asia-Pacific region is the growing dietary supplement industry. Countries like China, Japan, India, South Korea and Singapore are seeing increased demand for nutritional supplements due to changing lifestyles, urbanization and increasing disposable income. For instance, in April 2024, Olly, a US-based vitamin brand, has launched a line of brain-boosting supplements in Singapore, targeting millennials with its gummy vitamin supplements. The launch includes nine products, including Goodbye Stress, Sleep, Glowing Skin, Undeniable Beauty, Daily Energy, Probiotic + Prebiotic, The Perfect Women’s Multi, The Perfect Men’s Multi, and Kids Multi+Omega-3. The brand aims to attract millennials by marketing its supplements based on their benefits rather than their ingredients. Additionally, the Asia-Pacific region has a wide range of traditional herbs and plants with nootropic properties. For instance, ginseng, bakopa monneeri, ashwagandha and gotukola are widely used in Ayurvedic medicine and Traditional Chinese Medicine (TCM) to treat various neurological disorders Using this rich heritage, local production the products are introducing new nootropic formulations that combine ancient wisdom with modern science further contribute to the market growth.

Key Highlights of the Report

The Nootropics Market is segmented by Type of Nootropics, Targeted Cognitive Functions, Formulation and Delivery Methods, Consumer Demographics and Preferences, and Region. The increasing demand for nootropics is driven by factors such as growing consumer awareness of cognitive enhancement, advancements in neurological and pharmaceutical research, and the need for performance-enhancing agents across sectors including healthcare, education, and professional settings.

Synthetic Nootropics dominate the segment, playing crucial roles in various applications such as mood enhancement, memory improvement, and neuroprotection due to their potent cognitive effects.

Memory Enhancement leads the targeted cognitive functions segment, offering effective solutions for students and professionals seeking to improve memory, focus, and cognitive performance.

The biohackers and DIY enthusiasts consumer segment is witnessing rapid growth, driven by individuals experimenting with nootropics to achieve optimal cognitive performance.

North America held the largest share of the Nootropics market, supported by advanced research facilities, a well-established regulatory framework, and a growing demand for cognitive enhancement solutions. Key players such as Gaia Herbs, Mind Lab Pro, and Onnit Labs focus on product innovation, strategic partnerships, and collaborations to maintain their market position and competitiveness.

Shape Your Report to Specific Countries or Regions & Enjoy 30% Off!

What Are The Main Drivers Of The Global Nootropics Market?

Global Nootropics Market is primarily driven by increasing consumer awareness and demand for cognitive enhancement, increasing mental health, advancements in neurological and pharmaceutical research. Besides, growing aging population rising for cognitive support and lifestyle changes emphasizing productivity and mental agility also fuel market growth , and availability of nootropic products through online platforms and marketing channels futher drive the market.

What Are The Major Challenges Faced By The Global Nootropics Market?

The global Nootropics market faces challenges such as regulatory uncertainties related to nootropics safety concerns, potential side effects and long-term effects affecting consumer perceptions and the distribution of adoption rates and consent is included. Furthermore, lack of comprehensive research and standardized testing protocols for nootropic products raise uncertainty and hamper market growth.

What Are The Growth Opportunities In The Global Nootropics Market?

The global nootropics market presents growth opportunities driven by increasing consumer demand for natural and sustainable products, expanding research in mental health, increasing consumer interest in new natural and medicinal products, and technological advancements in manufacturing processe. Furthermore, strategic partnerships and collaboration among nootropics suppliers, manufacturers and retailers can facilitate the market flow. The use of digital marketing channels and an emphasis on product transparency and traceability also increase opportunities for market growth.

Market Drivers

The global Nootropics market is driven by several factors. The following are the key drivers of the global Nootropics market:

Growing Aging Population

Growing aging population is driving the nootropics market due to age-related cognitive decline and rise in neurological diseases. As people age, they may experience memory loss, decreased cognitive abilities, and reduced mental sharpness, leading to an increased demand for nootropic supplements that promise to enhance cognitive function and slow down the aging process. For instance, according to the World bank, between 2015 and 2050, the proportion of the world’s population over 60 years will nearly double from 12% to 22%. Thus, nootropics offer a promising solution for maintaining mental health and improving the overall quality of life of the elderly. Consequently, the demand for nootropics is expected to rise sharply in the coming years due to the expanding elderly population and the growing need for cognitive enhancement.

Market Restraints

The global Nootropics market faces some challenges that may hinder its growth. These include the following:

Regulatory Uncertainties Related To Nootropics Safety Concerns

The Nootropics market faces challenges from regulatory uncertainties related to nootropics safety concerns. The lack of clear regulations on nootropics allows some manufacturers to cut corners on product safety and effectiveness, potentially putting consumers at risk.  Also, because nootropics are often considered food they are added rather than drugs so there is no rigorous testing and clinical trials as to whether they are that safe and effective for their intended use. However, some nootropics can interact adversely with prescription medications, aggravate pre-existing medical conditions, or cause side effects when taken in excess.  If supplyments not labeled properly and without warning, consumers may be unaware of these risks, leading to potential harm. Regulators must strike a balance while ensuring consumer protection and allowing for innovation and growth in the nootropics market.

Opportunities

The global Nootropics market offers significant growth opportunities. These include the following:

Adoption Of Various Strategies Among Market Players

Adoption of various strategies among market players creates significant opportunity for the market. The major companies serving the global Nootropics Market are Gaia Herbs, Givaudan Active Beauty, Mental Mojo, Mind Lab Pro, Neu Drinks, among others. The market players are considerably contributing to the market growth by the adoption of various strategies including mergers & acquisitions, collaborations, funding, and new product launches, to stay competitive in the market. For instance, in September 2021, Givaudan Active Beauty launched Nootropics, a collection of six natural and traceable extracts featuring Guarana, Ginger, Green Tea, Gotu Kola, Ginkgo, and Green Coffee. These ingredients are known for their functions as food supplements and their cosmetic properties, offering benefits such as soothing, purifying, moisturizing, and well-ageing.

Competitive Landscape

Key Players

The global Nootropics market is highly competitive, with several key players. Some of the major players in the market and their market share are as follows:

  • Gaia Herbs
  • Kimera Koffee
  • Mental Mojo
  • Mind Lab Pro
  • Neu Drinks
  • NooCube
  • Onnit Labs
  • Peak Nootropics
  • Purelife Bioscience
  • Reckitt Benckiser
  • SupNootropic
  • Teva Pharmaceutical
  • TruBrain
  • United Pharmacies
  • Zhou Nutrition
  • Others

These organizations prioritize product innovation, distribution channel expansion, and mergers and acquisitions to stay competitive.

The global Nootropics market’s key players continually seek to stay ahead by offering new products and developments.

In April 2024, Roots Focus launched a new line of nootropic supplements that combines caffeine with functional mushrooms to promote brain health and heighten energy. The supplements are part of Roots’ mind, body, and mood lifestyle brand. Nootropics are substances that are known to improve cognitive functions, and they are becoming increasingly popular among consumers who are looking for natural solutions for their skin and a “feel good” appearance.

In January 2024, KIMERA KOFFEE Launched in Qatar. Jaqar International Trading partnered with Kimera Koffee, now the exclusive distributor of Kimera’s organic, nootropic-infused artisan coffee in Qatar. More than just coffee, Kimera combines premium high-altitude beans with brain-boosting vitamins to enhance both mental acuity and physical prowess.

Summary of Key Findings

  • The Nootropics Market is witnessing significant growth, driven by the increasing demand for cognitive enhancement solutions across various sectors including healthcare, education, and professional settings. Key drivers fueling this growth include growing consumer awareness of the benefits of nootropics, advancements in neurological and pharmaceutical research, and the pursuit of improved cognitive performance.
  • Market segmentation within the Nootropics Market encompasses factors such as type of nootropics, targeted cognitive functions, formulation and delivery methods, consumer demographics and preferences, and region, reflecting the diverse uses and applications of nootropics.
  • Synthetic Nootropics dominate the market, holding the majority market share due to their potent cognitive effects and widespread applications in mood enhancement, memory improvement, and neuroprotection. Natural Nootropics and Adaptogens also contribute significantly to the market, particularly in industries like healthcare and wellness.
  • Biohackers and DIY Enthusiasts and Students and Professionals are witnessing substantial growth, driven by the increasing interest in self-improvement and cognitive enhancement.
  • Geographically, North America holds the largest market share, supported by advanced research facilities, a well-established regulatory framework, and a growing demand for cognitive enhancement solutions. Asia Pacific and Europe collectively account for a significant share of the market, with Asia Pacific witnessing growth due to increasing awareness of cognitive health and wellness.

Future Outlook

  • The future outlook for the Nootropics Market indicates promising growth opportunities, particularly within sectors such as healthcare, education, and wellness, driven by the increasing demand for cognitive enhancement solutions. However, anticipated challenges include regulatory uncertainties, safety concerns, potential side effects, and competition from other cognitive enhancement products.
  • To maintain competitiveness in the Nootropics Market, industry players should adopt various strategies such as continuous product innovation, strategic collaborations, securing investments for research and development, and expanding market reach. It is crucial for companies to prioritize addressing safety concerns, improving product efficacy, and exploring new applications in emerging markets to ensure sustained growth amidst evolving industry dynamics.

How CXOs Can Benefit from the Credence Research Nootropics Market Report

The Credence Research Nootropics Market Report provides CXOs with a comprehensive overview of the market, including:

  • Market size and growth forecast: The report provides detailed estimates of the global Nootropics market size, segmented by type of nootropics, targeted cognitive functions, formulation and delivery methods, consumer demographics and preferences, and region. It also includes forecasts for the market through 2032, based on key trends and drivers.
  • Market segmentation: The report segments the Nootropics market by type of nootropics, targeted cognitive functions, formulation and delivery methods, consumer demographics and preferences, and region. The increasing demand for advanced solutions is driven. This segmentation provides CXOs with a granular understanding of the market and the opportunities in each segment.
  • Competitive landscape: The report profiles the key players in the Nootropics market and provides insights into their strategies, product offerings, and financial performance. This information can help CXOs to identify and assess their competition.
  • Key trends and drivers: The report identifies and analyzes the key trends and drivers that are shaping the Nootropics market. This information can help CXOs to make informed decisions about their investments and strategies.

CXOs can use the insights from the Credence Research Nootropics Market Report to:

  • Identify growth opportunities: The report can help CXOs to identify new growth opportunities in the Nootropics market. For example, the report identifies the growing demand for Nootropics from cloud computing providers and telecom companies as a key opportunity.
  • Make informed investment decisions: The report can help CXOs to make informed investment decisions about Nootropics. For example, the report provides insights into the key factors to consider when evaluating Nootropics providers and selecting Nootropics solutions.
  • Develop competitive strategies: The report can help CXOs to develop competitive strategies for their Nootropics networks businesses. For example, the report identifies the key strategies that Nootropics providers are using to differentiate themselves from their competitors.
  • Track market developments: The report can help CXOs to track market developments and stay ahead of the curve. For example, the report provides insights into the latest trends and innovations in the Nootropics market.

Overall, the Credence Research Nootropics Market Report is a valuable resource for CXOs who are looking to gain a deeper understanding of the market and identify opportunities for growth.

Segmentation

  • By Type of Nootropics:
    • Synthetic Nootropics
    • Natural Nootropics
    • Cholinergics
    • Adaptogens
    • Stimulants
    • Nutraceuticals
  • By Targeted Cognitive Functions:
    • Memory Enhancement
    • Focus and Attention
    • Mood Enhancement
    • Neuroprotection
    • Brain Health and Longevity
  • By Formulation and Delivery Methods:
    • Capsules and Tablets
    • Powders and Drink Mixes
    • Sublingual Formulations
    • Transdermal Patches
    • Nasal Sprays
    • Intravenous Infusions
  • By Consumer Demographics and Preferences:
    • General Population
    • Athletes and Fitness Enthusiasts
    • Students and Professionals
    • Seniors and Aging Population
    • Biohackers and DIY Enthusiasts
  • By Region
    • North America
      • The U.S.
      • Canada
      • Mexico
    • Europe
      • Germany
      • France
      • The U.K.
      • Italy
      • Spain
      • Rest of Europe
    • Asia Pacific
      • China
      • Japan
      • India
      • South Korea
      • South-east Asia
      • Rest of Asia Pacific
    • Latin America
      • Brazil
      • Argentina
      • Rest of Latin America
    • Middle East & Africa
      • GCC Countries
      • South Africa
      • Rest of Middle East and Africa

Adjacent Markets

In the Nootropics market, there are several adjacent markets which has high revenue growth opportunities. The key adjacent markets for Nootropics market –

                                                        Adjacent Markets

Nutraceuticals Brain Health Supplements Biohacking Tools
Functional Foods Energy Drinks Mental Wellness Services
Dietary Supplements Cognitive Health Apps Neurotechnology Devices

Table of Content
1. Preface
1.1. Report Description
1.1.1. Purpose of the Report
1.1.2. Target Audience
1.1.3. USP and Key Offerings
1.2. Research Scope
1.3. Market Introduction
2. Executive Summary
2.1. Market Snapshot: Global Nootropics Market
2.1.1. Global Nootropics Market, By Type of Nootropics
2.1.2. Global Nootropics Market, By Targeted Cognitive Functions
2.1.3. Global Nootropics Market, By Formulation and Delivery Methods
2.1.4. Global Nootropics Market, By Consumer Demographics and Preferences
2.1.5. Global Nootropics Market, By Region
2.2. Insights from Primary Respondents
3. Market Dynamics & Factors Analysis
3.1. Introduction
3.1.1. Global Nootropics Market Value, 2019-2032, (US$ Mn)
3.1.2. Y-o-Y Growth Trend Analysis
3.2. Market Dynamics
3.2.1. Nootropics Market Drivers
3.2.2. Nootropics Market Restraints
3.2.3. Nootropics Market Opportunities
3.2.4. Major Nootropics Industry Challenges
3.3. Growth and Development Patterns
3.4. Investment Feasibility Analysis
3.5. Market Opportunity Analysis
3.5.1. Type of Nootropics
3.5.2. Targeted Cognitive Functions
3.5.3. Formulation and Delivery Methods
3.5.4. Consumer Demographics and Preferences
3.5.5. Geography
4. Market Competitive Landscape Analysis
4.1. Company Market Share Analysis, 2023
4.1.1. Global Nootropics Market: Company Market Share, Value 2023
4.1.2. Global Nootropics Market: Top 6 Company Market Share, Value 2023
4.1.3. Global Nootropics Market: Top 3 Company Market Share, Value 2023
4.2. Global Nootropics Market: Company Revenue Share Analysis, 2023
4.3. Company Assessment Metrics, 2023
4.3.1. Stars
4.3.2. Emerging Leaders
4.3.3. Pervasive Players
4.3.4. Participants
4.4. Startups/ SMEs Assessment Metrics, 2023
4.4.1. Progressive Companies
4.4.2. Responsive Companies
4.4.3. Dynamic Companies
4.4.4. Starting Blocks
4.5. Strategic Development
4.5.1. Acquisition and Mergers
4.5.2. New Product Launch
4.5.3. Regional Expansion
4.5.4. Partnerships
4.6. Key Player Product Matrix
4.7. Potential for New Players in the Global Nootropics Market
5. Premium Insights
5.1. STAR (Situation, Task, Action, Results) Analysis
5.2. Porter’s Five Forces Analysis
5.2.1. Threat of New Entrants
5.2.2. Bargaining Power of Buyers/Consumers
5.2.3. Bargaining Power of Suppliers
5.2.4. Threat of Substitute Types
5.2.5. Intensity of Competitive Rivalry
5.3. PESTEL Analysis
5.3.1. Political Factors
5.3.2. Economic Factors
5.3.3. Social Factors
5.3.4. Technological Factors
5.3.5. Environmental Factors
5.3.6. Legal Factors
5.4. Key Market Trends
5.4.1. Demand Side Trends
5.4.2. Supply Side Trends
5.5. Value Chain Analysis
5.6. Technology Analysis
5.6.1. Research and development in the global market
5.6.2. Patent Analysis
5.6.3. Emerging technologies and their potential disruption to the market
5.7. Consumer Behaviour Analysis
5.7.1. Consumer Preferences and Expectations
5.7.2. Factors Influencing Consumer Buying Decisions
5.7.2.1. North America
5.7.2.2. Europe
5.7.2.3. Asia Pacific
5.7.2.4. Latin America
5.7.2.5. Middle East and Africa
5.7.3. Consumer Pain Points
5.8. Analysis and Recommendations
5.9. Adjacent Market Analysis
6. Market Positioning of Key Players, 2023
6.1. Company market share of key players, 2023
6.2. Competitive Benchmarking
6.3. Market Positioning of Key Vendors
6.4. Geographical Presence Analysis
6.5. Major Strategies Adopted by Key Players
6.5.1. Key Strategies Analysis
6.5.2. Mergers and Acquisitions
6.5.3. Partnerships
6.5.4. Product Launch
6.5.5. Geographical Expansion
6.5.6. Others
7. Impact Analysis of COVID 19 and Russia – Ukraine War on Nootropics Market
7.1. Ukraine-Russia War Impact
7.1.1. Uncertainty and Economic Instability
7.1.2. Supply chain disruptions
7.1.3. Regional market shifts
7.1.4. Shift in government priorities
7.2. COVID-19 Impact Analysis
7.2.1. Supply Chain Disruptions
7.2.2. Demand Fluctuations
7.2.3. Shift in Product Mix
7.2.4. Reduced Industrial Activity
7.2.5. Regional Impact Analysis
7.2.5.1. North America
7.2.5.2. Europe
7.2.5.3. Asia Pacific
7.2.5.4. Latin America
7.2.5.5. Middle East and Africa
8. Global Nootropics Market, By Type of Nootropics
8.1. Global Nootropics Market Overview, by Type of Nootropics
8.1.1. Global Nootropics Market Revenue Share, By Type of Nootropics, 2023 Vs 2032 (in %)
8.2. Synthetic Nootropics
8.2.1. Global Nootropics Market, By Synthetic Nootropics, By Region, 2019-2032(US$ Mn)
8.2.2. Market Dynamics for Synthetic Nootropics
8.2.2.1. Drivers
8.2.2.2. Restraints
8.2.2.3. Opportunities
8.2.2.4. Trends
8.3. Natural Nootropics
8.3.1. Global Nootropics Market, By Natural Nootropics, By Region, 2019-2032 (US$ Mn)
8.3.2. Market Dynamics for Natural Nootropics
8.3.2.1. Drivers
8.3.2.2. Restraints
8.3.2.3. Opportunities
8.3.2.4. Trends
8.4. Cholinergics
8.4.1. Global Nootropics Market, By Cholinergics, By Region, 2019-2032 (US$ Mn)
8.4.2. Market Dynamics for Cholinergics
8.4.2.1. Drivers
8.4.2.2. Restraints
8.4.2.3. Opportunities
8.4.2.4. Trends
8.5. Adaptogens
8.5.1. Global Nootropics Market, By Adaptogens, By Region, 2019-2032 (US$ Mn)
8.5.2. Market Dynamics for Adaptogens
8.5.2.1. Drivers
8.5.2.2. Restraints
8.5.2.3. Opportunities
8.5.2.4. Trends
8.6. Stimulants
8.6.1. Global Nootropics Market, By Stimulants, By Region, 2019-2032 (US$ Mn)
8.6.2. Market Dynamics for Stimulants
8.6.2.1. Drivers
8.6.2.2. Restraints
8.6.2.3. Opportunities
8.6.2.4. Trends
8.7. Nutraceuticals
8.7.1. Global Nootropics Market, By Nutraceuticals, By Region, 2019-2032 (US$ Mn)
8.7.2. Market Dynamics for Nutraceuticals
8.7.2.1. Drivers
8.7.2.2. Restraints
8.7.2.3. Opportunities
8.7.2.4. Trends
9. Global Nootropics Market, By Targeted Cognitive Functions
9.1. Global Nootropics Market Overview, by Targeted Cognitive Functions
9.1.1. Global Nootropics Market Revenue Share, By Targeted Cognitive Functions, 2023 Vs 2032 (in %)
9.2. Memory Enhancement
9.2.1. Global Nootropics Market, By Memory Enhancement, By Region, 2019-2032 (US$ Mn)
9.2.2. Market Dynamics for Memory Enhancement
9.2.2.1. Drivers
9.2.2.2. Restraints
9.2.2.3. Opportunities
9.2.2.4. Trends
9.3. Focus and Attention
9.3.1. Global Nootropics Market, By Focus and Attention, By Region, 2019-2032 (US$ Mn)
9.3.2. Market Dynamics for Focus and Attention
9.3.2.1. Drivers
9.3.2.2. Restraints
9.3.2.3. Opportunities
9.3.2.4. Trends
9.4. Mood Enhancement
9.4.1. Global Nootropics Market, By Mood Enhancement, By Region, 2019-2032 (US$ Mn)
9.4.2. Market Dynamics for Mood Enhancement
9.4.2.1. Drivers
9.4.2.2. Restraints
9.4.2.3. Opportunities
9.4.2.4. Trends
9.5. Neuroprotection
9.5.1. Global Nootropics Market, By Neuroprotection, By Region, 2019-2032 (US$ Mn)
9.5.2. Market Dynamics for Neuroprotection
9.5.2.1. Drivers
9.5.2.2. Restraints
9.5.2.3. Opportunities
9.5.2.4. Trends
9.6. Brain Health and Longevity
9.6.1. Global Nootropics Market, By Brain Health and Longevity, By Region, 2019-2032 (US$ Mn)
9.6.2. Market Dynamics for Brain Health and Longevity
9.6.2.1. Drivers
9.6.2.2. Restraints
9.6.2.3. Opportunities
9.6.2.4. Trends
10. Global Nootropics Market, By Formulation and Delivery Methods
10.1. Global Nootropics Market Overview, by Formulation and Delivery Methods
10.1.1. Global Nootropics Market Revenue Share, By Formulation and Delivery Methods, 2023 Vs 2032 (in %)
10.2. Capsules and Tablets
10.2.1. Global Nootropics Market, By Capsules and Tablets, By Region, 2019-2032 (US$ Mn)
10.2.2. Market Dynamics for Capsules and Tablets
10.2.2.1. Drivers
10.2.2.2. Restraints
10.2.2.3. Opportunities
10.2.2.4. Trends
10.3. Powders and Drink Mixes
10.3.1. Global Nootropics Market, By Powders and Drink Mixes, By Region, 2019-2032 (US$ Mn)
10.3.2. Market Dynamics for Powders and Drink Mixes
10.3.2.1. Drivers
10.3.2.2. Restraints
10.3.2.3. Opportunities
10.3.2.4. Trends
10.4. Sublingual Formulations
10.4.1. Global Nootropics Market, By Sublingual Formulations, By Region, 2019-2032 (US$ Mn)
10.4.2. Market Dynamics for Sublingual Formulations
10.4.2.1. Drivers
10.4.2.2. Restraints
10.4.2.3. Opportunities
10.4.2.4. Trends
10.5. Transdermal Patches
10.5.1. Global Nootropics Market, By Transdermal Patches, By Region, 2019-2032 (US$ Mn)
10.5.2. Market Dynamics for Transdermal Patches
10.5.2.1. Drivers
10.5.2.2. Restraints
10.5.2.3. Opportunities
10.5.2.4. Trends
10.6. Nasal Sprays
10.6.1. Global Nootropics Market, By Nasal Sprays, By Region, 2019-2032 (US$ Mn)
10.6.2. Market Dynamics for Nasal Sprays
10.6.2.1. Drivers
10.6.2.2. Restraints
10.6.2.3. Opportunities
10.6.2.4. Trends
10.7. Intravenous Infusions
10.7.1. Global Nootropics Market, By Intravenous Infusions, By Region, 2019-2032 (US$ Mn)
10.7.2. Market Dynamics for Intravenous Infusions
10.7.2.1. Drivers
10.7.2.2. Restraints
10.7.2.3. Opportunities
10.7.2.4. Trends
11. Global Nootropics Market, By Consumer Demographics and Preferences
11.1. Global Nootropics Market Overview, by Consumer Demographics and Preferences
11.1.1. Global Nootropics Market Revenue Share, By Consumer Demographics and Preferences, 2023 Vs 2032 (in %)
11.2. General Population
11.2.1. Global Nootropics Market, By General Population, By Region, 2019-2032 (US$ Mn)
11.2.2. Market Dynamics for General Population
11.2.2.1. Drivers
11.2.2.2. Restraints
11.2.2.3. Opportunities
11.2.2.4. Trends
11.3. Athletes and Fitness Enthusiasts
11.3.1. Global Nootropics Market, By Athletes and Fitness Enthusiasts, By Region, 2019-2032 (US$ Mn)
11.3.2. Market Dynamics for Athletes and Fitness Enthusiasts
11.3.2.1. Drivers
11.3.2.2. Restraints
11.3.2.3. Opportunities
11.3.2.4. Trends
11.4. Students and Professionals
11.4.1. Global Nootropics Market, By Students and Professionals, By Region, 2019-2032 (US$ Mn)
11.4.2. Market Dynamics for Students and Professionals
11.4.2.1. Drivers
11.4.2.2. Restraints
11.4.2.3. Opportunities
11.4.2.4. Trends
11.5. Seniors and Aging Population
11.5.1. Global Nootropics Market, By Seniors and Aging Population, By Region, 2019-2032 (US$ Mn)
11.5.2. Market Dynamics for Seniors and Aging Population
11.5.2.1. Drivers
11.5.2.2. Restraints
11.5.2.3. Opportunities
11.5.2.4. Trends
11.6. Biohackers and DIY Enthusiasts
11.6.1. Global Nootropics Market, By Biohackers and DIY Enthusiasts, By Region, 2019-2032 (US$ Mn)
11.6.2. Market Dynamics for Biohackers and DIY Enthusiasts
11.6.2.1. Drivers
11.6.2.2. Restraints
11.6.2.3. Opportunities
11.6.2.4. Trends
12. Global Nootropics Market, By Region
12.1. Global Nootropics Market Overview, by Region
12.1.1. Global Nootropics Market, By Region, 2023 vs 2032 (in%)
12.2. Type of Nootropics
12.2.1. Global Nootropics Market, By Type of Nootropics, 2019-2032 (US$ Mn)
12.3. Targeted Cognitive Functions
12.3.1. Global Nootropics Market, By Targeted Cognitive Functions, 2019-2032 (US$ Mn)
12.4. Formulation and Delivery Methods
12.4.1. Global Nootropics Market, By Formulation and Delivery Methods, 2019-2032 (US$ Mn)
12.5. Consumer Demographics and Preferences
12.5.1. Global Nootropics Market, By Consumer Demographics and Preferences, 2019-2032 (US$ Mn)
13. North America Nootropics Market Analysis
13.1. Overview
13.1.1. Market Dynamics for North America
13.1.1.1. Drivers
13.1.1.2. Restraints
13.1.1.3. Opportunities
13.1.1.4. Trends
13.2. North America Nootropics Market, by Type of Nootropics, 2019-2032(US$ Mn)
13.2.1. Overview
13.2.2. SRC Analysis
13.3. North America Nootropics Market, by Targeted Cognitive Functions, 2019-2032(US$ Mn)
13.3.1. Overview
13.3.2. SRC Analysis
13.4. North America Nootropics Market, by Formulation and Delivery Methods, 2019-2032(US$ Mn)
13.4.1. Overview
13.4.2. SRC Analysis
13.5. North America Nootropics Market, by Consumer Demographics and Preferences, 2019-2032(US$ Mn)
13.5.1. Overview
13.5.2. SRC Analysis
13.6. North America Nootropics Market, by Country, 2019-2032(US$ Mn)
13.6.1. North America Nootropics Market, by Country, 2023 Vs 2032 (in%)
13.6.2. U.S.
13.6.3. Canada
13.6.4. Mexico
14. Europe Nootropics Market Analysis
14.1. Overview
14.1.1. Market Dynamics for North America
14.1.1.1. Drivers
14.1.1.2. Restraints
14.1.1.3. Opportunities
14.1.1.4. Trends
14.2. Europe Nootropics Market, by Type of Nootropics, 2019-2032(US$ Mn)
14.2.1. Overview
14.2.2. SRC Analysis
14.3. Europe Nootropics Market, by Targeted Cognitive Functions, 2019-2032(US$ Mn)
14.3.1. Overview
14.3.2. SRC Analysis
14.4. Europe Nootropics Market, by Formulation and Delivery Methods, 2019-2032(US$ Mn)
14.4.1. Overview
14.4.2. SRC Analysis
14.5. Europe Nootropics Market, by Consumer Demographics and Preferences, 2019-2032(US$ Mn)
14.5.1. Overview
14.5.2. SRC Analysis
14.6. Europe Nootropics Market, by Country, 2019-2032 (US$ Mn)
14.6.1. Europe Nootropics Market, by Country, 2023 Vs 2032 (in%)
14.6.2. UK
14.6.3. France
14.6.4. Germany
14.6.5. Italy
14.6.6. Spain
14.6.7. Benelux
14.6.8. Russia
14.6.9. Rest of Europe
15. Asia Pacific Nootropics Market Analysis
15.1. Overview
15.1.1. Market Dynamics for North America
15.1.1.1. Drivers
15.1.1.2. Restraints
15.1.1.3. Opportunities
15.1.1.4. Trends
15.2. Asia Pacific Nootropics Market, by Type of Nootropics, 2019-2032(US$ Mn)
15.2.1. Overview
15.2.2. SRC Analysis
15.3. Asia Pacific Nootropics Market, by Targeted Cognitive Functions, 2019-2032(US$ Mn)
15.3.1. Overview
15.3.2. SRC Analysis
15.4. Asia Pacific Nootropics Market, by Formulation and Delivery Methods, 2019-2032(US$ Mn)
15.4.1. Overview
15.4.2. SRC Analysis
15.5. Asia Pacific Nootropics Market, by Consumer Demographics and Preferences, 2019-2032(US$ Mn)
15.5.1. Overview
15.5.2. SRC Analysis
15.6. Asia Pacific Nootropics Market, by Country, 2019-2032 (US$ Mn)
15.6.1. Asia Pacific Nootropics Market, by Country, 2023 Vs 2032 (in%)
15.6.2. China
15.6.3. Japan
15.6.4. India
15.6.5. South Korea
15.6.6. South East Asia
15.6.7. Rest of Asia Pacific
16. Latin America Nootropics Market Analysis
16.1. Overview
16.1.1. Market Dynamics for North America
16.1.1.1. Drivers
16.1.1.2. Restraints
16.1.1.3. Opportunities
16.1.1.4. Trends
16.2. Latin America Nootropics Market, by Type of Nootropics, 2019-2032(US$ Mn)
16.2.1. Overview
16.2.2. SRC Analysis
16.3. Latin America Nootropics Market, by Targeted Cognitive Functions, 2019-2032(US$ Mn)
16.3.1. Overview
16.3.2. SRC Analysis
16.4. Latin America Nootropics Market, by Formulation and Delivery Methods, 2019-2032(US$ Mn)
16.4.1. Overview
16.4.2. SRC Analysis
16.5. Latin America Nootropics Market, by Consumer Demographics and Preferences, 2019-2032(US$ Mn)
16.5.1. Overview
16.5.2. SRC Analysis
16.6. Latin America Nootropics Market, by Country, 2019-2032 (US$ Mn)
16.6.1. Latin America Nootropics Market, by Country, 2023 Vs 2032 (in%)
16.6.2. Brazil
16.6.3. Argentina
16.6.4. Rest of Latin America
17. Middle East Nootropics Market Analysis
17.1. Overview
17.1.1. Market Dynamics for North America
17.1.1.1. Drivers
17.1.1.2. Restraints
17.1.1.3. Opportunities
17.1.1.4. Trends
17.2. Middle East Nootropics Market, by Type of Nootropics, 2019-2032(US$ Mn)
17.2.1. Overview
17.2.2. SRC Analysis
17.3. Middle East Nootropics Market, by Targeted Cognitive Functions, 2019-2032(US$ Mn)
17.3.1. Overview
17.3.2. SRC Analysis
17.4. Middle East Nootropics Market, by Formulation and Delivery Methods, 2019-2032(US$ Mn)
17.4.1. Overview
17.4.2. SRC Analysis
17.5. Middle East Nootropics Market, by Consumer Demographics and Preferences, 2019-2032(US$ Mn)
17.5.1. Overview
17.5.2. SRC Analysis
17.6. Middle East Nootropics Market, by Country, 2019-2032 (US$ Mn)
17.6.1. Middle East Nootropics Market, by Country, 2023 Vs 2032 (in%)
17.6.2. UAE
17.6.3. Saudi Arabia
17.6.4. Rest of Middle East
18. Africa Nootropics Market Analysis
18.1. Overview
18.1.1. Market Dynamics for North America
18.1.1.1. Drivers
18.1.1.2. Restraints
18.1.1.3. Opportunities
18.1.1.4. Trends
18.2. Africa Nootropics Market, by Type of Nootropics, 2019-2032(US$ Mn)
18.2.1. Overview
18.2.2. SRC Analysis
18.3. Africa Nootropics Market, by Targeted Cognitive Functions, 2019-2032(US$ Mn)
18.3.1. Overview
18.3.2. SRC Analysis
18.4. Africa Nootropics Market, by Formulation and Delivery Methods, 2019-2032(US$ Mn)
18.4.1. Overview
18.4.2. SRC Analysis
18.5. Africa Nootropics Market, by Consumer Demographics and Preferences, 2019-2032(US$ Mn)
18.5.1. Overview
18.5.2. SRC Analysis
18.6. Africa Nootropics Market, by Country, 2019-2032 (US$ Mn)
18.6.1. Middle East Nootropics Market, by Country, 2023 Vs 2032 (in%)
18.6.2. South Africa
18.6.3. Egypt
18.6.4. Rest of Africa
19. Company Profiles
19.1. Gaia Herbs
19.1.1. Company Overview
19.1.2. Products/Services Portfolio
19.1.3. Geographical Presence
19.1.4. SWOT Analysis
19.1.5. Financial Summary
19.1.5.1. Market Revenue and Net Profit (2019-2023)
19.1.5.2. Business Segment Revenue Analysis
19.1.5.3. Geographical Revenue Analysis
19.2. Kimera Koffee
19.3. Mental Mojo
19.4. Mind Lab Pro
19.5. Neu Drinks
19.6. NooCube
19.7. Onnit Labs
19.8. Peak Nootropics
19.9. Purelife Bioscience
19.10. Reckitt Benckiser
19.11. SupNootropic
19.12. Teva Pharmaceutical
19.13. TruBrain
19.14. United Pharmacies
19.15. Zhou Nutrition
19.16. Others
20. Research Methodology
20.1. Research Methodology
20.2. Phase I – Secondary Research
20.3. Phase II – Data Modelling
20.3.1. Company Share Analysis Model
20.3.2. Revenue Based Modelling
20.4. Phase III – Primary Research
20.5. Research Limitations
20.5.1. Assumptions

List of Figures
FIG. 1 Global Nootropics Market: Research Methodology
FIG. 2 Market Size Estimation – Top Down & Bottom up Approach
FIG. 3 Global Nootropics Market Segmentation
FIG. 4 Global Nootropics Market, by Type of Nootropics, 2023 (US$ Mn)
FIG. 5 Global Nootropics Market, by Targeted Cognitive Functions, 2023 (US$ Mn)
FIG. 6 Global Nootropics Market, by Formulation and Delivery Methods, 2023 (US$ Mn)
FIG. 7 Global Nootropics Market, by Consumer Demographics and Preferences, 2023 (US$ Mn)
FIG. 8 Global Nootropics Market, by Geography, 2023 (US$ Mn)
FIG. 9 Attractive Investment Proposition, by Type of Nootropics, 2023
FIG. 10 Attractive Investment Proposition, by Targeted Cognitive Functions, 2023
FIG. 11 Attractive Investment Proposition, by Formulation and Delivery Methods, 2023
FIG. 12 Attractive Investment Proposition, by Consumer Demographics and Preferences, 2023
FIG. 13 Attractive Investment Proposition, by Geography, 2023
FIG. 14 Global Market Share Analysis of Key Nootropics Market Manufacturers, 2023
FIG. 15 Global Market Positioning of Key Nootropics Market Manufacturers, 2023
FIG. 16 Global Nootropics Market Value Contribution, By Type of Nootropics, 2023&2032 (Value %)
FIG. 17 Global Nootropics Market, by Synthetic Nootropics, By Region, 2019-2023 (US$ Mn)
FIG. 18 Global Nootropics Market, by Natural Nootropics, By Region, 2019-2023 (US$ Mn)
FIG. 19 Global Nootropics Market, by Cholinergics, By Region, 2019-2023 (US$ Mn)
FIG. 20 Global Nootropics Market, by Adaptogens, By Region, 2019-2023 (US$ Mn)
FIG. 21 Global Nootropics Market, by Stimulants, By Region, 2019-2023 (US$ Mn)
FIG. 22 Global Nootropics Market, by Nutraceuticals, By Region, 2019-2023 (US$ Mn)
FIG. 23 Global Nootropics Market Value Contribution, By Targeted Cognitive Functions, 2023&2032 (Value %)
FIG. 24 Global Nootropics Market, by Memory Enhancement, By Region, 2019-2023 (US$ Mn)
FIG. 25 Global Nootropics Market, by Focus and Attention, By Region, 2019-2023 (US$ Mn)
FIG. 26 Global Nootropics Market, by Mood Enhancement, By Region, 2019-2023 (US$ Mn)
FIG. 27 Global Nootropics Market, by Neuroprotection, By Region, 2019-2023 (US$ Mn)
FIG. 28 Global Nootropics Market, by Brain Health and Longevity, By Region, 2019-2023 (US$ Mn)
FIG. 29 Global Nootropics Market Value Contribution, By Formulation and Delivery Methods, 2023&2032 (Value %)
FIG. 30 Global Nootropics Market, by Capsules and Tablets, By Region, 2019-2023 (US$ Mn)
FIG. 31 Global Nootropics Market, by Powders and Drink Mixes, By Region, 2019-2023 (US$ Mn)
FIG. 32 Global Nootropics Market, by Sublingual Formulations, By Region, 2019-2023 (US$ Mn)
FIG. 33 Global Nootropics Market, by Transdermal Patches, By Region, 2019-2023 (US$ Mn)
FIG. 34 Global Nootropics Market, by Nasal Sprays, By Region, 2019-2023 (US$ Mn)
FIG. 35 Global Nootropics Market, by Intravenous Infusions, By Region, 2019-2023 (US$ Mn)
FIG. 36 Global Nootropics Market Value Contribution, By Consumer Demographics and Preferences, 2023&2032 (Value %)
FIG. 37 Global Nootropics Market, by General Population, By Region, 2019-2023 (US$ Mn)
FIG. 38 Global Nootropics Market, by Athletes and Fitness Enthusiasts, By Region, 2019-2023 (US$ Mn)
FIG. 39 Global Nootropics Market, by Students and Professionals, By Region, 2019-2023 (US$ Mn)
FIG. 40 Global Nootropics Market, by Seniors and Aging Population, By Region, 2019-2023 (US$ Mn)
FIG. 41 Global Nootropics Market, by Biohackers and DIY Enthusiasts, By Region, 2019-2023 (US$ Mn)
FIG. 42 North America Nootropics Market, 2019-2032 (US$ Mn)
FIG. 43 U.S. Nootropics Market, 2019-2032 (US$ Mn)
FIG. 44 Canada Nootropics Market, 2019-2032 (US$ Mn)
FIG. 45 Mexico Nootropics Market, 2019-2032 (US$ Mn)
FIG. 46 Europe Nootropics Market, 2019-2032 (US$ Mn)
FIG. 47 Germany Nootropics Market, 2019-2032 (US$ Mn)
FIG. 48 France Nootropics Market, 2019-2032 (US$ Mn)
FIG. 49 U.K. Nootropics Market, 2019-2032 (US$ Mn)
FIG. 50 Italy Nootropics Market, 2019-2032 (US$ Mn)
FIG. 51 Spain Nootropics Market, 2019-2032 (US$ Mn)
FIG. 52 Benelux Nootropics Market, 2019-2032 (US$ Mn)
FIG. 53 Russia Nootropics Market, 2019-2032 (US$ Mn)
FIG. 54 Rest of Europe Nootropics Market, 2019-2032 (US$ Mn)
FIG. 55 Asia Pacific Nootropics Market, 2019-2032 (US$ Mn)
FIG. 56 China Nootropics Market, 2019-2032 (US$ Mn)
FIG. 57 Japan Nootropics Market, 2019-2032 (US$ Mn)
FIG. 58 India Nootropics Market, 2019-2032 (US$ Mn)
FIG. 59 South Korea Nootropics Market, 2019-2032 (US$ Mn)
FIG. 60 South-East Asia Nootropics Market, 2019-2032 (US$ Mn)
FIG. 61 Rest of Asia Pacific Nootropics Market, 2019-2032 (US$ Mn)
FIG. 62 Latin America Nootropics Market, 2019-2032 (US$ Mn)
FIG. 63 Brazil Nootropics Market, 2019-2032 (US$ Mn)
FIG. 64 Argentina Nootropics Market, 2019-2032 (US$ Mn)
FIG. 65 Rest of Latin America Nootropics Market, 2019-2032 (US$ Mn)
FIG. 66 Middle East Nootropics Market, 2019-2032 (US$ Mn)
FIG. 67 UAE Nootropics Market, 2019-2032 (US$ Mn)
FIG. 68 Saudi Arabia Nootropics Market, 2019-2032 (US$ Mn)
FIG. 69 Rest of Middle East Nootropics Market, 2019-2032 (US$ Mn)
FIG. 70 Africa Nootropics Market, 2019-2032 (US$ Mn)
FIG. 71 South Africa Nootropics Market, 2019-2032 (US$ Mn)
FIG. 72 Egypt Nootropics Market, 2019-2032 (US$ Mn)
FIG. 73 Rest of Africa Nootropics Market, 2019-2032 (US$ Mn)

List of Tables
TABLE 1 Market Snapshot: Global Nootropics Market
TABLE 2 Global Nootropics Market: Market Drivers Impact Analysis
TABLE 3 Global Nootropics Market: Market Restraints Impact Analysis
TABLE 4 Global Nootropics Market, by Competitive Benchmarking, 2023
TABLE 5 Global Nootropics Market, by Geographical Presence Analysis, 2023
TABLE 6 Global Nootropics Market, by Key Strategies Analysis, 2023
TABLE 7 Global Nootropics Market, by Synthetic Nootropics, By Region, 2019-2023 (US$ Mn)
TABLE 8 Global Nootropics Market, by Synthetic Nootropics, By Region, 2024-2032 (US$ Mn)
TABLE 9 Global Nootropics Market, by Natural Nootropics, By Region, 2019-2023 (US$ Mn)
TABLE 10 Global Nootropics Market, by Natural Nootropics, By Region, 2019-2023 (US$ Mn)
TABLE 11 Global Nootropics Market, by Cholinergics, By Region, 2019-2023 (US$ Mn)
TABLE 12 Global Nootropics Market, by Cholinergics, By Region, 2019-2023 (US$ Mn)
TABLE 13 Global Nootropics Market, by Adaptogens, By Region, 2019-2023 (US$ Mn)
TABLE 14 Global Nootropics Market, by Adaptogens, By Region, 2019-2023 (US$ Mn)
TABLE 15 Global Nootropics Market, by Stimulants, By Region, 2019-2023 (US$ Mn)
TABLE 16 Global Nootropics Market, by Stimulants, By Region, 2019-2023 (US$ Mn)
TABLE 17 Global Nootropics Market, by Nutraceuticals, By Region, 2019-2023 (US$ Mn)
TABLE 18 Global Nootropics Market, by Nutraceuticals, By Region, 2019-2023 (US$ Mn)

TABLE 19 Global Nootropics Market, by Memory Enhancement, By Region, 2019-2023 (US$ Mn)
TABLE 20 Global Nootropics Market, by Memory Enhancement, By Region, 2019-2023 (US$ Mn)
TABLE 21 Global Nootropics Market, by Focus and Attention, By Region, 2019-2023 (US$ Mn)
TABLE 22 Global Nootropics Market, by Focus and Attention, By Region, 2019-2023 (US$ Mn)
TABLE 23 Global Nootropics Market, by Mood Enhancement, By Region, 2019-2023 (US$ Mn)
TABLE 24 Global Nootropics Market, by Mood Enhancement, By Region, 2019-2023 (US$ Mn)
TABLE 25 Global Nootropics Market, by Neuroprotection, By Region, 2019-2023 (US$ Mn)
TABLE 26 Global Nootropics Market, by Neuroprotection, By Region, 2019-2023 (US$ Mn)
TABLE 27 Global Nootropics Market, by Brain Health and Longevity, By Region, 2019-2023 (US$ Mn)
TABLE 28 Global Nootropics Market, by Brain Health and Longevity, By Region, 2019-2023 (US$ Mn)

TABLE 29 Global Nootropics Market, by Capsules and Tablets, By Region, 2019-2023 (US$ Mn)
TABLE 30 Global Nootropics Market, by Capsules and Tablets, By Region, 2019-2023 (US$ Mn)
TABLE 31 Global Nootropics Market, by Powders and Drink Mixes, By Region, 2019-2023 (US$ Mn)
TABLE 32 Global Nootropics Market, by Powders and Drink Mixes, By Region, 2019-2023 (US$ Mn)
TABLE 33 Global Nootropics Market, by Sublingual Formulations, By Region, 2019-2023 (US$ Mn)
TABLE 34 Global Nootropics Market, by Sublingual Formulations, By Region, 2019-2023 (US$ Mn)
TABLE 35 Global Nootropics Market, by Transdermal Patches, By Region, 2019-2023 (US$ Mn)
TABLE 36 Global Nootropics Market, by Transdermal Patches, By Region, 2019-2023 (US$ Mn)
TABLE 37 Global Nootropics Market, by Nasal Sprays, By Region, 2019-2023 (US$ Mn)
TABLE 38 Global Nootropics Market, by Nasal Sprays, By Region, 2019-2023 (US$ Mn)
TABLE 39 Global Nootropics Market, by Intravenous Infusions, By Region, 2019-2023 (US$ Mn)
TABLE 40 Global Nootropics Market, by Intravenous Infusions, By Region, 2019-2023 (US$ Mn)
TABLE 41 Global Nootropics Market, by General Population, By Region, 2019-2023 (US$ Mn)
TABLE 42 Global Nootropics Market, by General Population, By Region, 2019-2023 (US$ Mn)
TABLE 43 Global Nootropics Market, by Athletes and Fitness Enthusiasts, By Region, 2019-2023 (US$ Mn)
TABLE 44 Global Nootropics Market, by Athletes and Fitness Enthusiasts, By Region, 2019-2023 (US$ Mn)
TABLE 45 Global Nootropics Market, by Students and Professionals, By Region, 2019-2023 (US$ Mn)
TABLE 46 Global Nootropics Market, by Students and Professionals, By Region, 2019-2023 (US$ Mn)
TABLE 47 Global Nootropics Market, by Seniors and Aging Population, By Region, 2019-2023 (US$ Mn)
TABLE 48 Global Nootropics Market, by Seniors and Aging Population, By Region, 2019-2023 (US$ Mn)
TABLE 49 Global Nootropics Market, by Biohackers and DIY Enthusiasts, By Region, 2019-2023 (US$ Mn)
TABLE 50 Global Nootropics Market, by Biohackers and DIY Enthusiasts, By Region, 2019-2023 (US$ Mn)
TABLE 51 Global Nootropics Market, by Type of Nootropics, 2019-2023 (US$ Mn)
TABLE 52 Global Nootropics Market, by Type of Nootropics, 2024-2032 (US$ Mn)
TABLE 53 Global Nootropics Market, by Targeted Cognitive Functions, 2019-2023 (US$ Mn)
TABLE 54 Global Nootropics Market, by Targeted Cognitive Functions, 2024-2032 (US$ Mn)
TABLE 55 Global Nootropics Market, by Formulation and Delivery Methods, 2019-2023 (US$ Mn)
TABLE 56 Global Nootropics Market, by Formulation and Delivery Methods, 2024-2032 (US$ Mn)
TABLE 57 Global Nootropics Market, by Consumer Demographics and Preferences, 2019-2023 (US$ Mn)
TABLE 58 Global Nootropics Market, by Consumer Demographics and Preferences, 2024-2032 (US$ Mn)
TABLE 59 North America Nootropics Market, by Type of Nootropics, 2019-2023 (US$ Mn)
TABLE 60 North America Nootropics Market, by Type of Nootropics, 2024-2032 (US$ Mn)
TABLE 61 North America Nootropics Market, by Targeted Cognitive Functions, 2019-2023 (US$ Mn)
TABLE 62 North America Nootropics Market, by Targeted Cognitive Functions, 2024-2032 (US$ Mn)
TABLE 63 North America Nootropics Market, by Formulation and Delivery Methods, 2019-2023 (US$ Mn)
TABLE 64 North America Nootropics Market, by Formulation and Delivery Methods, 2024-2032 (US$ Mn)
TABLE 65 North America Nootropics Market, by Consumer Demographics and Preferences, 2019-2023 (US$ Mn)
TABLE 66 North America Nootropics Market, by Consumer Demographics and Preferences, 2024-2032 (US$ Mn)
TABLE 67 North America Nootropics Market, by Country, 2019-2023 (US$ Mn)
TABLE 68 North America Nootropics Market, by Country, 2024-2032 (US$ Mn)
TABLE 69 United States Nootropics Market, by Type of Nootropics, 2019-2023 (US$ Mn)
TABLE 70 United States Nootropics Market, by Type of Nootropics, 2024-2032 (US$ Mn)
TABLE 71 United States Nootropics Market, by Targeted Cognitive Functions, 2019-2023 (US$ Mn)
TABLE 72 United States Nootropics Market, by Targeted Cognitive Functions, 2024-2032 (US$ Mn)
TABLE 73 United States Nootropics Market, by Formulation and Delivery Methods, 2019-2023 (US$ Mn)
TABLE 74 United States Nootropics Market, by Formulation and Delivery Methods, 2024-2032 (US$ Mn)
TABLE 75 United States Nootropics Market, by Consumer Demographics and Preferences, 2019-2023 (US$ Mn)
TABLE 76 United States Nootropics Market, by Consumer Demographics and Preferences, 2024-2032 (US$ Mn)
TABLE 77 Canada Nootropics Market, by Type of Nootropics, 2019-2023 (US$ Mn)
TABLE 78 Canada Nootropics Market, by Type of Nootropics, 2024-2032 (US$ Mn)
TABLE 79 Canada Nootropics Market, by Targeted Cognitive Functions, 2019-2023 (US$ Mn)
TABLE 80 Canada Nootropics Market, by Targeted Cognitive Functions, 2024-2032 (US$ Mn)
TABLE 81 Canada Nootropics Market, by Formulation and Delivery Methods, 2019-2023 (US$ Mn)
TABLE 82 Canada Nootropics Market, by Formulation and Delivery Methods, 2024-2032 (US$ Mn)
TABLE 83 Canada Nootropics Market, by Consumer Demographics and Preferences, 2019-2023 (US$ Mn)
TABLE 84 Canada Nootropics Market, by Consumer Demographics and Preferences, 2024-2032 (US$ Mn)
TABLE 85 Mexico Nootropics Market, by Type of Nootropics, 2019-2023 (US$ Mn)
TABLE 86 Mexico Nootropics Market, by Type of Nootropics, 2024-2032 (US$ Mn)
TABLE 87 Mexico Nootropics Market, by Targeted Cognitive Functions, 2019-2023 (US$ Mn)
TABLE 88 Mexico Nootropics Market, by Targeted Cognitive Functions, 2024-2032 (US$ Mn)
TABLE 89 Mexico Nootropics Market, by Formulation and Delivery Methods, 2019-2023 (US$ Mn)
TABLE 90 Mexico Nootropics Market, by Formulation and Delivery Methods, 2024-2032 (US$ Mn)
TABLE 91 Mexico Nootropics Market, by Consumer Demographics and Preferences, 2019-2023 (US$ Mn)
TABLE 92 Mexico Nootropics Market, by Consumer Demographics and Preferences, 2024-2032 (US$ Mn)
TABLE 93 Europe Nootropics Market, by Type of Nootropics, 2019-2023 (US$ Mn)
TABLE 94 Europe Nootropics Market, by Type of Nootropics, 2024-2032 (US$ Mn)
TABLE 95 Europe Nootropics Market, by Targeted Cognitive Functions, 2019-2023 (US$ Mn)
TABLE 96 Europe Nootropics Market, by Targeted Cognitive Functions, 2024-2032 (US$ Mn)
TABLE 97 Europe Nootropics Market, by Formulation and Delivery Methods, 2019-2023 (US$ Mn)
TABLE 98 Europe Nootropics Market, by Formulation and Delivery Methods, 2024-2032 (US$ Mn)
TABLE 99 Europe Nootropics Market, by Country, 2019-2023 (US$ Mn)
TABLE 100 Europe Nootropics Market, by Country, 2024-2032 (US$ Mn)
TABLE 101 Europe Nootropics Market, by Consumer Demographics and Preferences, 2019-2023 (US$ Mn)
TABLE 102 Europe Nootropics Market, by Consumer Demographics and Preferences, 2024-2032 (US$ Mn)
TABLE 103 Germany Nootropics Market, by Type of Nootropics, 2019-2023 (US$ Mn)
TABLE 104 Germany Nootropics Market, by Type of Nootropics, 2024-2032 (US$ Mn)
TABLE 105 Germany Nootropics Market, by Targeted Cognitive Functions, 2019-2023 (US$ Mn)
TABLE 106 Germany Nootropics Market, by Targeted Cognitive Functions, 2024-2032 (US$ Mn)
TABLE 107 Germany Nootropics Market, by Formulation and Delivery Methods, 2019-2023 (US$ Mn)
TABLE 108 Germany Nootropics Market, by Formulation and Delivery Methods, 2024-2032 (US$ Mn)
TABLE 109 Germany Nootropics Market, by Consumer Demographics and Preferences, 2019-2023 (US$ Mn)
TABLE 110 Germany Nootropics Market, by Consumer Demographics and Preferences, 2024-2032 (US$ Mn)
TABLE 111 France Nootropics Market, by Type of Nootropics, 2019-2023 (US$ Mn)
TABLE 112 France Nootropics Market, by Type of Nootropics, 2024-2032 (US$ Mn)
TABLE 113 France Nootropics Market, by Targeted Cognitive Functions, 2019-2023 (US$ Mn)
TABLE 114 France Nootropics Market, by Targeted Cognitive Functions, 2024-2032 (US$ Mn)
TABLE 115 France Nootropics Market, by Formulation and Delivery Methods, 2019-2023 (US$ Mn)
TABLE 116 France Nootropics Market, by Formulation and Delivery Methods, 2024-2032 (US$ Mn)
TABLE 117 France Nootropics Market, by Consumer Demographics and Preferences, 2019-2023 (US$ Mn)
TABLE 118 France Nootropics Market, by Consumer Demographics and Preferences, 2024-2032 (US$ Mn)
TABLE 119 United Kingdom Nootropics Market, by Type of Nootropics, 2019-2023 (US$ Mn)
TABLE 120 United Kingdom Nootropics Market, by Type of Nootropics, 2024-2032 (US$ Mn)
TABLE 121 United Kingdom Nootropics Market, by Targeted Cognitive Functions, 2019-2023 (US$ Mn)
TABLE 122 United Kingdom Nootropics Market, by Targeted Cognitive Functions, 2024-2032 (US$ Mn)
TABLE 123 United Kingdom Nootropics Market, by Formulation and Delivery Methods, 2019-2023 (US$ Mn)
TABLE 124 United Kingdom Nootropics Market, by Formulation and Delivery Methods, 2024-2032 (US$ Mn)
TABLE 125 United Kingdom Nootropics Market, by Consumer Demographics and Preferences, 2019-2023 (US$ Mn)
TABLE 126 United Kingdom Nootropics Market, by Consumer Demographics and Preferences, 2024-2032 (US$ Mn)
TABLE 127 Italy Nootropics Market, by Type of Nootropics, 2019-2023 (US$ Mn)
TABLE 128 Italy Nootropics Market, by Type of Nootropics, 2024-2032 (US$ Mn)
TABLE 129 Italy Nootropics Market, by Targeted Cognitive Functions, 2019-2023 (US$ Mn)
TABLE 130 Italy Nootropics Market, by Targeted Cognitive Functions, 2024-2032 (US$ Mn)
TABLE 131 Italy Nootropics Market, by Formulation and Delivery Methods, 2019-2023 (US$ Mn)
TABLE 132 Italy Nootropics Market, by Formulation and Delivery Methods, 2024-2032 (US$ Mn)
TABLE 133 Italy Nootropics Market, by Consumer Demographics and Preferences, 2019-2023 (US$ Mn)
TABLE 134 Italy Nootropics Market, by Consumer Demographics and Preferences, 2024-2032 (US$ Mn)
TABLE 135 Spain Nootropics Market, by Type of Nootropics, 2019-2023 (US$ Mn)
TABLE 136 Spain Nootropics Market, by Type of Nootropics, 2024-2032 (US$ Mn)
TABLE 137 Spain Nootropics Market, by Targeted Cognitive Functions, 2019-2023 (US$ Mn)
TABLE 138 Spain Nootropics Market, by Targeted Cognitive Functions, 2024-2032 (US$ Mn)
TABLE 139 Spain Nootropics Market, by Formulation and Delivery Methods, 2019-2023 (US$ Mn)
TABLE 140 Spain Nootropics Market, by Formulation and Delivery Methods, 2024-2032 (US$ Mn)
TABLE 141 Spain Nootropics Market, by Consumer Demographics and Preferences, 2019-2023 (US$ Mn)
TABLE 142 Spain Nootropics Market, by Consumer Demographics and Preferences, 2024-2032 (US$ Mn)
TABLE 143 Benelux Nootropics Market, by Type of Nootropics, 2019-2023 (US$ Mn)
TABLE 144 Benelux Nootropics Market, by Type of Nootropics, 2024-2032 (US$ Mn)
TABLE 145 Benelux Nootropics Market, by Targeted Cognitive Functions, 2019-2023 (US$ Mn)
TABLE 146 Benelux Nootropics Market, by Targeted Cognitive Functions, 2024-2032 (US$ Mn)
TABLE 147 Benelux Nootropics Market, by Formulation and Delivery Methods, 2019-2023 (US$ Mn)
TABLE 148 Benelux Nootropics Market, by Formulation and Delivery Methods, 2024-2032 (US$ Mn)
TABLE 149 Benelux Nootropics Market, by Consumer Demographics and Preferences, 2019-2023 (US$ Mn)
TABLE 150 Benelux Nootropics Market, by Consumer Demographics and Preferences, 2024-2032 (US$ Mn)
TABLE 151 Russia Nootropics Market, by Type of Nootropics, 2019-2023 (US$ Mn)
TABLE 152 Russia Nootropics Market, by Type of Nootropics, 2024-2032 (US$ Mn)
TABLE 153 Russia Nootropics Market, by Targeted Cognitive Functions, 2019-2023 (US$ Mn)
TABLE 154 Russia Nootropics Market, by Targeted Cognitive Functions, 2024-2032 (US$ Mn)
TABLE 155 Russia Nootropics Market, by Formulation and Delivery Methods, 2019-2023 (US$ Mn)
TABLE 156 Russia Nootropics Market, by Formulation and Delivery Methods, 2024-2032 (US$ Mn)
TABLE 157 Russia Nootropics Market, by Consumer Demographics and Preferences, 2019-2023 (US$ Mn)
TABLE 158 Russia Nootropics Market, by Consumer Demographics and Preferences, 2024-2032 (US$ Mn)
TABLE 159 Rest of Europe Nootropics Market, by Type of Nootropics, 2019-2023 (US$ Mn)
TABLE 160 Rest of Europe Nootropics Market, by Type of Nootropics, 2024-2032 (US$ Mn)
TABLE 161 Rest of Europe Nootropics Market, by Targeted Cognitive Functions, 2019-2023 (US$ Mn)
TABLE 162 Rest of Europe Nootropics Market, by Targeted Cognitive Functions, 2024-2032 (US$ Mn)
TABLE 163 Rest of Europe Nootropics Market, by Formulation and Delivery Methods, 2019-2023 (US$ Mn)
TABLE 164 Rest of Europe Nootropics Market, by Formulation and Delivery Methods, 2024-2032 (US$ Mn)
TABLE 165 Rest of Europe Nootropics Market, by Consumer Demographics and Preferences, 2019-2023 (US$ Mn)
TABLE 166 Rest of Europe Nootropics Market, by Consumer Demographics and Preferences, 2024-2032 (US$ Mn)
TABLE 167 Asia Pacific Nootropics Market, by Type of Nootropics, 2019-2023 (US$ Mn)
TABLE 168 Asia Pacific Nootropics Market, by Type of Nootropics, 2024-2032 (US$ Mn)
TABLE 169 Asia Pacific Nootropics Market, by Targeted Cognitive Functions, 2019-2023 (US$ Mn)
TABLE 170 Asia Pacific Nootropics Market, by Targeted Cognitive Functions, 2024-2032 (US$ Mn)
TABLE 171 Asia Pacific Nootropics Market, by Formulation and Delivery Methods, 2019-2023 (US$ Mn)
TABLE 172 Asia Pacific Nootropics Market, by Formulation and Delivery Methods, 2024-2032 (US$ Mn)
TABLE 173 Asia Pacific Nootropics Market, by Consumer Demographics and Preferences, 2019-2023 (US$ Mn)
TABLE 174 Asia Pacific Nootropics Market, by Consumer Demographics and Preferences, 2024-2032 (US$ Mn)
TABLE 175 China Nootropics Market, by Type of Nootropics, 2019-2023 (US$ Mn)
TABLE 176 China Nootropics Market, by Type of Nootropics, 2024-2032 (US$ Mn)
TABLE 177 China Nootropics Market, by Targeted Cognitive Functions, 2019-2023 (US$ Mn)
TABLE 178 China Nootropics Market, by Targeted Cognitive Functions, 2024-2032 (US$ Mn)
TABLE 179 China Nootropics Market, by Formulation and Delivery Methods, 2019-2023 (US$ Mn)
TABLE 180 China Nootropics Market, by Formulation and Delivery Methods, 2024-2032 (US$ Mn)
TABLE 181 China Nootropics Market, by Consumer Demographics and Preferences, 2019-2023 (US$ Mn)
TABLE 182 China Nootropics Market, by Consumer Demographics and Preferences, 2024-2032 (US$ Mn)
TABLE 183 Japan Nootropics Market, by Type of Nootropics, 2019-2023 (US$ Mn)
TABLE 184 Japan Nootropics Market, by Type of Nootropics, 2024-2032 (US$ Mn)
TABLE 185 Japan Nootropics Market, by Targeted Cognitive Functions, 2019-2023 (US$ Mn)
TABLE 186 Japan Nootropics Market, by Targeted Cognitive Functions, 2024-2032 (US$ Mn)
TABLE 187 Japan Nootropics Market, by Formulation and Delivery Methods, 2019-2023 (US$ Mn)
TABLE 188 Japan Nootropics Market, by Formulation and Delivery Methods, 2024-2032 (US$ Mn)
TABLE 189 Japan Nootropics Market, by Consumer Demographics and Preferences, 2019-2023 (US$ Mn)
TABLE 190 Japan Nootropics Market, by Consumer Demographics and Preferences, 2024-2032 (US$ Mn)
TABLE 191 India Nootropics Market, by Type of Nootropics, 2019-2023 (US$ Mn)
TABLE 192 India Nootropics Market, by Type of Nootropics, 2024-2032 (US$ Mn)
TABLE 193 India Nootropics Market, by Targeted Cognitive Functions, 2019-2023 (US$ Mn)
TABLE 194 India Nootropics Market, by Targeted Cognitive Functions, 2024-2032 (US$ Mn)
TABLE 195 India Nootropics Market, by Formulation and Delivery Methods, 2019-2023 (US$ Mn)
TABLE 196 India Nootropics Market, by Formulation and Delivery Methods, 2024-2032 (US$ Mn)
TABLE 197 India Nootropics Market, by Consumer Demographics and Preferences, 2019-2023 (US$ Mn)
TABLE 198 India Nootropics Market, by Consumer Demographics and Preferences, 2024-2032 (US$ Mn)
TABLE 199 South Korea Nootropics Market, by Type of Nootropics, 2019-2023 (US$ Mn)
TABLE 200 South Korea Nootropics Market, by Type of Nootropics, 2024-2032 (US$ Mn)
TABLE 201 South Korea Nootropics Market, by Targeted Cognitive Functions, 2019-2023 (US$ Mn)
TABLE 202 South Korea Nootropics Market, by Targeted Cognitive Functions, 2024-2032 (US$ Mn)
TABLE 203 South Korea Nootropics Market, by Formulation and Delivery Methods, 2019-2023 (US$ Mn)
TABLE 204 South Korea Nootropics Market, by Formulation and Delivery Methods, 2024-2032 (US$ Mn)
TABLE 205 South Korea Nootropics Market, by Consumer Demographics and Preferences, 2019-2023 (US$ Mn)
TABLE 206 South Korea Nootropics Market, by Consumer Demographics and Preferences, 2024-2032 (US$ Mn)
TABLE 207 South-East Asia Nootropics Market, by Type of Nootropics, 2019-2023 (US$ Mn)
TABLE 208 South-East Asia Nootropics Market, by Type of Nootropics, 2024-2032 (US$ Mn)
TABLE 209 South-East Asia Nootropics Market, by Targeted Cognitive Functions, 2019-2023 (US$ Mn)
TABLE 210 South-East Asia Nootropics Market, by Targeted Cognitive Functions, 2024-2032 (US$ Mn)
TABLE 211 South-East Asia Nootropics Market, by Formulation and Delivery Methods, 2019-2023 (US$ Mn)
TABLE 212 South-East Asia Nootropics Market, by Formulation and Delivery Methods, 2024-2032 (US$ Mn)
TABLE 213 South-East Asia Nootropics Market, by Consumer Demographics and Preferences, 2019-2023 (US$ Mn)
TABLE 214 South-East Asia Nootropics Market, by Consumer Demographics and Preferences, 2024-2032 (US$ Mn)
TABLE 215 Rest of Asia Pacific Nootropics Market, by Type of Nootropics, 2019-2023 (US$ Mn)
TABLE 216 Rest of Asia Pacific Nootropics Market, by Type of Nootropics, 2024-2032 (US$ Mn)
TABLE 217 Rest of Asia Pacific Nootropics Market, by Targeted Cognitive Functions, 2019-2023 (US$ Mn)
TABLE 218 Rest of Asia Pacific Nootropics Market, by Targeted Cognitive Functions, 2024-2032 (US$ Mn)
TABLE 219 Rest of Asia Pacific Nootropics Market, by Formulation and Delivery Methods, 2019-2023 (US$ Mn)
TABLE 220 Rest of Asia Pacific Nootropics Market, by Formulation and Delivery Methods, 2024-2032 (US$ Mn)
TABLE 221 Rest of Asia Pacific Nootropics Market, by Consumer Demographics and Preferences, 2019-2023 (US$ Mn)
TABLE 222 Rest of Asia Pacific Nootropics Market, by Consumer Demographics and Preferences, 2024-2032 (US$ Mn)
TABLE 223 Latin America Nootropics Market, by Type of Nootropics, 2019-2023 (US$ Mn)
TABLE 224 Latin America Nootropics Market, by Type of Nootropics, 2024-2032 (US$ Mn)
TABLE 225 Latin America Nootropics Market, by Targeted Cognitive Functions, 2019-2023 (US$ Mn)
TABLE 226 Latin America Nootropics Market, by Targeted Cognitive Functions, 2024-2032 (US$ Mn)
TABLE 227 Latin America Nootropics Market, by Formulation and Delivery Methods, 2019-2023 (US$ Mn)
TABLE 228 Latin America Nootropics Market, by Formulation and Delivery Methods, 2024-2032 (US$ Mn)
TABLE 229 Latin America Nootropics Market, by Consumer Demographics and Preferences, 2019-2023 (US$ Mn)
TABLE 230 Latin America Nootropics Market, by Consumer Demographics and Preferences, 2024-2032 (US$ Mn)
TABLE 231 Brazil Nootropics Market, by Type of Nootropics, 2019-2023 (US$ Mn)
TABLE 232 Brazil Nootropics Market, by Type of Nootropics, 2024-2032 (US$ Mn)
TABLE 233 Brazil Nootropics Market, by Targeted Cognitive Functions, 2019-2023 (US$ Mn)
TABLE 234 Brazil Nootropics Market, by Targeted Cognitive Functions, 2024-2032 (US$ Mn)
TABLE 235 Brazil Nootropics Market, by Formulation and Delivery Methods, 2019-2023 (US$ Mn)
TABLE 236 Brazil Nootropics Market, by Formulation and Delivery Methods, 2024-2032 (US$ Mn)
TABLE 237 Brazil Nootropics Market, by Consumer Demographics and Preferences, 2019-2023 (US$ Mn)
TABLE 238 Brazil Nootropics Market, by Consumer Demographics and Preferences, 2024-2032 (US$ Mn)
TABLE 239 Argentina Nootropics Market, by Type of Nootropics, 2019-2023 (US$ Mn)
TABLE 240 Argentina Nootropics Market, by Type of Nootropics, 2024-2032 (US$ Mn)
TABLE 241 Argentina Nootropics Market, by Targeted Cognitive Functions, 2019-2023 (US$ Mn)
TABLE 242 Argentina Nootropics Market, by Targeted Cognitive Functions, 2024-2032 (US$ Mn)
TABLE 243 Argentina Nootropics Market, by Formulation and Delivery Methods, 2019-2023 (US$ Mn)
TABLE 244 Argentina Nootropics Market, by Formulation and Delivery Methods, 2024-2032 (US$ Mn)
TABLE 245 Argentina Nootropics Market, by Consumer Demographics and Preferences, 2019-2023 (US$ Mn)
TABLE 246 Argentina Nootropics Market, by Consumer Demographics and Preferences, 2024-2032 (US$ Mn)
TABLE 247 Rest of Latin America Nootropics Market, by Type of Nootropics, 2019-2023 (US$ Mn)
TABLE 248 Rest of Latin America Nootropics Market, by Type of Nootropics, 2024-2032 (US$ Mn)
TABLE 249 Rest of Latin America Nootropics Market, by Targeted Cognitive Functions, 2019-2023 (US$ Mn)
TABLE 250 Rest of Latin America Nootropics Market, by Targeted Cognitive Functions, 2024-2032 (US$ Mn)
TABLE 251 Rest of Latin America Nootropics Market, by Formulation and Delivery Methods, 2019-2023 (US$ Mn)
TABLE 252 Rest of Latin America Nootropics Market, by Formulation and Delivery Methods, 2024-2032 (US$ Mn)
TABLE 253 Rest of Latin America Nootropics Market, by Consumer Demographics and Preferences, 2019-2023 (US$ Mn)
TABLE 254 Rest of Latin America Nootropics Market, by Consumer Demographics and Preferences, 2024-2032 (US$ Mn)
TABLE 255 Middle East Nootropics Market, by Type of Nootropics, 2019-2023 (US$ Mn)
TABLE 256 Middle East Nootropics Market, by Type of Nootropics, 2024-2032 (US$ Mn)
TABLE 257 Middle East Nootropics Market, by Targeted Cognitive Functions, 2019-2023 (US$ Mn)
TABLE 258 Middle East Nootropics Market, by Targeted Cognitive Functions, 2024-2032 (US$ Mn)
TABLE 259 Middle East Nootropics Market, by Formulation and Delivery Methods, 2019-2023 (US$ Mn)
TABLE 260 Middle East Nootropics Market, by Formulation and Delivery Methods, 2024-2032 (US$ Mn)
TABLE 261 Middle East Nootropics Market, by Consumer Demographics and Preferences, 2019-2023 (US$ Mn)
TABLE 262 Middle East Nootropics Market, by Consumer Demographics and Preferences, 2024-2032 (US$ Mn)
TABLE 263 UAE Nootropics Market, by Type of Nootropics, 2019-2023 (US$ Mn)
TABLE 264 UAE Nootropics Market, by Type of Nootropics, 2024-2032 (US$ Mn)
TABLE 265 UAE Nootropics Market, by Targeted Cognitive Functions, 2019-2023 (US$ Mn)
TABLE 266 UAE Nootropics Market, by Targeted Cognitive Functions, 2024-2032 (US$ Mn)
TABLE 267 UAE Nootropics Market, by Formulation and Delivery Methods, 2019-2023 (US$ Mn)
TABLE 268 UAE Nootropics Market, by Formulation and Delivery Methods, 2024-2032 (US$ Mn)
TABLE 269 UAE Nootropics Market, by Consumer Demographics and Preferences, 2019-2023 (US$ Mn)
TABLE 270 UAE Nootropics Market, by Consumer Demographics and Preferences, 2024-2032 (US$ Mn)
TABLE 271 Saudi Arabia Nootropics Market, by Type of Nootropics, 2019-2023 (US$ Mn)
TABLE 272 Saudi Arabia Nootropics Market, by Type of Nootropics, 2024-2032 (US$ Mn)
TABLE 273 Saudi Arabia Nootropics Market, by Targeted Cognitive Functions, 2019-2023 (US$ Mn)
TABLE 274 Saudi Arabia Nootropics Market, by Targeted Cognitive Functions, 2024-2032 (US$ Mn)
TABLE 275 Saudi Arabia Nootropics Market, by Formulation and Delivery Methods, 2019-2023 (US$ Mn)
TABLE 276 Saudi Arabia Nootropics Market, by Formulation and Delivery Methods, 2024-2032 (US$ Mn)
TABLE 277 Saudi Arabia Nootropics Market, by Consumer Demographics and Preferences, 2019-2023 (US$ Mn)
TABLE 278 Saudi Arabia Nootropics Market, by Consumer Demographics and Preferences, 2024-2032 (US$ Mn)
TABLE 279 Rest of Middle East Nootropics Market, by Type of Nootropics, 2019-2023 (US$ Mn)
TABLE 280 Rest of Middle East Nootropics Market, by Type of Nootropics, 2024-2032 (US$ Mn)
TABLE 281 Rest of Middle East Nootropics Market, by Targeted Cognitive Functions, 2019-2023 (US$ Mn)
TABLE 282 Rest of Middle East Nootropics Market, by Targeted Cognitive Functions, 2024-2032 (US$ Mn)
TABLE 283 Rest of Middle East Nootropics Market, by Formulation and Delivery Methods, 2019-2023 (US$ Mn)
TABLE 284 Rest of Middle East Nootropics Market, by Formulation and Delivery Methods, 2024-2032 (US$ Mn)
TABLE 285 Rest of Middle East Nootropics Market, by Consumer Demographics and Preferences, 2019-2023 (US$ Mn)
TABLE 286 Rest of Middle East Nootropics Market, by Consumer Demographics and Preferences, 2024-2032 (US$ Mn)
TABLE 287 Africa Nootropics Market, by Type of Nootropics, 2019-2023 (US$ Mn)
TABLE 288 Africa Nootropics Market, by Type of Nootropics, 2024-2032 (US$ Mn)
TABLE 289 Africa Nootropics Market, by Targeted Cognitive Functions, 2019-2023 (US$ Mn)
TABLE 290 Africa Nootropics Market, by Targeted Cognitive Functions, 2024-2032 (US$ Mn)
TABLE 291 Africa Nootropics Market, by Formulation and Delivery Methods, 2019-2023 (US$ Mn)
TABLE 292 Africa Nootropics Market, by Formulation and Delivery Methods, 2024-2032 (US$ Mn)
TABLE 293 Africa Nootropics Market, by Consumer Demographics and Preferences, 2019-2023 (US$ Mn)
TABLE 294 Africa Nootropics Market, by Consumer Demographics and Preferences, 2024-2032 (US$ Mn)
TABLE 295 South Africa Nootropics Market, by Type of Nootropics, 2019-2023 (US$ Mn)
TABLE 296 South Africa Nootropics Market, by Type of Nootropics, 2024-2032 (US$ Mn)
TABLE 297 South Africa Nootropics Market, by Targeted Cognitive Functions, 2019-2023 (US$ Mn)
TABLE 298 South Africa Nootropics Market, by Targeted Cognitive Functions, 2024-2032 (US$ Mn)
TABLE 299 South Africa Nootropics Market, by Formulation and Delivery Methods, 2019-2023 (US$ Mn)
TABLE 300 South Africa Nootropics Market, by Formulation and Delivery Methods, 2024-2032 (US$ Mn)
TABLE 301 South Africa Nootropics Market, by Consumer Demographics and Preferences, 2019-2023 (US$ Mn)
TABLE 302 South Africa Nootropics Market, by Consumer Demographics and Preferences, 2024-2032 (US$ Mn)
TABLE 303 Egypt Nootropics Market, by Type of Nootropics, 2019-2023 (US$ Mn)
TABLE 304 Egypt Nootropics Market, by Type of Nootropics, 2024-2032 (US$ Mn)
TABLE 305 Egypt Nootropics Market, by Targeted Cognitive Functions, 2019-2023 (US$ Mn)
TABLE 306 Egypt Nootropics Market, by Targeted Cognitive Functions, 2024-2032 (US$ Mn)
TABLE 307 Egypt Nootropics Market, by Formulation and Delivery Methods, 2019-2023 (US$ Mn)
TABLE 308 Egypt Nootropics Market, by Formulation and Delivery Methods, 2024-2032 (US$ Mn)
TABLE 309 Egypt Nootropics Market, by Consumer Demographics and Preferences, 2019-2023 (US$ Mn)
TABLE 310 Egypt Nootropics Market, by Consumer Demographics and Preferences, 2024-2032 (US$ Mn)
TABLE 311 Rest of Africa Nootropics Market, by Type of Nootropics, 2019-2023 (US$ Mn)
TABLE 312 Rest of Africa Nootropics Market, by Type of Nootropics, 2024-2032 (US$ Mn)
TABLE 313 Rest of Africa Nootropics Market, by Targeted Cognitive Functions, 2019-2023 (US$ Mn)
TABLE 314 Rest of Africa Nootropics Market, by Targeted Cognitive Functions, 2024-2032 (US$ Mn)
TABLE 315 Rest of Africa Nootropics Market, by Formulation and Delivery Methods, 2019-2023 (US$ Mn)
TABLE 316 Rest of Africa Nootropics Market, by Formulation and Delivery Methods, 2024-2032 (US$ Mn)
TABLE 317 Rest of Africa Nootropics Market, by Consumer Demographics and Preferences, 2019-2023 (US$ Mn)
TABLE 318 Rest of Africa Nootropics Market, by Consumer Demographics and Preferences, 2024-2032 (US$ Mn)

Frequently Asked Questions:

What is the current size of the global Nootropics market?

The global Nootropics market was valued at USD 3951.2 Million in 2023.

What is the expected growth rate of the Nootropics market between 2024 and 2032?

The Nootropics market is expected to grow at a CAGR of 15.00% between 2024 and 2032, reaching USD 13899.8 Million in 2032.

Which segment is leading the market share in terms of Type of Nootropics?

Synthetic Nootropics currently hold the largest market share approx 45-50% in 2023. The high demand for drugs to treat mood disorders is contributing this great result. Furthermore, the widespread adoption of these products by students, professionals and athletes drives this dominance.

Which Targeted Cognitive Functions Segments governs the demand for Nootropicss in the world?

Memory Enhancement currently hold the largest market share approx 30-32% in 2023. Students and professionals who seek to preserve so well and remembered is very helpful for the users further drive the market.

Which Consumer Demographics and Preferences segment is expected to post the highest CAGR during the forecast period?

Biohackers and DIY Enthusiasts is projected to witness the highest CAGR during the forecast period. Enthusiasts about itself through their own experimentation, tinkering spirit and relentless pursuit of the utmost human performance drive the market.

Which region is fueling the growth of the Nootropics industry?

North America is fueling the growth of the Nootropics industry, with 32-35% share in 2023.

Who are the major players in the global Nootropics market?

The top players include Gaia Herbs, Kimera Koffee, Mental Mojo, Mind Lab Pro, Neu Drinks, NooCube, Onnit Labs, Peak Nootropics, Purelife Bioscience, Reckitt Benckiser, SupNootropic, Teva Pharmaceutical, TruBrain, United Pharmacies, and Zhou Nutrition, and Others.

What are the major market drivers of the Nootropics industry?

Global Nootropics Market is primarily driven by increasing consumer awareness and demand for cognitive enhancement, increasing mental health, advancements in neurological and pharmaceutical research.

What are the major market restraints of the Nootropics industry?

The global Nootropics market restraints such as regulatory uncertainties related to nootropics safety concerns, potential side effects and long-term effects affecting consumer perceptions and the distribution of adoption rates and consent is included.

What are the major market opportunities of the Nootropics industry?

The global nootropics market presents growth opportunities driven by increasing consumer demand for natural and sustainable products, expanding research in mental health, increasing consumer interest in new natural and medicinal products, and technological advancements in manufacturing processe.

Facial Injectables Market

Published:
Report ID: 6022

Infectious Disease Treatment Market

Published:
Report ID: 6478

Laxatives Market

Published:
Report ID: 12180

India Laxatives Market

Published:
Report ID: 48646

Binder Clip Market

Published:
Report ID: 48654

Japan Vitamins Market

Published:
Report ID: 48619

Middle East and Africa Laxatives Market

Published:
Report ID: 48435

UK Laxatives Market

Published:
Report ID: 48469

Hepatitis B Vaccine Market

Published:
Report ID: 6603

Flavored Empty Capsule Market

Published:
Report ID: 48242

Antiepileptic Drugs Market

Published:
Report ID: 48092

Injectable Thyroid Drug Market

Published:
Report ID: 47814

Purchase Options

The report comes as a view-only PDF document, optimized for individual clients. This version is recommended for personal digital use and does not allow printing.
$3699

To meet the needs of modern corporate teams, our report comes in two formats: a printable PDF and a data-rich Excel sheet. This package is optimized for internal analysis and multi-location access, making it an excellent choice for organizations with distributed workforce.
$4699

Your purchase includes a print-ready PDF report and its corresponding data in Excel format. This combination is particularly valuable for entities planning to undertake tailored, concise research initiatives related to the report’s subject matter.
$5699

Smallform of Sample request

Have a question?

User Profile

Don’t settle for less – trust Mitul to help you find the best solution.

Report delivery within 24 to 48 hours

– Other Info –

What people say?-

User Review

I am very impressed with the information in this report. The author clearly did their research when they came up with this product and it has already given me a lot of ideas.

Jana Schmidt
CEDAR CX Technologies

– Connect with us –

Phone

+91 6232 49 3207


support

24/7 Research Support


sales@credenceresearch.com

– Research Methodology –

Going beyond the basics: advanced techniques in research methodology

– Trusted By –

Pepshi, LG, Nestle
Motorola, Honeywell, Johnson and johnson
LG Chem, SIEMENS, Pfizer
Unilever, Samsonite, QIAGEN