Market Overview:
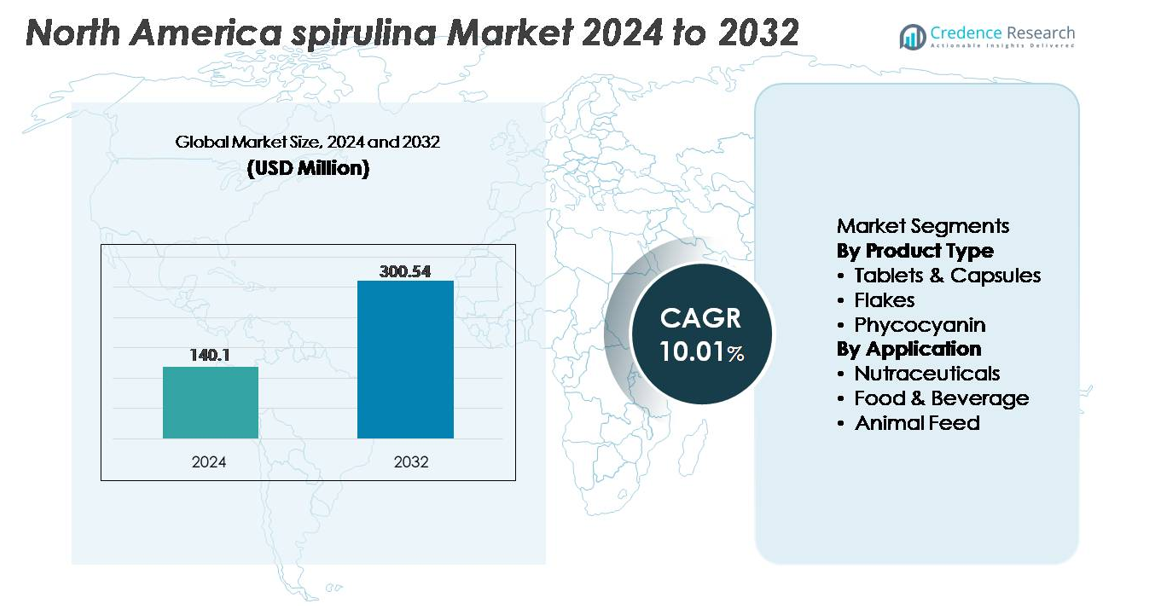
The North America spirulina market was valued at USD 140.1 million in 2024 and is projected to reach USD 300.54 million by 2032, registering a CAGR of 10.01% over the forecast period.
| REPORT ATTRIBUTE |
DETAILS |
| Historical Period |
2020-2023 |
| Base Year |
2024 |
| Forecast Period |
2025-2032 |
| North America Spirulina Market Size 2024 |
USD 140.1 million |
| North America Spirulina Market, CAGR |
10.01% |
| North America Spirulina Market Size 2032 |
USD 300.54 million |
The North America spirulina market features a mix of established ingredient manufacturers and specialized microalgae producers, including Cyanotech Corporation, DOHLER GmbH, Pond Technologies Inc., Givaudan International SA, DDW, Algenol Biofuels Inc., Prolgae Spirulina Supplies Pvt. Ltd., DIC Corporation, Cabassi & Giuriati SpA, Dongtai City Spirulina Bio-engineering Co., Ltd., Sensient Technologies Corporation, E.I.D. Parry Limited, and Echlorial. These companies compete through advancements in pigment extraction, certified-organic cultivation, and diversified product portfolios serving nutraceutical, food and beverage, and natural colorant applications. The United States leads the North American market with approximately 75% share, driven by high consumer demand for plant-based supplements and strong functional food innovation ecosystems, positioning it as the core hub for commercial spirulina development and downstream product integration.
Market Insights:
- The North America spirulina market was valued at USD 140.1 million in 2024 and is projected to reach USD 300.54 million by 2032, registering a CAGR of 10.01% during the forecast period.
- Market growth is primarily driven by rising adoption of plant-based nutrition, expanding use of natural blue colorants in food and beverages, and increasing demand for immunity-supporting ingredients in nutraceuticals.
- Clean-label trends, sustainability-focused product reformulation, and the integration of spirulina in ready-to-drink functional beverages represent key opportunities accelerating product innovation.
- The market remains moderately fragmented, with competition influenced by production capacity, organic certifications, pigment extraction efficiency, distribution networks, and partnerships with supplement and food manufacturers.
- Regionally, the United States leads with nearly 75% share, while the nutraceuticals segment dominates with the largest application share, supported by growing consumption of algae-based dietary supplements.
Access crucial information at unmatched prices!
Request your sample report today & start making informed decisions powered by Credence Research Inc.!
Download Sample
Market Segmentation Analysis:
By Product Type
The North America spirulina market by product type is primarily driven by the dominance of tablets and capsules, which hold the largest market share due to their standardized dosing, ease of distribution through retail and e-commerce channels, and strong acceptance in dietary supplementation. Consumers seeking plant-based protein, antioxidants, and detox support prefer these formats for daily intake. Flakes gain relevance in culinary and smoothie applications appealing to clean-label users, while phycocyanin continues to expand rapidly as a natural coloring agent aligned with the regulatory shift away from synthetic pigments.
- For instance, Cyanotech produces Hawaiian Spirulina Pacifica tablets in 500 mg formats and manufactures more than 200 million tablets annually, supporting high-volume nutraceutical distribution.
By Application
The market by application is led by the nutraceuticals segment, representing the most significant share fueled by demand for natural immunity boosters, vegan protein alternatives, and algae-based wellness supplements. Spirulina’s high nutritional profile supports its widespread integration into capsules, powders, and functional blends. The food and beverage segment grows as brands incorporate natural pigments and plant-based additives into snacks and beverages, whereas animal feed adoption rises as sustainable aquafeed and premium pet nutrition producers seek alternatives that improve pigmentation, nutrient absorption, and overall health performance.
- For instance, Cyanotech produces Hawaiian Spirulina with protein content levels reaching approximately 60–70 grams per 100 grams, enabling high-value incorporation into nutraceutical products for athletic performance and immune support.
Key Growth Drivers:
Rising Adoption of Plant-Based Nutrition and Functional Supplements
The growing shift toward plant-based and vegan dietary patterns in North America strongly supports spirulina demand as consumers seek natural, complete-protein alternatives with immunity and antioxidant benefits. Spirulina contains all essential amino acids, vitamins, and minerals, positioning it as a concentrated superfood ingredient for functional supplements, powders, and ready-to-mix formulations. The strong market presence of plant-based protein beverages, collagen alternatives, and wellness shots reinforces consumable algae-based products. Increased focus on preventive healthcare and the proliferation of personalized dietary supplements through e-commerce further enhance uptake. Moreover, consumer perception favoring non-GMO, sustainable, and minimally processed ingredients amplifies spirulina’s value proposition versus traditional animal-based proteins. Manufacturers capitalize by introducing flavored, chewable, gummy, and blend-based spirulina formats targeting fitness, detox, and immune support categories. Partnerships between nutraceutical brands and digital health platforms enhance product visibility and influence purchase decisions. This trend firmly positions spirulina as a mainstream component of modern nutrition and wellness ecosystems.
- For instance, Cyanotech’s Hawaiian Spirulina delivers protein content ranging between 60 to 70 grams per 100 grams, making it comparable to high-density conventional protein sources while remaining plant-derived.
Growing Use of Natural Colorants in Food and Beverage Manufacturing
Demand for natural, clean-label colorants is a significant driver as food and beverage manufacturers transition away from synthetic dyes due to regulatory tightening and heightened consumer scrutiny of chemical additives. Spirulina-derived phycocyanin offers a vibrant blue pigment suitable for confectionery, dairy, bakery, beverages, and plant-based desserts, aligning with transparency-focused branding strategies. Brands increasingly leverage algae-based pigments to enhance product appeal while maintaining ingredient safety, especially in children-oriented categories and organic-certified goods. The rise in fortified snacks, protein bars, and naturally colored beverages expands the addressable market. Innovations in stabilization techniques now enable phycocyanin to maintain color integrity under wider processing conditions, including high-moisture and refrigerated products. Retailers prioritizing label simplicity and allergen-free formulations favor spirulina pigments due to their non-synthetic profile. As North American consumers reward natural alternatives with brand loyalty, spirulina colorant integration accelerates among private labels and major food conglomerates, strengthening its industrial adoption.
- For instance, Givaudan’s natural blue ingredient portfolio demonstrates phycocyanin stability that allows coloring of beverages with pH as low as 3.5, enabling broader application in acidic drink categories previously unsuitable for algae-based colorants.
Sustainability Advantages and Expanding Role in Animal and Aquaculture Feed
Spirulina’s sustainable production attributes-requiring less land, freshwater, and resources compared to traditional protein sources-drive its incorporation in animal feed, particularly in premium aquaculture and pet food segments. Growing environmental pressures and rising protein costs motivate producers to seek efficient and climate-resilient feed inputs. Spirulina improves pigmentation, immunity, and growth performance in shrimp, salmon, ornamental fish, and poultry, enabling value-added feed formulations. Consumer demand for natural and antibiotic-free meat and seafood enhances algae-based feed acceptance. Pet owners increasingly prefer superfood-enriched diets for digestive and skin-health benefits, expanding spirulina’s role in specialty pet nutrition. Certification programs and carbon-footprint reporting further incentivize its use as a responsible alternative to fishmeal or soy. As feed innovators develop encapsulated and high-protein spirulina variants, commercial viability strengthens. The ingredient’s alignment with circular farming models and rising sustainability disclosures reinforces its strategic relevance across North America’s evolving livestock and aquaculture industries.
Key Trends & Opportunities:
Expansion of Clean-Label Functional Foods and Ready-to-Drink Wellness Products
A major trend reshaping the spirulina market is its expanding use in functional beverages, protein shots, fortified snack bars, and plant-based dairy alternatives. Health-conscious consumers seek products with recognizable, minimal ingredients and evidence-backed benefits such as immunity support, detox enhancement, and anti-fatigue functions. Spirulina enables visual differentiation and nutritional enhancement in ready-to-drink formats gaining traction through health-focused cafés and co-branded fitness initiatives. Emerging opportunities include integrating spirulina into fermented beverages, energy tonics, and prebiotic blends supporting gut health. Foodservice, quick-service restaurants, and craft beverage manufacturers adopt algae components to meet the rising demand for visually appealing, nutritionally dense superfood offerings. Social media-driven wellness trends and influencer-led product launches amplify brand reach and accelerate mainstream adoption. The capacity to diversify flavor profiles and mask algae taste through natural extracts further unlocks opportunities for widespread culinary and beverage utilization beyond niche health communities.
- For instance, Givaudan’s natural color platform demonstrates phycocyanin stability sustained for up to 180 days in cold-fill beverage applications, according to the company’s technical documentation, enabling extended shelf-life viability for naturally pigmented drinks.
Technological Advancements in Microalgae Cultivation and Extraction
Technological breakthroughs in closed-loop cultivation systems, controlled LED illumination, precision nutrient dosing, and downstream extraction are improving spirulina’s yield, purity, and cost efficiency. These advancements mitigate contamination risks, reduce water inputs, and optimize pigment and protein concentration, enabling industrial-scale production with consistent quality. Automation and AI-enabled monitoring systems enhance growth cycles and lower operational costs for North American producers facing labor and energy constraints. Innovative extraction techniques increase phycocyanin stability and broaden use across acidic beverages and heat-intensive processing. Additionally, research into hybrid algal farming integrated with renewable energy and wastewater recovery presents economic and environmental benefits. Technology partnerships between biotech firms and food and neutraceutical manufacturers accelerate commercialization of high-value spirulina derivatives. The potential to produce customized strains and tailored nutrient profiles creates opportunities in specialized therapeutics, advanced sports nutrition, and personalized supplement formulations.
- For instance, Pond Technologies reports that its AI-enhanced bioreactors can optimize CO₂ utilization to capture up to 2 metric tons of CO₂ for every metric ton of algae biomass produced, demonstrating measurable sustainability and productivity benefits.
Key Challenges:
High Production Costs and Price Sensitivity Across End-User Industries
Despite its advantages, spirulina production remains cost-intensive due to controlled cultivation conditions, energy requirements, and advanced extraction processes. These costs limit price competitiveness against conventional protein sources and synthetic colorants. Small and mid-sized brands in price-sensitive categories often reconsider formulation due to high ingredient input pricing. Capital investment for automation and contamination-prevention systems creates barriers for new manufacturers. Seasonal energy fluctuations and facility maintenance further impact margins. The market must navigate cost rationalization strategies, including renewable energy integration, improved technology scalability, and optimized supply chains. Without downward pricing mobility, manufacturers may shift toward cheaper additives or reduce spirulina inclusion levels, affecting downstream growth. As consumer willingness to pay varies across product categories, pricing challenges persist until cost-structure efficiencies fully materialize.
Flavor, Shelf-Stability, and Formulation Constraints Limiting Broader Acceptance
Taste, odor, and solubility limitations represent ongoing challenges in spirulina adoption across mainstream food categories. The algae’s inherent earthy or marine-like profile requires masking, especially in mild-flavored beverages or confectionery formats where sensory impact is critical. Stability challenges persist for phycocyanin pigments exposed to heat, pH extremes, or prolonged light exposure, restricting application versatility. Addressing these issues often necessitates additional stabilizers or encapsulation, increasing formulation complexity and cost. Shelf-life variability in natural products further challenges logistics and brand consistency. While research continues to improve extraction purity and pigment resilience, consumer sensitivity to texture and aftertaste remains influential. Manufacturers must invest in formulation science, flavor integration, and microencapsulation technologies to achieve mass-market acceptance. Overcoming these technical barriers is crucial for spirulina’s expansion beyond niche categories into large-volume, everyday consumer packaged goods.
Regional Analysis:
United States
The United States accounts for the lion’s share of the North America spirulina market, commanding roughly 75% of regional revenue. This dominance stems from high consumer awareness of health and wellness, a large base of nutraceutical and dietary-supplement users, and well-established distribution channels through retail and e-commerce. Strong regulatory support for supplements, coupled with high disposable incomes and widespread acceptance of plant-based nutrition, fuels demand for spirulina in tablets, capsules, powders, and functional food ingredients. U.S. manufacturers and brands also lead in innovation-especially in formulation of spirulina-rich nutraceuticals and clean-label food & beverage products -reinforcing its position as the largest regional market.
Canada
Canada represents approximately 15% of the North America spirulina market, benefiting from rising consumer interest in natural and organic supplements, sports nutrition, and clean-label dietary products. Growing health awareness, increased demand for immune-supporting and plant-based foods, and a trend toward preventive wellness among Canadians support moderate but steady spirulina adoption. Regulatory standards and product quality expectations are high, which encourages suppliers to offer human-grade spirulina powders, capsules, and phycocyanin extracts. While total market volume remains smaller than in the U.S., Canada’s growth is reinforced by a consumer base open to premium, sustainable and clean-label formulations.
Mexico
Mexico currently accounts for a smaller but growing portion- likely 5% -of the North America spirulina market. Growth is driven by rising health consciousness, expanding middle-class incomes, and gradual adoption of nutraceuticals and functional foods. As access to dietary supplements increases via retail and online channels, Mexican consumers are becoming more receptive to spirulina’s protein, vitamin and antioxidant benefits. Additionally, manufacturers are exploring opportunities in affordable supplement formats (e.g., tablets, powders) to cater to cost-sensitive segments. Although spirulina penetration is lower than in the U.S. or Canada, Mexico shows promising growth potential as awareness of plant-based nutrition gains traction.
Rest of North America (Caribbean, smaller territories, smaller markets)
The “Rest of North America” region-including Caribbean nations and non-core markets -contributes a minor share (likely under 5%) to the overall regional spirulina market. Demand is limited by lower purchasing power, less established supplement infrastructure, and limited consumer awareness of spirulina benefits. However, niche growth may emerge via imports and specialty retailers targeting health-conscious consumers, expatriate communities, and premium segments. As global supply chains and e-commerce expand, these smaller markets could gradually see increased exposure-though overall volume will remain modest compared to the major markets of the U.S., Canada, and Mexico.
Market Segmentations:
By Product Type
- Tablets & Capsules
- Flakes
- Phycocyanin
By Application
- Nutraceuticals
- Food & Beverage
- Animal Feed
By Geography
- United States
- Canada
- Mexico
- Rest of North America
Competitive Landscape:
The competitive landscape of the North America spirulina market is moderately fragmented, comprising established nutraceutical companies, microalgae cultivation enterprises, phycocyanin extraction specialists, and emerging clean-label ingredient suppliers. Competitors differentiate through proprietary growing systems, purity grades, organic certification, and pigment stability enhancements tailored for food and beverage processors. U.S.-based producers benefit from advanced closed-loop cultivation and sustainable aquaculture models that reduce water and energy dependency, while Canadian players focus on premium, certified-organic spirulina for health and wellness applications. Strategic collaboration with food manufacturers, supplement brands, and private labels drives co-development of customized formulations. Marketing through e-commerce, subscription nutrition services, and influencer-led wellness initiatives expands brand visibility. Competitive strategies focus on expanding production capacity, improving cost efficiency, and enhancing taste-neutral or flavored spirulina formats. As sustainability and traceability expectations rise, companies integrating carbon reporting, clean extraction processes, and regenerative farming approaches strengthen their market positioning.
Shape Your Report to Specific Countries or Regions & Enjoy 30% Off!
Key Player Analysis:
- Cyanotech Corporation
- DOHLER GmbH
- Pond Technologies Inc.
- Givaudan International SA
- DDW
- Algenol Biofuels Inc.
- Prolgae Spirulina Supplies Pvt. Ltd.
- DIC Corporation
- Cabassi & Giuriati SpA
- Dongtai City Spirulina Bio-engineering Co., Ltd.
Recent Developments:
- In June 2025,Cyanotech Corporation In its Q4 and FY2025 earnings broadcast, Cyanotech reported a 53% year-on-year increase in bulk spirulina sales, highlighting stronger demand for its Hawaiian Spirulina Pacifica products in bulk channels. In its FY2025 annual report, the company also confirmed that Hawaiian Spirulina Pacifica is now offered in three formats-powder, tablets, and gummies-after introducing spirulina gummies in 2024 to expand consumer-focused formats.
- In April 2025,Pond Technologies (Ontario, Canada) announced plans to integrate artificial intelligence into its algae-growing control systems to optimize parameters such as light, nutrients and CO₂ absorption.
- In February 2024, Döhler North America announced a major expansion of its Cartersville, Georgia plant, doubling capacity and adding advanced production lines for compounds, extracts and syrups to better serve the Americas. This expanded footprint supports its natural colour portfolio, including Sapphire Blue and Olivine Green systems that use spirulina and gardenia as key color sources for clean-label food and beverage applications.
Report Coverage:
The research report offers an in-depth analysis based on Product type, Application and Geography. It details leading market players, providing an overview of their business, product offerings, investments, revenue streams, and key applications. Additionally, the report includes insights into the competitive environment, SWOT analysis, current market trends, as well as the primary drivers and constraints. Furthermore, it discusses various factors that have driven market expansion in recent years. The report also explores market dynamics, regulatory scenarios, and technological advancements that are shaping the industry. It assesses the impact of external factors and global economic changes on market growth. Lastly, it provides strategic recommendations for new entrants and established companies to navigate the complexities of the market.
Future Outlook:
- Demand for spirulina will rise as consumers increasingly prioritize plant-based and clean-label nutrition.
- Adoption will strengthen in functional beverages, fortified snacks, and natural-color product formulations.
- Technological advancements in algae cultivation will lower production costs and improve nutrient consistency.
- Phycocyanin will gain greater traction as a preferred natural blue colorant in mainstream food brands.
- Partnerships between algae producers and nutraceutical companies will accelerate customized formulation development.
- Premium pet food and aquafeed applications will expand as sustainable protein alternatives gain acceptance.
- Regulatory support for natural additives and organic supplements will further enhance market penetration.
- E-commerce and subscription wellness programs will broaden consumer access and recurring demand.
- Flavor masking and encapsulation technologies will improve spirulina palatability in mass-market foods.
- Sustainability reporting and carbon footprint reduction targets will position algae-based ingredients as strategic priorities for manufacturers.



