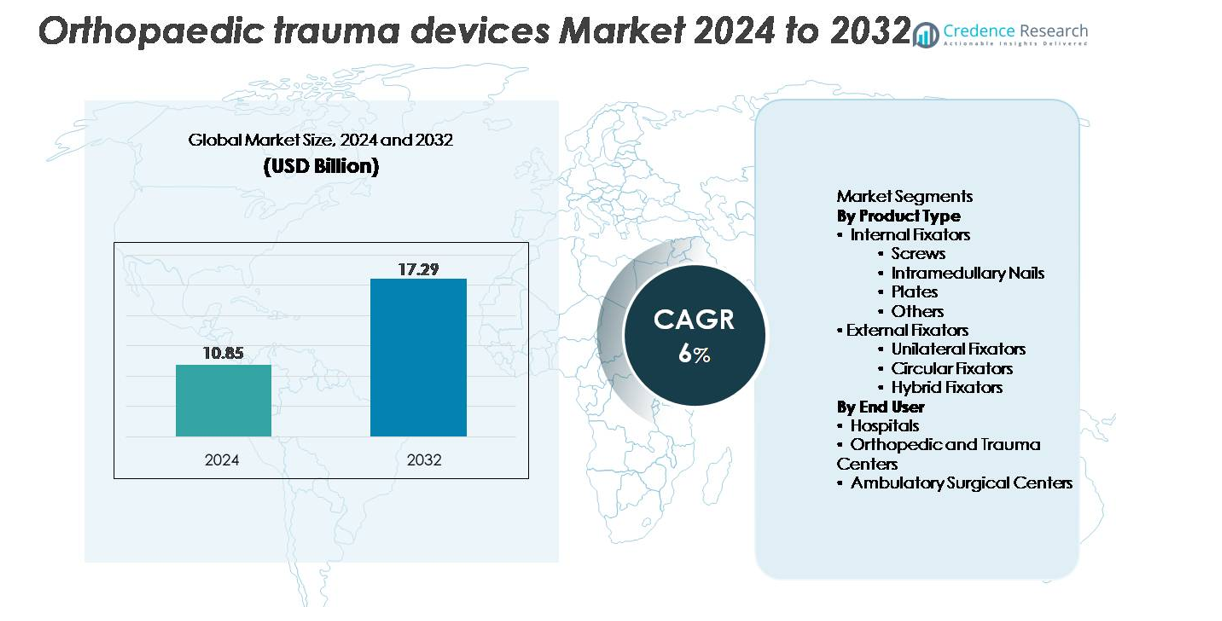
Home » Medical Devices » Orthopaedic Trauma Devices Market

Orthopaedic Trauma Devices Market By Product Type (Internal Fixators, External Fixators) By End User (Hospitals, Orthopedic and Trauma Centers, Ambulatory Surgical Centers)-Growth, Future Prospects & Competitive Analysis, 2016 – 2030

Price: $4999

Published: | Report ID: 18473 | Report Format : PDF

Key Highlights of the Report

The global orthopedic trauma devices market is segmented by product type, end-user, and region. Internal fixators are the most used product type, as it assists in the stability and alignment of shattered bones. The hospital segment is the dominating segment due to the presence of skilled professionals and required devices for fatal orthopedic treatments, with North America leading the market growth.

The global orthopedic trauma devices market has several drivers. The market is anticipated to grow rapidly as a result of a rise in the frequency of minor fractures and catastrophic, life-threatening injuries. The rise in accidents, other fatalities, and trauma are other significant factors supporting the expansion of the global market regarding traffic accidents, slips and falls, rising rates of osteoarthritis, and orthopedic sports injuries.

Nonetheless, the global orthopedic trauma devices market offers significant growth opportunities, including huge growth potential in the Asia Pacific region and the increasing adoption of orthopedic trauma devices in hospitals and orthopedic centers. Moreover, new developments in orthopedic trauma devices will further p[promote the market.

Market Overview

The global orthopedic trauma devices market has witnessed steady growth in recent years and is expected to continue growing at a CAGR of 6.2% between 2023 and 2030. The market was valued at USD 9.1 million in 2022 and is expected to reach USD 13.9 million in 2030.

What Are The Main Drivers Of The Global Orthopaedic Trauma Devices Market?

Over the next few years, the rising number of sports injuries, fractures, and traffic accidents is anticipated to drive up demand for orthopedic trauma medical devices. The strong local player presence of major international players in their respective markets is another important factor for the sales of orthopedic trauma products through localized marketplaces.

Design Element 2

Access crucial information at unmatched prices!

Request your free sample report today & start making informed decisions powered by Credence Research!

Download Free Sample
CTA Design Element 3

What Are The Major Challenges Faced By The Global Orthopaedic Trauma Devices Market?

The global orthopedic trauma devices market also faces several challenges; Major challenges and drawbacks of fixators include the potential for joint contractures, a protracted bone-healing period, and a higher risk of infection at the sites where pins and wires are inserted into the body. The material chosen for the implants used to address orthopedic issues must also be carefully considered, just like with any other implant. The implants themselves may lead to bone fractures, abnormalities, or insufficient bone healing if the incorrect material is chosen.

What Are The Growth Opportunities In The Global Orthopaedic Trauma Devices Market?

The global orthopedic trauma devices market offers significant growth opportunities; Even if orthopedics has not yet been completely studied, the rapid breakthroughs and use of 3D printing technology are considerably improving orthopedics. Polymers are one of the most often used materials in 3D printed orthopedic implants because they are potentially used as gels for direct ink writing, solutions for stereolithography equipment, and filaments for fused deposition modeling.

Executive Summary

Overview of the Global Orthopaedic Trauma Devices Market

The global orthopedic trauma devices market has steadily grown in recent years, driven by regulations requiring the distribution of secure medical equipment for end users. Orthopedic trauma devices are in high demand as cases of rheumatoid arthritis and osteoarthritis rise. Market expansion is also anticipated to be aided by rising demand for sensor-integrated orthopedic trauma devices.

Market Definition

Orthopedic trauma diseases are treated with orthopedic trauma devices, which are medical equipment. Joints, ligaments, tendons, and muscles are typically affected by orthopedic trauma. One of the key elements driving the market’s expansion is the rise in the incidence of osteoarthritis. Another factor driving market expansion is the increase in applications from developing nations. Continuous technological development and innovation of new tools, rising consumer awareness of the advantages of minimally invasive surgery, rising product launches, an increase in fractures and road accidents, and untapped potential in emerging markets will all contribute to the creation of lucrative market growth opportunities.

Orthopaedic Trauma Devices Market

Market Insights

  • The global demand for orthopedic trauma devices was valued at USD 9.1 Billion in 2022 and is expected to reach USD 13.9 Billion in 2030, growing at a CAGR of 6.2% between 2023 and 2030.
  • The internal fixator is the leading segment by product type and held over 60% share in value in 2022, while the external fixator segment is likely to exhibit a significant CAGR during the forecast period.
  • The hospital segment governs the demand for orthopedic trauma devices globally, holding a massive share of over 45% in 2022, and is expected to grow at a rapid CAGR.
  • The orthopedic and trauma centers segment will post the highest CAGR during the forecast period.
  • North America is fueling the growth of the orthopedic trauma devices industry with an over one-third share in 2022, while Asia Pacific and Europe collectively accounted for just under 50% share in 2022. Europe held over 22% share in 2022.
  • Growing innovation in technology and tools promotes orthopedic trauma device growth.
  • The huge growth potential in Asia Pacific is creating major opportunities in the market.

Segmentation by Product Type

  • In 2022, the internal fixator category dominated the market growth for orthopedic trauma devices, and it is anticipated that the segment will see the fastest increase over the following five years.
  • Internal fixators are frequently used to repair bone deformities and fractures due to the development of sterile surgical procedures, significantly reducing the risk of infection.
  • Internal fixation also expedites healing, allows patients to resume everyday activities sooner, and reduces the possibility that the broken bones would heal wrongly.

Segmentation by Application

  • The hospital segment dominated the orthopedic trauma devices market revenue in 2022 and is anticipated to increase at a quicker rate over the forecast period of 2022–2030.
  • The prevalence of trauma and injury worldwide and the use of less intrusive procedures have led to the usage of orthopedic treatment approaches in institutional settings.
  • The availability of trained personnel and equipment to aid in surgical procedures also contributes to the hospital sector’s increased market share.

Segmentation by Region

  • North America is fuelling the growth of the orthopedic trauma devices industry with over one-third share in 2022.
  • Asia Pacific and Europe collectively account for just under 50% share in 2022, with Europe holding over 22% share in the same year.
  • The rest of the world, including Latin America, The Middle East, and Africa, contributes the remainder to the demand for algal polysaccharides.

The need for orthopedic trauma medical equipment is expected to increase over the coming years because of the increased in sports injuries, fractures, and auto accidents. Another crucial element in the sales of orthopedic trauma products through regional marketplaces is the significant local player presence of big international players in their particular areas.

In 2022, the US held a market share of roughly 95.5% in North America. Due to the increased incidence of chronic pain, arthritis, low back pain, and neck pain, the US market has a sizable part of the global market. In addition, factors driving the growth of the overall market include the rising elderly population in the nation, increased awareness of orthopedic operations, and the availability of government reimbursements.

In 2022, China had a market share of approximately 10.1%. In China, fractures affect 4.41 million people annually on average. Due to China’s aging population, rapid economic development, industrialization, urbanization, and other causes, traumatic fractures will likely increase substantially shortly.

Even though orthopedics has yet to be thoroughly investigated, the field is rapidly advancing thanks to 3D printing technology. Because of their potential for usage as gels for direct ink writing, solutions for stereolithography equipment, and filaments for fused deposition modeling, polymers are one of the most often utilized materials in 3D-printed orthopedic implants.

The main difficulties and disadvantages of fixators are the possibility of joint contractures, a prolonged bone-healing period, and a higher risk of infection at the places where pins and wires are put into the body.

Increased prevalence of osteoporosis will drive market expansion

The prevalence of osteoporosis and other degenerative bone diseases is increasing, driving up market revenue for orthopedic trauma devices. According to the International Osteoporosis Foundation (2021), more than 8.9 million fractures occur yearly due to osteoporosis. According to additional information in the article, one in five men and one in three women over 50 are at risk for fractures due to weak bones. Osteoporotic bones deteriorate over time, becoming less thick, brittle, and susceptible to fracture. Degenerative bone diseases like osteoporosis cause bone fractures in the musculoskeletal system, increasing the demand for orthopedic trauma devices to treat bone-related disorders. This is driving up demand for orthopedic trauma devices. As a result, this aspect is boosting the orthopedic trauma devices market CAGR.

Rise in traffic injuries and technological developments.

Another significant factor propelling the market for orthopedic trauma devices is increased traffic injury incidents. The primary cause of death for children and young adults between the ages of 5 and 29 is road traffic accidents, according to the World Health Organisation brief (2021) on road traffic injuries. The same factsheet estimates that between 20 and 50 million people worldwide sustain disabilities as a result of non-fatal injuries in automobile accidents. Such injuries may seriously harm the limbs, depending on where the trauma originates. Since traffic-related injuries and accidents are expected to increase, it is predicted that demand for orthopedic trauma devices will rise as well, eventually driving the market throughout the forecast period.

The increase in outpatient surgeries and the introduction of cutting-edge product concepts drive the market for orthopedic trauma devices. The fast development of hip, knee, and spine replacement products in terms of functionality and design, including smart implants with integrated sensors for real-time data processing and metal-on-metal and metal-on-ceramic implants, is driving the market. Developing tissue engineering and gene editing technology also contributes to the industry’s expansion. Industry players are conducting extensive studies on the absorbable polymer since it encourages rapid recovery without the risk of metal corrosion, ultimately driving the market during the forecast.

Limitation of fixators

External fixation or joint replacements may be options for long-bone fractures instead of internal treatment, depending on where the fracture is. The risk of infection and the size of the functioning output are limitations that vary depending on the surgery. Whether wound treatment and debridement are handled with intramedullary nailing or external fixation, the risk of infection remains the same. Other disadvantages of external fixators include the potential for joint contractures, a protracted bone-healing period, and a higher risk of infection at the locations where pins and wires are inserted into the body.

Material Used for implants

The material chosen for the implants used to address orthopedic issues must also be carefully considered, just like with any other implant. The implants themselves may lead to bone fractures, abnormalities, or insufficient bone healing if the incorrect material is chosen. The three categories of biomaterials—ceramics, metals, and polymers—have all been used to treat bone deformities and fractures, and each has advantages and limitations regarding the applications that can be used for them.

Development of novel materials for implants

At the moment, polymers, metal, and bioceramics are the most frequently used materials in orthopedics. According to recent data, biomedical nanotechnology is getting a lot of attention. Magnesium alloys have recently become the research subject because of their biocompatibility and acceptable mechanical properties. Mg-based metal alloys produce contemporary biodegradable metal products with good osseointegration characteristics. The research will continue to concentrate on the creation of alloys with a slow rate of degradation and higher mechanical strength to address load-bearing zone fractures.

Deployment of 3D printing technology

Even if orthopedics has not yet been completely studied, the rapid breakthroughs and use of 3D printing technology are considerably improving orthopedics. Polymers are one of the most often used materials in 3D printed orthopedic implants because they are potentially used as gels for direct ink writing, solutions for stereolithography equipment, and filaments for fused deposition modeling. Studies on the viability of using desktop 3D printers to duplicate surgical implant models from biocompatible materials showed decreased production costs. Still, they could not achieve mechanical attributes on par with traditional stainless-steel implants. In orthopedics, materials that can be 3D printed can be used to create life-size anatomical models and implants. A growing study on the applicability of improved treatments for orthopedic trauma has been done in light of the acceptability of adopting 3D printing technologies for developing customized implants and using nanotechnology-based biomaterials for implant materials.

Competitive Landscape

Key Players

The global orthopedic trauma devices market is highly competitive, with several key players. Some of the major players in the market and their market share are as follows:

  • Medical Devices Business Services, Inc.,
  • Stryker
  • Zimmer Biomet
  • Smith & Nephew plc
  • B. Braun Melsungen AG
  • CONMED Corporation
  • Orthofix Holdings, Inc.
  • Integra LifeSciences Corporation
  • Citieffe s.r.l.
  • Acumed LLC
  • Wright Medical Group NVNV.
  • Invibio Ltd, Biotek., Auxein Medical
  • Medtronic
  • NuVasive, Inc,
  • Others

To stay ahead, these companies focus on product innovation, expanding their distribution channels, and mergers and acquisitions. The major players in the global orthopedic trauma devices market constantly strive to stay ahead by introducing new products and innovations.

In June 2021, Zimmer Biomet trauma implants with Bactiguard coating were available in select EMEA regions.

Stryker’s Trauma & Extremities division unveiled the CitrelockTM Tendon Fixation Device System in September 2021. Through a tendon thread constructed of CitregenTM, a resorbable material with unique chemical and mechanical properties for orthopedic surgical applications, the new system provides surgeons with a distinctive design.

Shape Your Report to Specific Countries or Regions & Enjoy 30% Off!

Summary of Key Findings

  • Growing prevalence of osteoarthritis across various end-use sectors driving market growth
  • Developing novel implant materials will further promote the growth of orthopedic trauma devices.
  • Asia Pacific is the fastest-growing orthopedic trauma device market due to increasing traffic accidents in developing countries.

Future Outlook

  • Positive outlook for the global orthopedic trauma devices market with significant growth potential in the Asia Pacific region
  • Increasing adoption of orthopedic trauma devices in the orthopedic and trauma centers industry to drive growth
  • Key players to focus on product innovation, expanding market reach and maintaining competitive pricing to stay ahead.

Segmentation

  • By Product Type
    • Internal Fixators
    • External Fixators
  • By End User
    • Hospitals
    • Orthopedic and Trauma Centers
    • Ambulatory Surgical Centers
  • By Region
  • North America
    • The US
    • Canada
    • Mexico
  • Europe
    • Germany
    • France
    • The UK
    • Italy
    • Spain
    • Rest of Europe
  • Asia Pacific
    • China
    • Japan
    • India
    • South Korea
    • South-east Asia
    • Rest of Asia Pacific
  • Latin America
    • Brazil
    • Argentina
    • Rest of Latin America
  • Middle East & Africa
    • GCC Countries
    • South Africa
    • Rest of the Middle East and Africa

1. Preface
1.1. Report Description
1.1.1. Purpose of the Report
1.1.2. Target Audience
1.1.3. USP and Key Offerings
1.2. Research Scope
1.3. Research Methodology
1.3.1. Phase I – Secondary Research
1.3.2. Phase II – Data Modelling
1.3.2.1. Company Share Analysis Model
1.3.2.2. Revenue Based Modelling
1.3.3. Phase III – Primary Research
1.3.4. Research Limitations
1.3.5. Assumptions
1.4. Market Introduction
1.5. Market Research Scope

2. Executive Summary
2.1. Market Snapshot: Orthopedic Trauma Devices Market
2.2. Orthopedic Trauma Devices Market, By Product
2.3. Orthopedic Trauma Devices Market, By End User
2.4. Orthopedic Trauma Devices Market, By Region

3. Market Dynamics & Factors Analysis
3.1. Introduction
3.1.1. Orthopedic Trauma Devices Market Value, 2017-2030, (US$ Bn)
3.1.2. Y-o-Y Growth Trend Analysis
3.2. Market Dynamics
3.2.1. Market Drivers
3.2.1.1. Driver 1
3.2.1.2. Driver 2
3.2.1.3. Driver 3
3.2.2. Market Restraints
3.2.2.1. Restraint 1
3.2.2.2. Restraint 2
3.2.3. Market Opportunities
3.2.3.1. Opportunity 1
3.2.3.2. Opportunity 2
3.2.4. Major Industry Challenges
3.2.4.1. Challenge 1
3.2.4.2. Challenge 2
3.3. Growth and Development Patterns
3.4. Investment Feasibility Analysis
3.5. Market Opportunity Analysis
3.5.1. Product
3.5.2. End User
3.5.3. Geography

4. Premium Insights
4.1. STAR (Situation, Task, Action, Results) Analysis
4.2. Porter’s Five Forces Analysis
4.2.1. Threat of New Entrants
4.2.2. Bargaining Power of Buyers/Consumers
4.2.3. Bargaining Power of Suppliers
4.2.4. Threat of Substitute Types
4.2.5. Intensity of Competitive Rivalry
4.3. Key Market Trends
4.3.1. Demand Side Trends
4.3.2. Supply Side Trends
4.4. Value Chain Analysis
4.5. Technology Analysis
4.6. Analysis and Recommendations
4.7. Marketing Strategy Analysis
4.7.1. Direct Marketing
4.7.2. Indirect Marketing
4.7.3. Marketing Channel Development Trend

5. Market Positioning of Key Players, 2022
5.1. Company market share of key players, 2022
5.2. Competitive Benchmarking
5.3. Market Positioning of Key Vendors
5.4. Geographical Presence Analysis
5.5. Major Strategies Adopted by Key Players
5.5.1. Key Strategies Analysis
5.5.2. Mergers and Acquisitions
5.5.3. Partnerships
5.5.4. Product Launch
5.5.5. Geographical Expansion
5.5.6. Others

6. Economic Impact Analysis
6.1. Recession Impact
6.1.1. North America
6.1.2. Europe
6.1.3. Asia Pacific
6.1.4. Latin America
6.1.5. Middle East and Africa
6.2. Ukraine-Russia War Impact
6.2.1. North America
6.2.2. Europe
6.2.3. Asia Pacific
6.2.4. Latin America
6.2.5. Middle East and Africa
6.3. COVID-19 Impact Analysis
6.3.1. North America
6.3.2. Europe
6.3.3. Asia Pacific
6.3.4. Latin America
6.3.5. Middle East and Africa

7. Orthopedic Trauma Devices Market, By Product
7.1. Orthopedic Trauma Devices Market Overview, by Product
7.1.1. Orthopedic Trauma Devices Market Revenue Share, By Product, 2022 Vs 2030 (in %)
7.2. Internal Fixators (Screws, Plates, Intermedullary Nails, Others)
7.2.1. Orthopedic Trauma Devices Market, By Region, 2017-2030 (US$ Bn)
7.3. External Fixators (Unilateral Fixators, Circular Fixators, Hybrid Fixators)
7.3.1. Orthopedic Trauma Devices Market, By Region, 2017-2030 (US$ Bn)

8. Orthopedic Trauma Devices Market, by End User, 2017-2030 (US$ Bn)
8.1. Orthopedic Trauma Devices Market Overview, by End User
8.1.1. Orthopedic Trauma Devices Market, By End User, 2022 vs 2030 (in%)
8.2. Hospitals
8.2.1. Orthopedic Trauma Devices Market, By Region, 2017-2030 (US$ Bn)
8.3. Orthopedic and Trauma Centers
8.3.1. Orthopedic Trauma Devices Market, By Region, 2017-2030 (US$ Bn)
8.4. Ambulatory Surgical Centers
8.4.1. Orthopedic Trauma Devices Market, By Region, 2017-2030 (US$ Bn)

9. Orthopedic Trauma Devices Market, By Region
9.1. Orthopedic Trauma Devices Market Overview, by Region
9.1.1. Orthopedic Trauma Devices Market, By Region, 2022 vs 2030 (in%)
9.2. Product
9.2.1. Orthopedic Trauma Devices Market, By Product, 2017-2030 (US$ Bn)
9.3. End User
9.3.1. Orthopedic Trauma Devices Market, By End User, 2017-2030 (US$ Bn)

10. North America Orthopedic Trauma Devices Market Analysis
10.1. North America Orthopedic Trauma Devices Market, by Product, 2017-2030(US$ Bn)
10.1.1. Overview
10.1.2. SRC Analysis
10.2. North America Orthopedic Trauma Devices Market, by End User, 2017-2030(US$ Bn)
10.2.1. Overview
10.2.2. SRC Analysis
10.3. North America Orthopedic Trauma Devices Market, by Country, 2017-2030 (US$ Bn)
10.3.1. North America Orthopedic Trauma Devices Market, by Country, 2022 Vs 2030 (in%)
10.3.2. U.S.
10.3.2.1. U.S. Orthopedic Trauma Devices Market Estimates and Forecast, 2017-2030 (US$ Bn)
10.3.2.2. U.S. Smart Shopping Cart, By Product, 2017-2030 (US$ Bn)
10.3.2.3. U.S. Smart Shopping Cart, By End User, 2017-2030 (US$ Bn)
10.3.3. Canada
10.3.3.1. Canada Orthopedic Trauma Devices Market Estimates and Forecast, 2017-2030 (US$ Bn)
10.3.3.2. Canada Smart Shopping Cart, By Product, 2017-2030 (US$ Bn)
10.3.3.3. Canada Smart Shopping Cart, By End User, 2017-2030 (US$ Bn)
10.3.4. Mexico
10.3.4.1. Mexico Orthopedic Trauma Devices Market Estimates and Forecast, 2017-2030 (US$ Bn)
10.3.4.2. Mexico Smart Shopping Cart, By Product, 2017-2030 (US$ Bn)
10.3.4.3. Mexico Smart Shopping Cart, By End User, 2017-2030 (US$ Bn)

11. Europe Orthopedic Trauma Devices Market Analysis
11.1. Europe Orthopedic Trauma Devices Market, by Product, 2017-2030(US$ Bn)
11.1.1. Overview
11.1.2. SRC Analysis
11.2. Europe Orthopedic Trauma Devices Market, by End User, 2017-2030(US$ Bn)
11.2.1. Overview
11.2.2. SRC Analysis
11.3. Europe Orthopedic Trauma Devices Market, by Country, 2017-2030 (US$ Bn)
11.3.1. Europe Orthopedic Trauma Devices Market, by Country, 2022 Vs 2030 (in%)
11.3.2. Germany
11.3.2.1. Germany Orthopedic Trauma Devices Market Estimates and Forecast, 2017-2030 (US$ Bn)
11.3.2.2. Germany Smart Shopping Cart, By Product, 2017-2030 (US$ Bn)
11.3.2.3. Germany Smart Shopping Cart, By End User, 2017-2030 (US$ Bn)
11.3.3. France
11.3.3.1. France Orthopedic Trauma Devices Market Estimates and Forecast, 2017-2030 (US$ Bn)
11.3.3.2. France Smart Shopping Cart, By Product, 2017-2030 (US$ Bn)
11.3.3.3. France Smart Shopping Cart, By End User, 2017-2030 (US$ Bn)
11.3.4. UK
11.3.4.1. UK Orthopedic Trauma Devices Market Estimates and Forecast, 2017-2030 (US$ Bn)
11.3.4.2. UK Smart Shopping Cart, By Product, 2017-2030 (US$ Bn)
11.3.4.3. UK Smart Shopping Cart, By End User, 2017-2030 (US$ Bn)
11.3.5. Italy
11.3.5.1. Italy Orthopedic Trauma Devices Market Estimates and Forecast, 2017-2030 (US$ Bn)
11.3.5.2. Italy Smart Shopping Cart, By Product, 2017-2030 (US$ Bn)
11.3.5.3. Italy Smart Shopping Cart, By End User, 2017-2030 (US$ Bn)
11.3.6. Spain
11.3.6.1. Spain Orthopedic Trauma Devices Market Estimates and Forecast, 2017-2030 (US$ Bn)
11.3.6.2. Spain Smart Shopping Cart, By Product, 2017-2030 (US$ Bn)
11.3.6.3. Spain Smart Shopping Cart, By End User, 2017-2030 (US$ Bn)
11.3.7. Rest of Europe
11.3.7.1. Rest of Europe Orthopedic Trauma Devices Market Estimates and Forecast, 2017-2030 (US$ Bn)
11.3.7.2. Rest of Europe Smart Shopping Cart, By Product, 2017-2030 (US$ Bn)
11.3.7.3. Rest of Europe Smart Shopping Cart, By End User, 2017-2030 (US$ Bn)

12. Asia Pacific Orthopedic Trauma Devices Market Analysis
12.1. Asia Pacific Orthopedic Trauma Devices Market, by Product, 2017-2030(US$ Bn)
12.1.1. Overview
12.1.2. SRC Analysis
12.2. Asia Pacific Orthopedic Trauma Devices Market, by End User, 2017-2030(US$ Bn)
12.2.1. Overview
12.2.2. SRC Analysis
12.3. Asia Pacific Orthopedic Trauma Devices Market, by Country, 2017-2030 (US$ Bn)
12.3.1. Asia Pacific Orthopedic Trauma Devices Market, by Country, 2022 Vs 2030 (in%)
12.3.2. China
12.3.2.1. China Orthopedic Trauma Devices Market Estimates and Forecast, 2017-2030 (US$ Bn)
12.3.2.2. China Smart Shopping Cart, By Product, 2017-2030 (US$ Bn)
12.3.2.3. China Smart Shopping Cart, By End User, 2017-2030 (US$ Bn)
12.3.3. Japan
12.3.3.1. Japan Orthopedic Trauma Devices Market Estimates and Forecast, 2017-2030 (US$ Bn)
12.3.3.2. Japan Smart Shopping Cart, By Product, 2017-2030 (US$ Bn)
12.3.3.3. Japan Smart Shopping Cart, By End User, 2017-2030 (US$ Bn)
12.3.4. India
12.3.4.1. India Orthopedic Trauma Devices Market Estimates and Forecast, 2017-2030 (US$ Bn)
12.3.4.2. India Smart Shopping Cart, By Product, 2017-2030 (US$ Bn)
12.3.4.3. India Smart Shopping Cart, By End User, 2017-2030 (US$ Bn)
12.3.5. South Korea
12.3.5.1. South Korea Orthopedic Trauma Devices Market Estimates and Forecast, 2017-2030 (US$ Bn)
12.3.5.2. South Korea Smart Shopping Cart, By Product, 2017-2030 (US$ Bn)
12.3.5.3. South Korea Smart Shopping Cart, By End User, 2017-2030 (US$ Bn)
12.3.6. South-East Asia
12.3.6.1. South-East Asia Orthopedic Trauma Devices Market Estimates and Forecast, 2017-2030 (US$ Bn)
12.3.6.2. South-East Asia Smart Shopping Cart, By Product, 2017-2030 (US$ Bn)
12.3.6.3. South-East Asia Smart Shopping Cart, By End User, 2017-2030 (US$ Bn)
12.3.7. Rest of Asia Pacific
12.3.7.1. Rest of Asia Pacific Orthopedic Trauma Devices Market Estimates and Forecast, 2017-2030 (US$ Bn)
12.3.7.2. Rest of Asia Pacific Smart Shopping Cart, By Product, 2017-2030 (US$ Bn)
12.3.7.3. Rest of Asia Pacific Smart Shopping Cart, By End User, 2017-2030 (US$ Bn)

13. Latin America Orthopedic Trauma Devices Market Analysis
13.1. Latin America Orthopedic Trauma Devices Market, by Product, 2017-2030(US$ Bn)
13.1.1. Overview
13.1.2. SRC Analysis
13.2. Latin America Orthopedic Trauma Devices Market, by End User, 2017-2030(US$ Bn)
13.2.1. Overview
13.2.2. SRC Analysis
13.3. Latin America Orthopedic Trauma Devices Market, by Country, 2017-2030 (US$ Bn)
13.3.1. Latin America Orthopedic Trauma Devices Market, by Country, 2022 Vs 2030 (in%)
13.3.2. Brazil
13.3.2.1. Brazil Orthopedic Trauma Devices Market Estimates and Forecast, 2017-2030 (US$ Bn)
13.3.2.2. Brazil Smart Shopping Cart, By Product, 2017-2030 (US$ Bn)
13.3.2.3. Brazil Smart Shopping Cart, By End User, 2017-2030 (US$ Bn)
13.3.3. Argentina
13.3.3.1. Argentina Orthopedic Trauma Devices Market Estimates and Forecast, 2017-2030 (US$ Bn)
13.3.3.2. Argentina Smart Shopping Cart, By Product, 2017-2030 (US$ Bn)
13.3.3.3. Argentina Smart Shopping Cart, By End User, 2017-2030 (US$ Bn)
13.3.4. Rest of Latin America
13.3.4.1. Rest of Latin America Orthopedic Trauma Devices Market Estimates and Forecast, 2017-2030 (US$ Bn)
13.3.4.2. Rest of Latin America Smart Shopping Cart, By Product, 2017-2030 (US$ Bn)
13.3.4.3. Rest of Latin America Smart Shopping Cart, By End User, 2017-2030 (US$ Bn)

14. Middle East and Africa Orthopedic Trauma Devices Market Analysis
14.1. Middle East and Africa Orthopedic Trauma Devices Market, by Product, 2017-2030(US$ Bn)
14.1.1. Overview
14.1.2. SRC Analysis
14.2. Middle East and Africa Orthopedic Trauma Devices Market, by End User, 2017-2030(US$ Bn)
14.2.1. Overview
14.2.2. SRC Analysis
14.3. Middle East and Africa Orthopedic Trauma Devices Market, by Country, 2017-2030 (US$ Bn)
14.3.1. Middle East and Africa Orthopedic Trauma Devices Market, by Country, 2022 Vs 2030 (in%)
14.3.2. GCC Countries
14.3.2.1. GCC Countries Orthopedic Trauma Devices Market Estimates and Forecast, 2017-2030 (US$ Bn)
14.3.2.2. GCC Countries Smart Shopping Cart, By Product, 2017-2030 (US$ Bn)
14.3.2.3. GCC Countries Smart Shopping Cart, By End User, 2017-2030 (US$ Bn)
14.3.3. South Africa
14.3.3.1. South Africa Orthopedic Trauma Devices Market Estimates and Forecast, 2017-2030 (US$ Bn)
14.3.3.2. South Africa Smart Shopping Cart, By Product, 2017-2030 (US$ Bn)
14.3.3.3. South Africa Smart Shopping Cart, By End User, 2017-2030 (US$ Bn)
14.3.4. Rest of Middle East and Africa
14.3.4.1. Rest of Middle East and Africa Orthopedic Trauma Devices Market Estimates and Forecast, 2017-2030 (US$ Bn)
14.3.4.2. Rest of Middle East and Africa Smart Shopping Cart, By Product, 2017-2030 (US$ Bn)
14.3.4.3. Rest of Middle East and Africa Smart Shopping Cart, By End User, 2017-2030 (US$ Bn)

15. Company Profiles
15.1. Medical Devices Business Services, Inc.
15.1.1. Company Overview
15.1.2. Products/Services Portfolio
15.1.3. Geographical Presence
15.1.4. Financial Summary
15.1.4.1. Market Revenue and Net Profit (2019-2022)
15.1.4.2. Business Segment Revenue Analysis
15.1.4.3. Geographical Revenue Analysis
15.2. Stryker
15.3. Zimmer Biomet
15.4. Smith & Nephew plc
15.5. B. Braun Melsungen AG
15.6. CONMED Corporation
15.7. Orthofix Holdings, Inc.
15.8. Integra LifeSciences Corporation
15.9. Citieffe s.r.l.
15.10. Acumed LLC
15.11. Wright Medical Group N.V.
15.12. Invibio Ltd
15.13. Biotek
15.14. Auxein Medical
15.15. Medtronic
15.16. NuVasive, Inc
15.17. 3M
15.18. ALCARE Co., Ltd.
15.19. Bauerfeind USA Inc.
15.20. Essity Aktiebolag (publ)
15.21. Bird & Cronin and Breg, Inc.

List of Figures
FIG. 1 Orthopedic Trauma Devices Market: Research Methodology
FIG. 2 Market Size Estimation – Top Down & Bottom up Approach
FIG. 3 Orthopedic Trauma Devices Market Segmentation
FIG. 4 Orthopedic Trauma Devices Market, by Product, 2022 (US$ Bn)
FIG. 5 Orthopedic Trauma Devices Market, by End User, 2022 (US$ Bn)
FIG. 6 Orthopedic Trauma Devices Market, by Geography, 2022 (US$ Bn)
FIG. 7 Attractive Investment Proposition, by Product, 2022
FIG. 8 Attractive Investment Proposition, by End User, 2022
FIG. 9 Attractive Investment Proposition, by Geography, 2022
FIG. 10 Global Market Share Analysis of Key Orthopedic Trauma Devices Market Manufacturers, 2022
FIG. 11 Global Market Positioning of Key Orthopedic Trauma Devices Market Manufacturers, 2022
FIG. 12 Orthopedic Trauma Devices Market Value Contribution, By Product, 2022 & 2030 (Value %)
FIG. 13 Orthopedic Trauma Devices Market, by Internal Fixators (Screws, Plates, Intermedullary Nails, Others), Value, 2017-2030 (US$ Bn)
FIG. 14 Orthopedic Trauma Devices Market, by External Fixators (Unilateral Fixators, Circular Fixators, Hybrid Fixators), Value, 2017-2030 (US$ Bn)
FIG. 15 Orthopedic Trauma Devices Market Value Contribution, By End User, 2022 & 2030 (Value %)
FIG. 16 Orthopedic Trauma Devices Market, by Hospitals, Value, 2017-2030 (US$ Bn)
FIG. 17 Orthopedic Trauma Devices Market, by Orthopedic and Trauma Centers, 2017-2030 (US$ Bn)
FIG. 18 Orthopedic Trauma Devices Market, by Ambulatory Surgical Centers, Value, 2017-2030 (US$ Bn)
FIG. 19 North America Orthopedic Trauma Devices Market, 2017-2030 (US$ Bn)
FIG. 20 U.S. Orthopedic Trauma Devices Market, 2017-2030 (US$ Bn)
FIG. 21 Canada Orthopedic Trauma Devices Market, 2017-2030 (US$ Bn)
FIG. 22 Europe Orthopedic Trauma Devices Market, 2017-2030 (US$ Bn)
FIG. 23 Germany Orthopedic Trauma Devices Market, 2017-2030 (US$ Bn)
FIG. 24 France Orthopedic Trauma Devices Market, 2017-2030 (US$ Bn)
FIG. 25 U.K. Orthopedic Trauma Devices Market, 2017-2030 (US$ Bn)
FIG. 26 Italy Orthopedic Trauma Devices Market, 2017-2030 (US$ Bn)
FIG. 27 Spain Orthopedic Trauma Devices Market, 2017-2030 (US$ Bn)
FIG. 28 Rest of Europe Orthopedic Trauma Devices Market, 2017-2030 (US$ Bn)
FIG. 29 Asia Pacific Orthopedic Trauma Devices Market, 2017-2030 (US$ Bn)
FIG. 30 China Orthopedic Trauma Devices Market, 2017-2030 (US$ Bn)
FIG. 31 Japan Orthopedic Trauma Devices Market, 2017-2030 (US$ Bn)
FIG. 32 India Orthopedic Trauma Devices Market, 2017-2030 (US$ Bn)
FIG. 33 South Korea Orthopedic Trauma Devices Market, 2017-2030 (US$ Bn)
FIG. 34 South-East Asia Orthopedic Trauma Devices Market, 2017-2030 (US$ Bn)
FIG. 35 Rest of Asia Pacific Orthopedic Trauma Devices Market, 2017-2030 (US$ Bn)
FIG. 36 Latin America Orthopedic Trauma Devices Market, 2017-2030 (US$ Bn)
FIG. 37 Brazil Orthopedic Trauma Devices Market, 2017-2030 (US$ Bn)
FIG. 38 Mexico Orthopedic Trauma Devices Market, 2017-2030 (US$ Bn)
FIG. 39 Rest of Latin America Orthopedic Trauma Devices Market, 2017-2030 (US$ Bn)
FIG. 40 Middle East & Africa Orthopedic Trauma Devices Market, 2017-2030 (US$ Bn)
FIG. 41 GCC Countries Orthopedic Trauma Devices Market, 2017-2030 (US$ Bn)
FIG. 42 South Africa Orthopedic Trauma Devices Market, 2017-2030 (US$ Bn)
FIG. 43 Rest of Middle East and Africa Orthopedic Trauma Devices Market, 2017-2030 (US$ Bn)

List of Tables
TABLE 1 Market Snapshot: Orthopedic Trauma Devices Market
TABLE 2 Orthopedic Trauma Devices Market: Market Drivers Impact Analysis
TABLE 3 Orthopedic Trauma Devices Market: Market Restraints Impact Analysis
TABLE 4 Orthopedic Trauma Devices Market, by Competitive Benchmarking, 2022
TABLE 5 Orthopedic Trauma Devices Market, by Geographical Presence Analysis, 2022
TABLE 6 Orthopedic Trauma Devices Market, by Key Strategies Analysis, 2022
TABLE 7 Orthopedic Trauma Devices Market, by Internal Fixators (Screws, Plates, Intermedullary Nails, Others), By Region, 2017-2022 (US$ Bn)
TABLE 8 Orthopedic Trauma Devices Market, by Internal Fixators (Screws, Plates, Intermedullary Nails, Others), By Region, 2023-2030 (US$ Bn)
TABLE 9 Orthopedic Trauma Devices Market, by External Fixators (Unilateral Fixators, Circular Fixators, Hybrid Fixators), By Region, 2017-2022 (US$ Bn)
TABLE 10 Orthopedic Trauma Devices Market, by External Fixators (Unilateral Fixators, Circular Fixators, Hybrid Fixators), By Region, 2023-2030 (US$ Bn)
TABLE 11 Orthopedic Trauma Devices Market, by Hospitals, By Region, 2017-2022 (US$ Bn)
TABLE 12 Orthopedic Trauma Devices Market, by Hospitals, By Region, 2023-2030 (US$ Bn)
TABLE 13 Orthopedic Trauma Devices Market, by Orthopedic and Trauma Centers, By Region, 2017-2022 (US$ Bn)
TABLE 14 Orthopedic Trauma Devices Market, by Orthopedic and Trauma Centers, By Region, 2023-2030 (US$ Bn)
TABLE 15 Orthopedic Trauma Devices Market, by Ambulatory Surgical Centers, By Region, 2017-2022 (US$ Bn)
TABLE 16 Orthopedic Trauma Devices Market, by Ambulatory Surgical Centers, By Region, 2023-2030 (US$ Bn)
TABLE 17 Orthopedic Trauma Devices Market, by Product, 2017-2022 (US$ Bn)
TABLE 18 Orthopedic Trauma Devices Market, by Product, 2023-2030 (US$ Bn)
TABLE 19 Orthopedic Trauma Devices Market, by End User, 2017-2022 (US$ Bn)
TABLE 20 Orthopedic Trauma Devices Market, by End User, 2023-2030 (US$ Bn)
TABLE 21 Orthopedic Trauma Devices Market, by Region, 2017-2022 (US$ Bn)
TABLE 22 Orthopedic Trauma Devices Market, by Region, 2023-2030 (US$ Bn)
TABLE 23 North America Orthopedic Trauma Devices Market, by Product, 2017-2022 (US$ Bn)
TABLE 24 North America Orthopedic Trauma Devices Market, by Product, 2023-2030 (US$ Bn)
TABLE 25 North America Orthopedic Trauma Devices Market, by End User, 2017-2022 (US$ Bn)
TABLE 26 North America Orthopedic Trauma Devices Market, by End User, 2023-2030 (US$ Bn)
TABLE 27 North America Orthopedic Trauma Devices Market, by Country, 2017-2022 (US$ Bn)
TABLE 28 North America Orthopedic Trauma Devices Market, by Country, 2023-2030 (US$ Bn)
TABLE 29 United States Orthopedic Trauma Devices Market, by Product, 2017-2022 (US$ Bn)
TABLE 30 United States Orthopedic Trauma Devices Market, by Product, 2023-2030 (US$ Bn)
TABLE 31 United States Orthopedic Trauma Devices Market, by End User, 2017-2022 (US$ Bn)
TABLE 32 United States Orthopedic Trauma Devices Market, by End User, 2023-2030 (US$ Bn)
TABLE 33 Canada Orthopedic Trauma Devices Market, by Product, 2017-2022 (US$ Bn)
TABLE 34 Canada Orthopedic Trauma Devices Market, by Product, 2023-2030 (US$ Bn)
TABLE 35 Canada Orthopedic Trauma Devices Market, by End User, 2017-2022 (US$ Bn)
TABLE 36 Canada Orthopedic Trauma Devices Market, by End User, 2023-2030 (US$ Bn)
TABLE 37 Mexico Orthopedic Trauma Devices Market, by Product, 2017-2022 (US$ Bn)
TABLE 38 Mexico Orthopedic Trauma Devices Market, by Product, 2023-2030 (US$ Bn)
TABLE 39 Mexico Orthopedic Trauma Devices Market, by End User, 2017-2022 (US$ Bn)
TABLE 40 Mexico Orthopedic Trauma Devices Market, by End User, 2023-2030 (US$ Bn)
TABLE 41 Europe Orthopedic Trauma Devices Market, by Product, 2017-2022 (US$ Bn)
TABLE 42 Europe Orthopedic Trauma Devices Market, by Product, 2023-2030 (US$ Bn)
TABLE 43 Europe Orthopedic Trauma Devices Market, by End User, 2017-2022 (US$ Bn)
TABLE 44 Europe Orthopedic Trauma Devices Market, by End User, 2023-2030 (US$ Bn)
TABLE 45 Europe Orthopedic Trauma Devices Market, by Country, 2017-2022 (US$ Bn)
TABLE 46 Europe Orthopedic Trauma Devices Market, by Country, 2023-2030 (US$ Bn)
TABLE 47 Germany Orthopedic Trauma Devices Market, by Product, 2017-2022 (US$ Bn)
TABLE 48 Germany Orthopedic Trauma Devices Market, by Product, 2023-2030 (US$ Bn)
TABLE 49 Germany Orthopedic Trauma Devices Market, by End User, 2017-2022 (US$ Bn)
TABLE 50 Germany Orthopedic Trauma Devices Market, by End User, 2023-2030 (US$ Bn)
TABLE 51 France Orthopedic Trauma Devices Market, by Product, 2017-2022 (US$ Bn)
TABLE 52 France Orthopedic Trauma Devices Market, by Product, 2023-2030 (US$ Bn)
TABLE 53 France Orthopedic Trauma Devices Market, by End User, 2017-2022 (US$ Bn)
TABLE 54 France Orthopedic Trauma Devices Market, by End User, 2023-2030 (US$ Bn)
TABLE 55 United Kingdom Orthopedic Trauma Devices Market, by Product, 2017-2022 (US$ Bn)
TABLE 56 United Kingdom Orthopedic Trauma Devices Market, by Product, 2023-2030 (US$ Bn)
TABLE 57 United Kingdom Orthopedic Trauma Devices Market, by End User, 2017-2022 (US$ Bn)
TABLE 58 United Kingdom Orthopedic Trauma Devices Market, by End User, 2023-2030 (US$ Bn)
TABLE 59 Italy Orthopedic Trauma Devices Market, by Product, 2017-2022 (US$ Bn)
TABLE 60 Italy Orthopedic Trauma Devices Market, by Product, 2023-2030 (US$ Bn)
TABLE 61 Italy Orthopedic Trauma Devices Market, by End User, 2017-2022 (US$ Bn)
TABLE 62 Italy Orthopedic Trauma Devices Market, by End User, 2023-2030 (US$ Bn)
TABLE 63 Spain Orthopedic Trauma Devices Market, by Product, 2017-2022 (US$ Bn)
TABLE 64 Spain Orthopedic Trauma Devices Market, by Product, 2023-2030 (US$ Bn)
TABLE 65 Spain Orthopedic Trauma Devices Market, by End User, 2017-2022 (US$ Bn)
TABLE 66 Spain Orthopedic Trauma Devices Market, by End User, 2023-2030 (US$ Bn)
TABLE 67 Rest of Europe Orthopedic Trauma Devices Market, by Product, 2017-2022 (US$ Bn)
TABLE 68 Rest of Europe Orthopedic Trauma Devices Market, by Product, 2023-2030 (US$ Bn)
TABLE 69 Rest of Europe Orthopedic Trauma Devices Market, by End User, 2017-2022 (US$ Bn)
TABLE 70 Rest of Europe Orthopedic Trauma Devices Market, by End User, 2023-2030 (US$ Bn)
TABLE 71 Asia Pacific Orthopedic Trauma Devices Market, by Product, 2017-2022 (US$ Bn)
TABLE 72 Asia Pacific Orthopedic Trauma Devices Market, by Product, 2023-2030 (US$ Bn)
TABLE 73 Asia Pacific Orthopedic Trauma Devices Market, by End User, 2017-2022 (US$ Bn)
TABLE 74 Asia Pacific Orthopedic Trauma Devices Market, by End User, 2023-2030 (US$ Bn)
TABLE 75 China Orthopedic Trauma Devices Market, by Product, 2017-2022 (US$ Bn)
TABLE 76 China Orthopedic Trauma Devices Market, by Product, 2023-2030 (US$ Bn)
TABLE 77 China Orthopedic Trauma Devices Market, by End User, 2017-2022 (US$ Bn)
TABLE 78 China Orthopedic Trauma Devices Market, by End User, 2023-2030 (US$ Bn)
TABLE 79 Japan Orthopedic Trauma Devices Market, by Product, 2017-2022 (US$ Bn)
TABLE 80 Japan Orthopedic Trauma Devices Market, by Product, 2023-2030 (US$ Bn)
TABLE 81 Japan Orthopedic Trauma Devices Market, by End User, 2017-2022 (US$ Bn)
TABLE 82 Japan Orthopedic Trauma Devices Market, by End User, 2023-2030 (US$ Bn)
TABLE 83 India Orthopedic Trauma Devices Market, by Product, 2017-2022 (US$ Bn)
TABLE 84 India Orthopedic Trauma Devices Market, by Product, 2023-2030 (US$ Bn)
TABLE 85 India Orthopedic Trauma Devices Market, by End User, 2017-2022 (US$ Bn)
TABLE 86 India Orthopedic Trauma Devices Market, by End User, 2023-2030 (US$ Bn)
TABLE 87 South Korea Orthopedic Trauma Devices Market, by Product, 2017-2022 (US$ Bn)
TABLE 88 South Korea Orthopedic Trauma Devices Market, by Product, 2023-2030 (US$ Bn)
TABLE 89 South Korea Orthopedic Trauma Devices Market, by End User, 2017-2022 (US$ Bn)
TABLE 90 South Korea Orthopedic Trauma Devices Market, by End User, 2023-2030 (US$ Bn)
TABLE 91 South-East Asia Orthopedic Trauma Devices Market, by Product, 2017-2022 (US$ Bn)
TABLE 92 South-East Asia Orthopedic Trauma Devices Market, by Product, 2023-2030 (US$ Bn)
TABLE 93 South-East Asia Orthopedic Trauma Devices Market, by End User, 2017-2022 (US$ Bn)
TABLE 94 South-East Asia Orthopedic Trauma Devices Market, by End User, 2023-2030 (US$ Bn)
TABLE 95 Rest of Asia Pacific Orthopedic Trauma Devices Market, by Product, 2017-2022 (US$ Bn)
TABLE 96 Rest of Asia Pacific Orthopedic Trauma Devices Market, by Product, 2023-2030 (US$ Bn)
TABLE 97 Rest of Asia Pacific Orthopedic Trauma Devices Market, by End User, 2017-2022 (US$ Bn)
TABLE 98 Rest of Asia Pacific Orthopedic Trauma Devices Market, by End User, 2023-2030 (US$ Bn)
TABLE 99 Latin America Orthopedic Trauma Devices Market, by Product, 2017-2022 (US$ Bn)
TABLE 100 Latin America Orthopedic Trauma Devices Market, by Product, 2023-2030 (US$ Bn)
TABLE 101 Latin America Orthopedic Trauma Devices Market, by End User, 2017-2022 (US$ Bn)
TABLE 102 Latin America Orthopedic Trauma Devices Market, by End User, 2023-2030 (US$ Bn)
TABLE 103 Brazil Orthopedic Trauma Devices Market, by Product, 2017-2022 (US$ Bn)
TABLE 104 Brazil Orthopedic Trauma Devices Market, by Product, 2023-2030 (US$ Bn)
TABLE 105 Brazil Orthopedic Trauma Devices Market, by End User, 2017-2022 (US$ Bn)
TABLE 106 Brazil Orthopedic Trauma Devices Market, by End User, 2023-2030 (US$ Bn)
TABLE 107 Argentina Orthopedic Trauma Devices Market, by Product, 2017-2022 (US$ Bn)
TABLE 108 Argentina Orthopedic Trauma Devices Market, by Product, 2023-2030 (US$ Bn)
TABLE 109 Argentina Orthopedic Trauma Devices Market, by End User, 2017-2022 (US$ Bn)
TABLE 110 Argentina Orthopedic Trauma Devices Market, by End User, 2023-2030 (US$ Bn)
TABLE 111 Rest of Latin America Orthopedic Trauma Devices Market, by Product, 2017-2022 (US$ Bn)
TABLE 112 Rest of Latin America Orthopedic Trauma Devices Market, by Product, 2023-2030 (US$ Bn)
TABLE 113 Rest of Latin America Orthopedic Trauma Devices Market, by End User, 2017-2022 (US$ Bn)
TABLE 114 Rest of Latin America Orthopedic Trauma Devices Market, by End User, 2023-2030 (US$ Bn)
TABLE 115 Middle East and Africa Orthopedic Trauma Devices Market, by Product, 2017-2022 (US$ Bn)
TABLE 116 Middle East and Africa Orthopedic Trauma Devices Market, by Product, 2023-2030 (US$ Bn)
TABLE 117 Middle East and Africa Orthopedic Trauma Devices Market, by End User, 2017-2022 (US$ Bn)
TABLE 118 Middle East and Africa Orthopedic Trauma Devices Market, by End User, 2023-2030 (US$ Bn)
TABLE 119 GCC Countries Orthopedic Trauma Devices Market, by Product, 2017-2022 (US$ Bn)
TABLE 120 GCC Countries Orthopedic Trauma Devices Market, by Product, 2023-2030 (US$ Bn)
TABLE 121 GCC Countries Orthopedic Trauma Devices Market, by End User, 2017-2022 (US$ Bn)
TABLE 122 GCC Countries Orthopedic Trauma Devices Market, by End User, 2023-2030 (US$ Bn)
TABLE 123 South Africa Orthopedic Trauma Devices Market, by Product, 2017-2022 (US$ Bn)
TABLE 124 South Africa Orthopedic Trauma Devices Market, by Product, 2023-2030 (US$ Bn)
TABLE 125 South Africa Orthopedic Trauma Devices Market, by End User, 2017-2022 (US$ Bn)
TABLE 126 South Africa Orthopedic Trauma Devices Market, by End User, 2023-2030 (US$ Bn)
TABLE 127 Rest of Middle East and Africa Orthopedic Trauma Devices Market, by Product, 2017-2022 (US$ Bn)
TABLE 128 Rest of Middle East and Africa Orthopedic Trauma Devices Market, by Product, 2023-2030 (US$ Bn)
TABLE 129 Rest of Middle East and Africa Orthopedic Trauma Devices Market, by End User, 2017-2022 (US$ Bn)
TABLE 130 Rest of Middle East and Africa Orthopedic Trauma Devices Market, by End User, 2023-2030 (US$ Bn)

Frequently Asked Questions

What is the current size of the global industrial shredder market?

The global industrial shredder market was valued at USD 1154.9 Million in 2022.

What is the expected growth rate of the industrial shredder market between 2023 and 2030?

The industrial shredder market is expected to grow at a CAGR of 5.10% between 2023 and 2030, reaching USD 1635.9 Million in 2030.

Which segment is leading the market share in terms of number of shafts?

Single shaft shredder category is the leading segment by number of shafts, holding over 47% share in terms of value in 2022.

Which price segment governs the demand for industrial shredder in the world?

The medium segment governs the demand for industrial shredder in the world, holding a massive share of over 47% in 2022.

Which distribution channel segment is expected to post the highest CAGR during the forecast period?

The direct segment is expected to post the highest CAGR during the forecast period.

Which region is fueling the growth of the industrial shredder industry?

Asia Pacific is fueling the growth of the industrial shredder industry, with over one-third share in 2022.

Who are the major players in the global industrial shredder market?

The top players include Advance Hydrau-Tech Pvt. Ltd., ANDRITZ AG, BCA Industries, Brentwood Recycling Systems, ECO Green Equipment, LLC., EcoStan India Private Limited., Hammermills International, Metso Corporation, MOCO Maschinen- und Apparatebau GmbH & Co. KG, Rapid Granulator Inc., Servo International, SSI Shredding Systems, Inc., UNTHA Shredding Technology GmbH, Vecoplan AG and WEIMA Maschinenbau GmbH.

What are the major market drivers of the industrial shredder industry?

The popularity of industrial shredders is being fueled by the rising amount of industrial trash produced by many industries, including manufacturing, healthcare, and construction. Additionally, growing public knowledge of the financial advantages of resource recovery and recycling is promoting market expansion.

What are the major market restraints of the industrial shredder industry?

The large initial investment costs associated with these machines make it difficult for small and medium-sized firms (SMEs) to use industrial shredders. Additionally, lack of understanding and inadequate waste management infrastructure in some places limit industry expansion.

What are the major market opportunities of the industrial shredder industry?

Industrial shredders with integrated Internet of Things (loT) technology have the potential for advanced monitoring and preventative maintenance. Due to increased industrialisation and rising environmental concerns, emerging countries, particularly those in Asia-Pacific and Latin America, present unexplored growth prospects for makers of industrial shredders.

Negative Pressure Wound Therapy Market

Published:
Report ID: 14408

Smart Insulin Pens Market

Published:
Report ID: 37000

Ophthalmic Viscoelastic Devices Market

Published:
Report ID: 36996

Japan Wound Care Market

Published:
Report ID: 36963

Japan Dental Equipment Market

Published:
Report ID: 36957

Weight Management Market

Published:
Report ID: 12005

Tonometer Market

Published:
Report ID: 36858

Radiation Protection Aprons Market

Published:
Report ID: 19694

Gastrointestinal Stent Market

Published:
Report ID: 6397

Artificial Intelligence (AI) in Operating Room Market

Published:
Report ID: 36770

Wheelchair Market

Published:
Report ID: 11916

Knee Replacement Market

Published:
Report ID: 36740

Purchase Options

$2999
Delivery Format: Excel.
$4999
Designed for the individual purchaser.
$6999
Users located at a single corporate site or regional office.
$7999
Allowed for unlimited sharing globally within one company.
Smallform of Sample request

Have a question?

User Profile

Don’t settle for less – trust Mitul to help you find the best solution.

Report delivery within 24 to 48 hours

– Other Info –

What people say?-

User Review

I am very impressed with the information in this report. The author clearly did their research when they came up with this product and it has already given me a lot of ideas.

Jana Schmidt
CEDAR CX Technologies

– Connect with us –

Phone

+91 6232 49 3207


support

24/7 Research Support


sales@credenceresearch.com

– Research Methodology –

Going beyond the basics: advanced techniques in research methodology

– Trusted By –

Pepshi, LG, Nestle
Motorola, Honeywell, Johnson and johnson
LG Chem, SIEMENS, Pfizer
Unilever, Samsonite, QIAGEN