
Market Overview
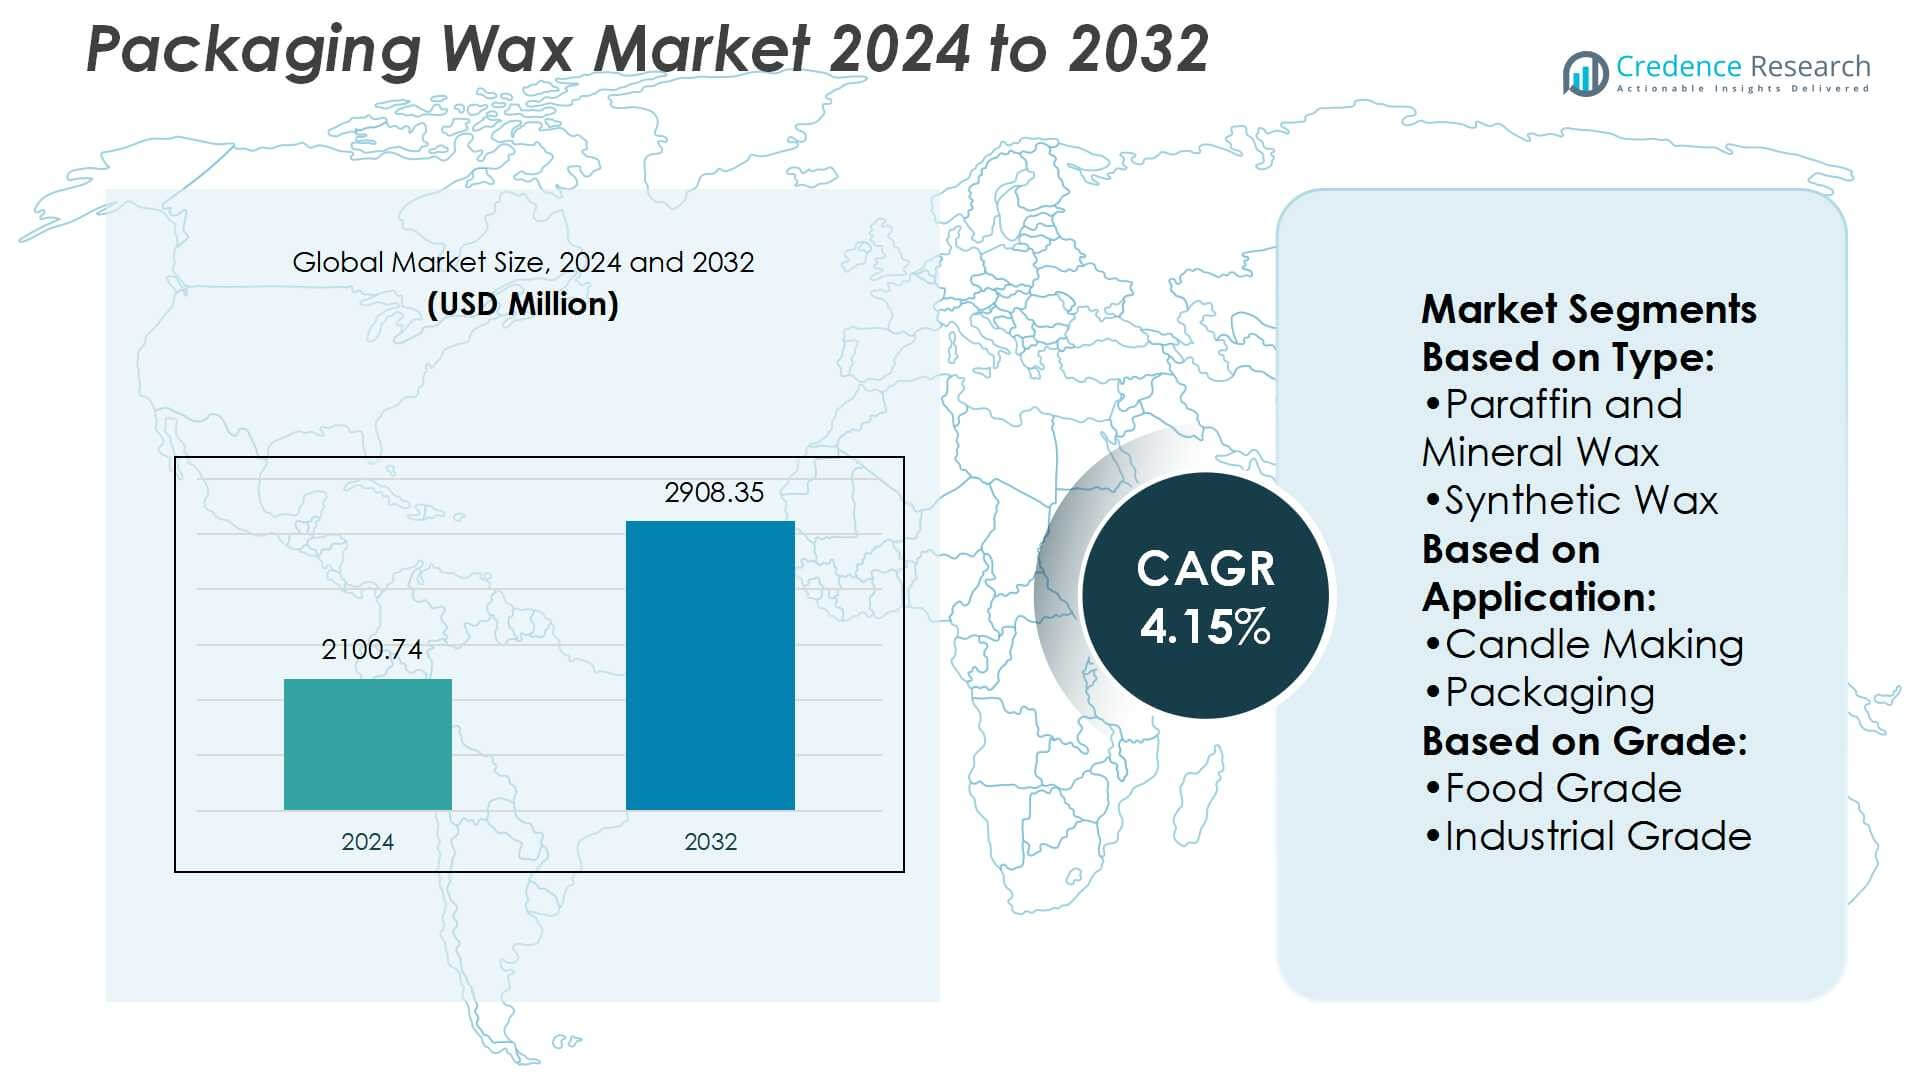
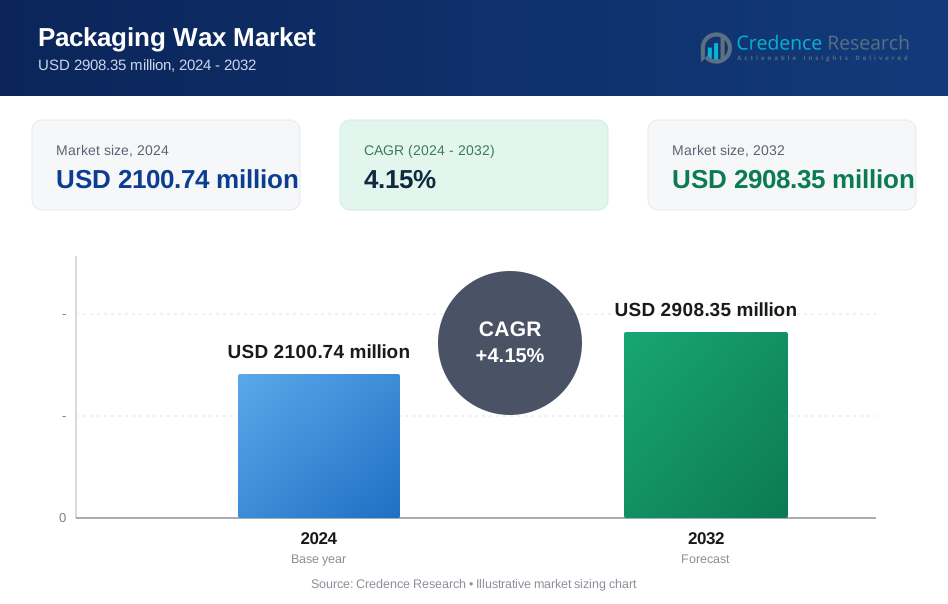
Packaging Wax Market size was valued USD 2100.74 million in 2024 and is anticipated to reach USD 2908.35 million by 2032, at a CAGR of 4.15% during the forecast period.
| REPORT ATTRIBUTE | DETAILS |
|---|---|
| Historical Period | 2020-2023 |
| Base Year | 2024 |
| Forecast Period | 2025-2032 |
| Packaging Wax Market Size 2024 | USD 2100.74 Million |
| Packaging Wax Market, CAGR | 4.15% |
| Packaging Wax Market Size 2032 | USD 2908.35 Million |
The Packaging Wax Market is shaped by major players such as WIWAX, BASF SE, Micro Powders, Inc., Synergy Additives, Honeywell International Inc., Clariant AG, Mitsui Chemicals America, Inc., SCG Chemicals, Westlake Chemical Corporation, and MLA Group of Industries. These companies focus on developing food-grade, sustainable, and high-performance waxes to meet rising demand across food packaging, cosmetics, and candle applications. Asia-Pacific leads the global market with a 34% share, driven by large-scale manufacturing, expanding packaged food consumption, and growing cosmetics industries. Strong supply chains and cost-effective production further reinforce the region’s dominant position.
 Market Insights
- The Packaging Wax Market size was USD 2100.74 million in 2024 and is expected to reach USD 2908.35 million by 2032, growing at a CAGR of 4.15%.
- Rising demand for food-grade wax in packaging applications drives growth, supported by moisture resistance, compliance with safety standards, and increased packaged food consumption.
- Sustainable and bio-based wax alternatives are emerging as key trends, with companies investing in eco-friendly innovations to meet regulatory requirements and consumer preferences.
- The market is competitive, with players such as WIWAX, BASF SE, Clariant AG, and Honeywell International Inc. focusing on research, product development, and regional expansions.
- Asia-Pacific leads with 34% share, driven by manufacturing scale, packaged food growth, and cosmetics industries, while paraffin and mineral wax dominate the type segment and candle making remains the leading application globally.
Market Segmentation Analysis:
By Type
Paraffin and mineral wax lead the Packaging Wax Market, holding the dominant share within this segment. Their affordability, wide availability, and versatility across industries support continued adoption. Strong demand from food packaging and candle production drives their use, as these waxes provide reliable sealing and moisture resistance. Synthetic wax is growing in demand due to its consistent performance in specialized applications but remains secondary. Although sustainable alternatives are gaining interest, paraffin and mineral wax retain dominance thanks to their established global supply chains and cost efficiency.
- For instance, WIWAX, a supplier of food-grade paraffin wax, produces a product with a melting point of 58°C, which can be used to coat packaged bakery items for preservation. The application of such waxes is known to reduce moisture transfer and can extend the shelf life of food products.
By Application
Candle making is the leading application in the Packaging Wax Market, capturing the largest share. Rising consumer demand for decorative, scented, and lifestyle candles sustains its market strength. Packaging applications also hold significant demand, driven by food safety needs, barrier protection, and printability for consumer goods. Cosmetics usage is increasing steadily, with wax being critical in lip care, creams, and lotions for stability and texture. Pharmaceutical and industrial uses further diversify the application base, but candles remain the primary growth driver across regions.
- For instance, Honeywell’s ACumist® Micronized Polyolefin Waxes show average particle sizes from 6.0 to 19.0 µm. Their Mettler drop point is about 137 °C for the “A” series, with density ~0.99 g/cc.
By Grade
Food grade wax dominates the Packaging Wax Market, accounting for the largest market share. This dominance is driven by expanding packaged food consumption and demand for safe, moisture-resistant, and regulatory-compliant materials. Applications include fruit and vegetable coatings, confectionery protection, and food wrapping, ensuring freshness and shelf life. Industrial grade wax maintains relevance in corrugated packaging, polishes, and coatings, though its share is smaller. Growing safety standards and rising consumer preference for compliant packaging materials continue to reinforce food grade wax as the leading segment in the market.
Key Growth Drivers
Rising Demand in Food Packaging
The Packaging Wax Market benefits strongly from rising demand in the food industry. Wax coatings extend shelf life, improve moisture resistance, and provide a glossy finish to products. Growing consumption of packaged fruits, vegetables, and confectionery supports this demand. Food-grade waxes meet strict safety and regulatory standards, making them essential in global supply chains. Increasing urbanization, coupled with consumer preference for ready-to-eat and long-lasting packaged goods, reinforces wax use. This factor positions food packaging as a primary driver for sustained market expansion.
- For instance, Clariant Ceridust™ 8330 is a predominantly bio-based micronized wax additive with a mean particle size of approximately 5.5 µm, used in printing inks to enhance rub resistance and moist environments in packaging coatings.
Expanding Candle Industry
The candle industry remains a major growth driver for the Packaging Wax Market. Demand for decorative, scented, and therapeutic candles continues to rise due to lifestyle and cultural trends. Waxes offer the required burning properties, fragrance retention, and smooth finish that candles need. Seasonal and festive sales further strengthen the segment’s contribution. Growing consumer preference for premium and customized candles adds to market potential. As disposable incomes increase worldwide, candle demand supports consistent wax consumption, making it a critical factor in market growth.
- For instance, Composition & molecular weight: HI-WAX is a polyethylene wax with molecular weights ranging from 300 to 10,000.Performance vs natural wax: It is designed to outperform animal, plant, or mineral wax in melting point, heat resistance, and structure.
Cosmetic and Personal Care Applications
Cosmetics and personal care products drive demand by utilizing wax for stability, texture, and protective properties. Waxes are used in lip balms, lotions, creams, and hair care products to enhance formulation quality. Rising consumer preference for natural and sustainable cosmetic ingredients adds momentum to wax-based applications. Growth in beauty and wellness industries worldwide ensures steady demand. Companies are developing innovative blends of natural and synthetic waxes to meet both performance and sustainability needs, reinforcing this application as a key growth driver.
Key Trends & Opportunities
Shift Toward Sustainable Wax Alternatives
Sustainability trends create opportunities in the Packaging Wax Market through bio-based and recyclable solutions. Companies are focusing on developing plant-derived waxes to replace petroleum-based options. Rising regulatory pressure and consumer awareness about eco-friendly materials drive this shift. Demand for biodegradable coatings in food packaging and cosmetics fuels innovation. Firms investing in green technologies and sustainable wax formulations stand to capture growing market share. This trend not only addresses environmental concerns but also opens new growth avenues across packaging and personal care sectors.
- For instance, Braskem Siam (a joint venture of SCGC and Braskem) signed a Letter of Intent with a Thai ethanol producer to supply the feedstock for its bio-ethylene plant in Rayong, Thailand. The plant has an eventual capacity of 200,000 tonnes per year and will use agricultural ethanol to replace fossil-based ethylene, supporting the production of sustainable packaging.
Advancements in Wax Blending and Performance
Technological improvements in wax blending create opportunities for high-performance applications. Blends of natural, mineral, and synthetic waxes are engineered to achieve superior barrier properties, improved melting points, and better processability. Industries such as packaging, cosmetics, and coatings benefit from these innovations. Customizable waxes enhance functionality in specific uses, including food preservation and premium product packaging. Research in modified waxes also supports compliance with strict regulations. This trend highlights a growing opportunity for manufacturers to differentiate products and meet evolving customer demands.
- For instance, PE-100 wax requires verification, it is common for suppliers to offer low molecular weight PE waxes for viscosity control. These waxes typically have melting points in the 100–120°C range, and their performance can vary depending on the specific application.
Key Challenges
Volatility in Raw Material Prices
Fluctuations in crude oil prices directly impact the cost of paraffin and mineral waxes. Since petroleum derivatives form the basis of many waxes, market stability is vulnerable to global energy trends. Price volatility disrupts supply chains and affects profit margins for producers and end users. Companies relying heavily on conventional waxes face difficulties in maintaining cost efficiency. This challenge compels businesses to explore alternative raw materials and invest in sustainable wax sources, yet transition costs and scalability remain significant concerns.
Regulatory and Environmental Compliance
Stringent regulations on packaging materials create a significant challenge for the Packaging Wax Market. Governments and regulatory bodies demand eco-friendly, food-safe, and recyclable solutions, limiting reliance on traditional petroleum-based waxes. Compliance with these standards increases production costs and requires continuous innovation. Environmental concerns over non-biodegradable waste add further pressure. Manufacturers must balance regulatory demands with cost-effective solutions while developing alternatives that meet performance expectations. This challenge makes regulatory compliance a persistent barrier for market growth, particularly in highly regulated industries like food and cosmetics.
Regional Analysis
North America
North America holds a significant share of the Packaging Wax Market, supported by strong demand in food packaging and candle manufacturing. The United States leads the region, accounting for the largest consumption due to its developed food processing industry and high consumer preference for decorative candles. Canada contributes with rising adoption of food-grade waxes in packaging, while Mexico shows growth driven by expanding industrial and retail sectors. Stringent regulatory standards encourage the use of compliant and safe wax products. With steady innovation and high consumer spending, North America maintains a 28% share of the global market.
Europe
Europe represents a robust share of the Packaging Wax Market, capturing 24% of the global total. The region’s dominance is supported by Germany, France, and the United Kingdom, where food packaging and cosmetics industries drive demand. European consumers show strong preference for sustainable and eco-friendly materials, accelerating the adoption of bio-based waxes. Candle manufacturing remains an established application due to cultural traditions and seasonal demand peaks. Regulations around food safety and environmental compliance further shape product innovation. With ongoing emphasis on sustainability, Europe continues to strengthen its market position across packaging and consumer applications.
Asia-Pacific
Asia-Pacific leads the Packaging Wax Market with a 34% share, driven by rapid industrialization and rising consumer demand. China remains the largest contributor, supported by large-scale manufacturing and strong food packaging needs. India shows high growth, driven by expanding packaged food demand and rising disposable incomes. Japan and South Korea contribute significantly with advanced cosmetics and personal care industries. The region benefits from abundant raw material supply and growing candle production, especially in emerging economies. Increasing urbanization and demand for affordable consumer goods ensure continued dominance of Asia-Pacific in global packaging wax consumption.
Latin America
Latin America accounts for 8% of the Packaging Wax Market, with growth driven by expanding food and beverage packaging needs. Brazil leads the region, supported by its large agricultural output and processed food industries. Mexico and Argentina contribute through demand in candle manufacturing and cosmetics applications. The region faces challenges with limited access to advanced synthetic and bio-based waxes, relying heavily on imports. However, rising consumer demand for packaged goods and growing retail expansion create opportunities for market penetration. With increasing investments, Latin America shows potential for steady growth in the global market landscape.
Middle East & Africa
The Middle East & Africa hold a 6% share of the Packaging Wax Market, driven by industrial and consumer-based applications. Gulf countries, including Saudi Arabia and the UAE, show demand in food packaging and retail sectors. Africa contributes through growing adoption of packaging solutions for processed food and agricultural products. Candle usage remains relevant in parts of Africa due to cultural and practical needs. Limited production capacity in the region results in dependency on imports, though investments in packaging industries are increasing. With rising consumer demand, the region shows moderate but promising growth potential.
Market Segmentations:
By Type:
- Paraffin and Mineral Wax
- Synthetic Wax
By Application:
- Candle Making
- Packaging
By Grade:
- Food Grade
- Industrial Grade
By Geography
- North America
- U.S.
- Canada
- Mexico
- Europe
- UK
- France
- Germany
- Italy
- Spain
- Russia
- Rest of Europe
- Asia Pacific
- China
- Japan
- South Korea
- India
- Australia
- Southeast Asia
- Rest of Asia Pacific
- Latin America
- Brazil
- Argentina
- Rest of Latin America
- Middle East
- GCC Countries
- Israel
- Turkey
- Rest of Middle East
- Africa
- South Africa
- Egypt
- Rest of Africa
Competitive Landscape
The Packaging Wax Market features strong competition with key players including WIWAX, BASF SE, Micro Powders, Inc., Synergy Additives, Honeywell International Inc., Clariant AG, Mitsui Chemicals America, Inc., SCG Chemicals, Westlake Chemical Corporation, and MLA Group of Industries. The Packaging Wax Market is highly competitive, with companies focusing on innovation, sustainability, and cost efficiency to gain advantage. Producers are investing in bio-based waxes and advanced blending technologies to address regulatory standards and consumer demand for eco-friendly solutions. Food-grade waxes remain a central area of development, as they play a critical role in packaging safety and compliance. Market players are also adopting strategies such as partnerships, mergers, and regional expansion to strengthen distribution networks and capture growth opportunities. Continuous product innovation and performance enhancement are key factors shaping the competitive landscape.
Key Player Analysis
- WIWAX
- BASF SE
- Micro Powders, Inc.
- Synergy Additives
- Honeywell International Inc.
- Clariant AG
- Mitsui Chemicals America, Inc.
- SCG Chemicals
- Westlake Chemical Corporation
- MLA Group of Industries
Recent Developments
- In August 2024, Sasol Chemicals launched SASOLWAX LC100, an industrial wax with a 35% reduction in carbon footprint, aimed at improving sustainability in packaging adhesives while maintaining high performance.
- In May 2024, KCC Corporation completed the acquisition of Momentive Performance Materials Group, enhancing its capabilities in the high-performance materials sector and broadening its product portfolio.
- In April 2024, Novolex announced a strategic investment in OZZI, a leader in reusable packaging innovation, aiming to expand its sustainable packaging solutions and reduce environmental impact. This partnership aligns with Novolex’s commitment to advancing eco-friendly practices in the packaging industry.
- In April 2024, Exxon Mobil Corporation launched a new wax product brand, Prowaxx. Prowaxx serves as an anchor for the product portfolio, with differentiation across wax types and greater clarity tailored to customer decision-making.
Report Coverage
The research report offers an in-depth analysis based on Type, Application, Grade and Geography. It details leading market players, providing an overview of their business, product offerings, investments, revenue streams, and key applications. Additionally, the report includes insights into the competitive environment, SWOT analysis, current market trends, as well as the primary drivers and constraints. Furthermore, it discusses various factors that have driven market expansion in recent years. The report also explores market dynamics, regulatory scenarios, and technological advancements that are shaping the industry. It assesses the impact of external factors and global economic changes on market growth. Lastly, it provides strategic recommendations for new entrants and established companies to navigate the complexities of the market.
Future Outlook
- The market will see steady growth driven by food-grade packaging demand.
- Candle manufacturing will remain a strong consumer of packaging wax globally.
- Bio-based and sustainable wax alternatives will gain higher adoption.
- Cosmetic and personal care industries will expand wax applications.
- Technological improvements in blending will enhance performance properties.
- Regulatory compliance will shape product development and material choices.
- Emerging economies will drive consumption through rising packaged food demand.
- Strategic partnerships and acquisitions will strengthen global supply chains.
- Industrial-grade wax use will increase in coatings and corrugated packaging.
- Innovation in eco-friendly solutions will define long-term market competitiveness.
Request a Free Sample
Fill in your details and we'll send you a free sample report.
- Sample data tables & charts
- Research methodology
Need a Custom Version of This Report?
Tailor the scope, geography, or segments to your exact requirements.
- Custom geography or segment scope
- Direct access to our analyst team
Frequently Asked Questions
What is the current market size for Packaging Wax Market, and what is its projected size in 2032?
At what Compound Annual Growth Rate is the Packaging Wax Market projected to grow between 2025 and 2032?
Which Packaging Wax Market segment held the largest share in 2024?
What are the primary factors fueling the growth of the Packaging Wax Market?
Who are the leading companies in the Packaging Wax Market?
Which region commanded the largest share of the Packaging Wax Market in 2024?
Table of Content
Chapter 1. Report Introduction
- 1.1 Report Description & Purpose
- 1.1.1 Report Title & Market Definition
- 1.1.2 Unique Selling Propositions (USP) & Key Differentiators
- 1.1.3 Value Proposition for Stakeholders
- 1.2 Research Objectives
- 1.2.1 Market Sizing Objectives (Volume & Revenue)
- 1.2.2 Segmentation Objectives
- 1.2.3 Competitive Intelligence Objectives
- 1.2.4 Forecast & Scenario Objectives
- 1.3 Report Scope
- 1.3.1 Packaging Wax Scope – Types & Subtypes Covered
- 1.3.2 Geographic Scope – Regions & Countries Covered
- 1.3.3 Historical Period, Base Year & Forecast Period (2024; forecast to 2032)
- 1.3.4 Inclusions & Exclusions
- 1.4 HS Code & Classification Framework
- 1.5 Currency, Units & Pricing Basis
- 1.6 Target Stakeholders
- 1.7 Limitations & Assumptions
Chapter 2. Executive Summary
- 2.1 Global Packaging Wax Market Snapshot
- 2.1.1 Market Size – Historical (2024) & Forecast (2024-2032) (2024: USD 2100.74 million → 2032: USD 2908.35 million)
- 2.1.2 Volume & Revenue – Global Totals
- 2.1.3 Key Market Highlights – Top Five Facts
- 2.2 Packaging Wax Market Segmentation Snapshot
- 2.2.1 Market Split by Region – 2024 vs. 2032
- 2.3 Competitive Snapshot
- 2.3.1 Top 10 Players by Revenue Share – 2024
- 2.3.2 Top 10 Players by Volume Share – 2024
- 2.3.3 Recent Strategic Developments (18-Month Summary)
- 2.4 Key Investment Highlights & Strategic Conclusions
Chapter 3. Packaging Wax Market Dynamics & Industry Analysis
- 3.1 Market Overview & Context
- 3.1.1 Packaging Wax Market Position in the Broader Automotive Value Chain
- 3.1.2 OEM vs. Replacement Market Dynamics
- 3.1.3 Market Maturity & Development Stage by Region
- 3.2 Packaging Wax Market Drivers
- 3.3 Packaging Wax Market Restraints & Challenges
- 3.4 Packaging Wax Market Opportunities
- 3.5 Porter's Five Forces Analysis
- 3.5.1 Threat of New Entrants
- 3.5.2 Bargaining Power of Suppliers
- 3.5.3 Bargaining Power of Buyers
- 3.5.4 Threat of Substitutes
- 3.5.5 Competitive Rivalry – Intensity Assessment
- 3.6 Packaging Wax Value Chain Analysis
- 3.6.1 Upstream – Raw Material/Input Suppliers
- 3.6.1.1 Raw Material/Input 1
- 3.6.1.2 Raw Material/Input 2
- 3.6.1.3 Raw Material/Input 3
- 3.6.2 Midstream – Production/Manufacturing/Service Delivery
- 3.6.2.1 Production/Process Overview
- 3.6.2.2 Key Facility Locations & Capacity by Manufacturer
- 3.6.3 Downstream – Distribution & End Consumer
- 3.6.3.1 Primary Channel – B2B/OEM
- 3.6.3.2 Secondary Channels – Dealer, Retail, Online, Direct
- 3.6.4 Value Chain Profitability Analysis
- 3.6.1 Upstream – Raw Material/Input Suppliers
- 3.7 PESTEL Analysis
- 3.7.1 Political Factors
- 3.7.2 Economic Factors
- 3.7.3 Social Factors
- 3.7.4 Technological Factors
- 3.7.5 Environmental Factors
- 3.7.6 Legal Factors
- 3.8 Packaging Wax Supply Chain Analysis
- 3.8.1 Raw Material/Input Supply Risk Assessment
- 3.8.2 Manufacturing Concentration Risk (Geographic Exposure)
- 3.8.3 Trade Disruption Impact Analysis
- 3.9 Regulatory & Policy Landscape
Note: The regulatory and policy landscape section covers regulations based on their applicability to the market, Packaging Wax category, geography, and scope of the study. Only regulatory frameworks with a material impact on operations, compliance, trade, sustainability, or market access are analyzed in detail.
Chapter 4. Key Investment Pockets & Opportunity Analysis
- 4.1 Packaging Wax Market Attractiveness Analysis
- 4.1.1 By Region – Investment Attractiveness Matrix (Volume × CAGR)
- 4.2 Absolute Revenue Growth Opportunity
- 4.2.1 By Region – Absolute USD Growth Through 2032
- 4.3 Incremental Volume Opportunity
- 4.3.1 By Region – Incremental Volume Through 2032
- 4.3.2 Segment – Incremental Volume
- 4.4 Emerging Submarket Opportunity Deep Dive (Subject to Applicability)
- 4.5 Emerging Market Opportunity Scorecards
- 4.5.1 United States
- 4.5.2 Europe
- 4.5.3 Asia
- 4.5.4 Middle East & Africa
Note: Emerging Market Opportunity Scorecards will be included based on relevance and strategic importance. Regions listed are indicative and may vary depending on data availability and market dynamics.
Chapter 5. Packaging Wax Import-Export Analysis & Trade Flows
- 5.1 Global Trade Overview
- 5.1.1 Global Export Value by Country (2024)
- 5.1.2 Global Export Volume by Country (2024)
- 5.1.3 Global Import Value by Country (2024)
- 5.1.4 Global Import Volume by Country (2024)
- 5.1.5 Net Trade Balance by Country (2024)
- 5.2 Export Analysis – Segment
- 5.2.1 Type 1 (HS Code)
- 5.2.2 Type 2 (HS Code)
- 5.2.3 Type 3 (HS Code)
- 5.2.4 Type 4 (HS Code)
- 5.2.5 Type 5 (HS Code)
- 5.3 Import Analysis – Segment
- 5.3.1 Type 1 (HS Code)
- 5.3.2 Type 2 (HS Code)
- 5.3.3 Type 3 (HS Code)
- 5.3.4 Type 4 (HS Code)
- 5.3.5 Type 5 (HS Code)
- 5.4 Average Unit Trade Prices
- 5.4.1 Average Export Price – Segment & Country
- 5.4.2 Average Import Price – Segment & Source Country
- 5.4.3 Price Trends (2024)
- 5.5 Key Trade Route Analysis
- 5.5.1 Trade Route 1
- 5.5.2 Trade Route 2
- 5.5.3 Trade Route 3
- 5.5.4 Trade Route 4
- 5.5.5 Trade Route 5
- 5.6 Trade Policy Impact Assessment
- 5.6.1 US Anti-Dumping & Section 301 Tariffs
- 5.6.2 EU Customs Union Impact
- 5.6.3 Major Free Trade Agreements
- 5.6.4 USMCA Rules of Origin
Note: Trade policy analysis will be included only where relevant to the Packaging Wax market.
Chapter 6. Competitive Landscape & Company Benchmarking
- 6.1 Packaging Wax Market Concentration & Structure
- 6.1.1 Herfindahl-Hirschman Index (HHI) – vs. 2024
- 6.1.2 Tier 1, Tier 2 & Tier 3 Market Structure
- 6.1.3 Global, Regional & Local Player Dynamics
- 6.2 Packaging Wax Market Share Analysis – 2024
- 6.2.1 Global Revenue Share by Company
- 6.2.2 Global Volume Share by Company
- 6.2.3 Regional Revenue Share
- 6.2.4 Market Share Evolution ( vs. 2024)
- 6.2.5 OEM Segment Share by Company
- 6.2.6 Replacement Segment Share by Company
- 6.3 Production/Delivery Capacity & Facility Analysis
- 6.3.1 Global Installed Capacity
- 6.3.2 Capacity Utilization Rates
- 6.3.3 Production/Output Volume
- 6.3.4 Facility Locations & Capacity Map
- 6.3.5 Planned Capacity Additions
- 6.4 Packaging Wax Competitive Benchmarking Matrix
- 6.4.1 Revenue, Volume, CAGR & Profitability Comparison
- 6.4.2 Channel Revenue Mix
- 6.4.3 Geographic Revenue Exposure
- 6.4.4 R&D Intensity
- 6.4.5 Sustainability Maturity
- 6.5 Strategic Developments in Packaging Wax (Last 24 Months)
- 6.5.1 Mergers, Acquisitions & Divestments
- 6.5.2 New Packaging Wax Launches
- 6.5.3 Facility Expansions
- 6.5.4 Strategic Alliances, Joint Ventures & Partnerships
- 6.5.5 Distribution Expansion & Market Entry
- 6.5.6 Sustainability & ESG Initiatives
- 6.6 Competitive Strategy Mapping
- 6.6.1 Leader, Challenger, Follower & Niche Classification
- 6.6.2 Pricing Strategy Comparison
- 6.6.3 Channel Strategy Matrix
Note: Strategic developments are included based on their materiality and the availability of reliable information.
Chapter 7. Global Packaging Wax Market – By Distribution Channel
- 7.1 Segment Overview
- 7.1.1 Volume & Revenue Split by Channel (2024 & 2032)
- 7.1.2 Channel Mix Evolution (2024-2032)
Chapter 8. Regional Market Analysis – Global Overview
- 8.1 Global Regional Overview
- 8.1.1 Regional Volume Share
- 8.1.2 Regional Revenue Share
- 8.1.3 Regional Volume by Region
- 8.1.4 Regional Revenue by Region
- 8.1.5 Regional Forecast Through 2032
- 8.2 Cross-Regional Segment Analysis
- 8.2.1 By Distribution Channel
- 8.2.2 By Brand/Price Tier
Chapter 9. North America Packaging Wax Market
- 9.1 United States
- 9.2 Canada
- 9.3 Mexico
Chapter 10. Europe Packaging Wax Market
- 10.1 Germany
- 10.2 France
- 10.3 Italy
- 10.4 United Kingdom
- 10.5 Spain
- 10.6 Poland
- 10.7 Russia
- 10.8 Netherlands
- 10.9 Belgium
- 10.10 Sweden
- 10.11 Denmark
- 10.12 Norway
- 10.13 Rest of Europe
Chapter 11. Asia Pacific Packaging Wax Market
- 11.1 China
- 11.2 India
- 11.3 Japan
- 11.4 South Korea
- 11.5 Thailand
- 11.6 Indonesia
- 11.7 Vietnam
- 11.8 Malaysia
- 11.9 Australia
- 11.10 Rest of Asia Pacific
Chapter 12. Latin America Packaging Wax Market
- 12.1 Brazil
- 12.2 Argentina
- 12.3 Colombia
- 12.4 Chile
- 12.5 Rest of Latin America
Chapter 13. Middle East Packaging Wax Market
- 13.1 Saudi Arabia
- 13.2 United Arab Emirates
- 13.3 Turkey
- 13.4 Israel
- 13.5 Iran
- 13.6 Rest of the Middle East
Chapter 14. Africa Packaging Wax Market
- 14.1 South Africa
- 14.2 Egypt
- 14.3 Nigeria
- 14.4 Morocco
- 14.5 Rest of Africa
Chapter 15. Packaging Wax Company Profiles
- 15.1 [Company 01]
- 15.1.1 Company Overview
- 15.1.2 Key Management Personnel
- 15.1.3 Products & Services Portfolio
- 15.1.4 Financial Performance
- 15.1.5 Key Market Focus & Geographic Presence
- 15.1.6 Recent Developments & Strategic Initiatives
Note: The company profile list is preliminary and may change based on research findings, market developments, data availability, and client requirements.
Chapter 16. Appendices
- Appendix A – List of Abbreviations & Acronyms
- Appendix B – Industry Classification Code Reference – Full Series
- Appendix C – Production & Capacity Data Tables
- Appendix D – End-Use & Demand Base Tables
- Appendix E – Consumption & Replacement Rate Assumptions
- Appendix F – ASP Reference Tables
- Appendix G – Manufacturing & Facility Database
- Appendix H – Import-Export Data Tables
- Appendix I – Regulatory Summary Tables
- Appendix J – Primary Research Participant List (Anonymized)
- Appendix K – Primary Research Questionnaire Framework
- Appendix L – Data Sources & Bibliography
- Appendix M – Market Size Divergence & Source Comparison
Chapter 17. Research Methodology
- 17.1 Research Framework & Philosophy
- 17.2 Secondary Research – Sources, Hierarchy & Data Extraction
- 17.3 Data Modeling – Bottom-Up & Top-Down Market Sizing
- 17.4 Primary Research – Stakeholder Framework, LOI & Sample Sizes
- 17.5 Forecast Methodology – Regression, Scenario & Sensitivity Analysis
- 17.6 Quality Control – Four-Layer Validation Framework
- 17.7 Limitations & Standard Assumptions
- 17.8 Disclaimer
