
United States Parenteral Nutrition Market Overview:
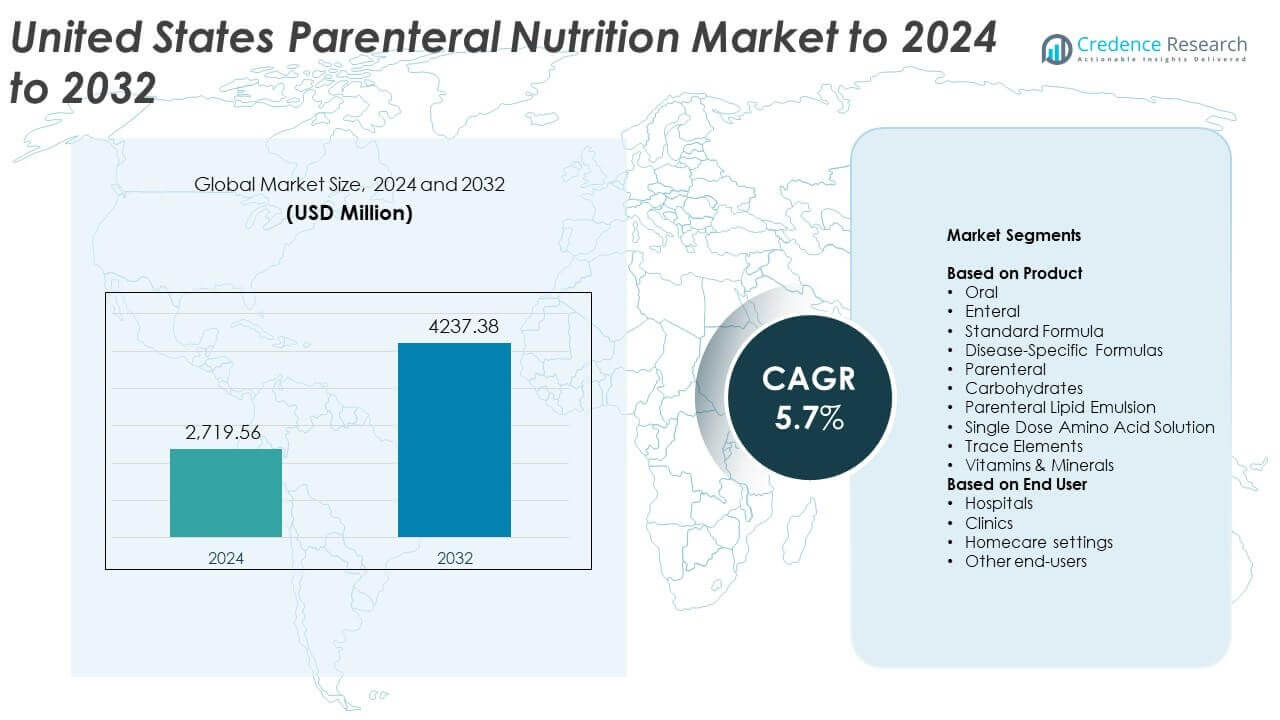
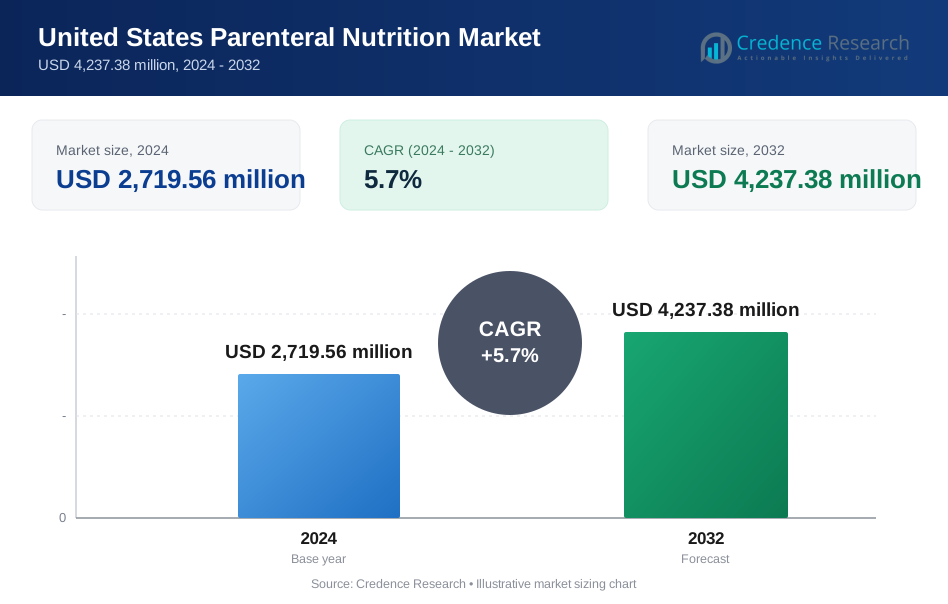
United States Parenteral Nutrition Market size was valued USD 2,719.56 million in 2024 and is anticipated to reach USD 4,237.38 million by 2032, at a CAGR of 5.7% during the forecast period.
| REPORT ATTRIBUTE | DETAILS |
|---|---|
| Historical Period | 2020-2024 |
| Base Year | 2025 |
| Forecast Period | 2026-2032 |
| United States Parenteral Nutrition Market Size 2024 | USD 2,719.56 million |
| United States Parenteral Nutrition Market, CAGR | 5.7% |
| United States Parenteral Nutrition Market Size 2032 | USD 4,237.38 million |
United States Parenteral Nutrition Market Insights
- Rising gastrointestinal disorders and higher ICU admissions drive strong demand for parenteral formulations, with the parenteral segment holding about 52% share in 2024.
- Advanced lipid emulsions, safer amino acid blends, and expanding home-based infusion programs shape key trends across hospitals and long-term care.
- Leading players compete through sterile manufacturing, automated compounding, and strong clinical partnerships that support high-volume supply. New York led the market in 2024 with about 28% share, followed by Los Angeles at 24%, Chicago at 19%, and Houston at 17%, reflecting strong adoption across major healthcare hubs.
United States Parenteral Nutrition Market Segmentation Analysis:
By Product
Parenteral held the dominant position in 2024 with about 52% share. Hospitals and critical care units used parenteral solutions widely for patients unable to meet nutrition needs through the oral or enteral route. Growth came from rising cases of gastrointestinal disorders, higher ICU admissions, and increased use of tailored macronutrient mixes. Demand also rose for single dose amino acid solutions and lipid emulsions due to improved safety and better metabolic outcomes. Disease-specific formulas and standard formulas expanded at a steady pace as clinicians adopted more personalized nutrition strategies.
By End User
Hospitals led the end-user segment in 2024 with nearly 61% share. Large hospital networks used parenteral nutrition for emergency care, postoperative recovery, and chronic illness management. Strict clinical protocols and advanced monitoring systems supported high adoption across intensive care and oncology wards. Clinics expanded their use as outpatient treatments increased for long-term nutrition support. Homecare settings grew due to rising preference for at-home infusion services, supported by pump technology and trained nursing support that ensured safe handling and dose accuracy.
- For instance, the Mayo Clinic provides total parenteral nutrition to nearly 1,200 people annually, some of whom receive treatment at home, underscoring the depth of expertise in managing complex nutritional needs.
Key Growth Drivers
Rising prevalence of gastrointestinal and chronic diseases
Higher cases of Crohn disease, cancer, and severe malabsorption increased demand for parenteral nutrition in the United States. Many patients required nutrient delivery bypassing the digestive tract, which strengthened adoption across hospitals and specialty centers. Critical care units also used these solutions more due to rising postoperative complications and trauma cases. Growing awareness among clinicians and improved clinical guidelines further supported market expansion by promoting timely and accurate nutritional intervention for high-risk patients.
- For instance, Option Care Health, the nation's largest independent provider of infusion therapy, serves more than 270,000 unique patients annually as of the end of 2023
Expanding use of parenteral nutrition in intensive care
ICUs relied heavily on parenteral nutrition for patients with unstable conditions who could not tolerate oral or enteral feeding. Adoption grew as hospitals upgraded monitoring systems that supported safe infusion and reduced metabolic risks. Increased admissions linked to respiratory illness, cardiac events, and sepsis also drove demand. Clinical teams favored advanced lipid emulsions and amino acid blends to improve recovery and maintain energy balance. These shifts helped create consistent volume growth across major hospital systems.
Advancements in nutrient formulations and safety technologies
Improved lipid emulsions, balanced amino acid solutions, and enhanced micronutrient mixes increased physician confidence in parenteral therapy. New formulations reduced infection risks, improved metabolic tolerance, and allowed better customization for individual patient needs. Automated compounding systems and smart infusion pumps enhanced safety and reduced preparation errors. These innovations encouraged wider adoption across both acute and long-term care environments. As technology improved outcomes, healthcare providers integrated parenteral support more often in complex treatment plans.
Key Trends and Opportunities
Shift toward home-based parenteral nutrition care
More patients began receiving parenteral support at home due to better infusion pumps, trained nursing services, and rising preference for comfort-focused care. This shift reduced hospital burden and enabled long-term therapy for chronic conditions. Improved monitoring tools allowed clinicians to track patient outcomes remotely, supporting safer home treatments. Growth in homecare networks and reimbursement support created a strong opportunity for suppliers offering portable systems and customized nutrition kits tailored for home administration.
Increasing adoption of personalized nutrition strategies
Clinicians focused more on tailoring formulations to match individual metabolic needs, disease states, and recovery goals. Hospitals used patient-specific amino acid, lipid, and micronutrient combinations to improve outcomes and reduce complications. Data-driven tools and advanced compounding systems supported precise adjustments in nutrient volumes. Personalized approaches opened new opportunities for specialized blends designed for oncology, neonatal care, and critical illness, strengthening demand for high-value formulations within the United States market.
- For instance, Fresenius Kabi, a global market leader in parenteral nutrition, is present in more than 100 countries around the globe and relies on a global production network of around 60 production sites, including compounding centers in Europe, North America, Latin America, Asia Pacific, and Africa.
Growing emphasis on quality standards and sterile manufacturing
Manufacturers invested in higher-grade sterile production, improved filtration, and contamination-control protocols. These shifts reflected stricter regulatory expectations and rising hospital focus on reducing infection risk. Facilities adopted advanced packaging and closed-system transfer technologies to maintain product integrity. The trend created growth opportunities for suppliers offering compliant, high-purity formulations and reliable supply chains. As hospitals prioritized safety certified products, companies with strong manufacturing quality gained competitive advantages.
Key Challenges
Risk of catheter-related bloodstream infections
Parenteral nutrition requires central line access, which increases the chance of serious infections if not managed under strict sterile conditions. Hospitals faced rising pressure to improve line care due to higher morbidity linked to these infections. Training gaps, inconsistent protocols, and heavy workloads made infection control difficult in some settings. These risks limited wider adoption outside controlled environments and increased the need for additional safety measures. Managing this challenge remained a critical focus for healthcare systems.
High cost burden and reimbursement limitations
Parenteral nutrition involves expensive ingredients, sterile production, infusion devices, and skilled administration. Many providers faced budget strain when managing long-term therapy, especially for complex or chronic patients. Reimbursement policies did not always cover full treatment costs, creating financial pressure for homecare settings and smaller clinics. These constraints slowed broader adoption and restricted access for some patient groups. Addressing cost barriers remained essential for expanding market reach across the United States.
Regional Analysis
New York
New York held the largest share in 2024 with about 28% share. Strong hospital density and many advanced ICUs supported high use of parenteral nutrition. Major cancer centers and trauma units treated complex cases that required full nutrient support. Rising gastrointestinal disorders also increased clinical dependence on specialized blends. The city’s strong reimbursement systems and large skilled workforce helped drive wider adoption. Growth continued as hospitals expanded sterile compounding and strengthened safety protocols across nutrition programs.
Los Angeles
Los Angeles accounted for nearly 24% share in 2024. Large medical networks and high patient volumes supported steady use of parenteral solutions. Many chronic illness cases and postoperative patients required tailored formulations, which improved demand for advanced lipid and amino acid blends. Home-based nutrition programs grew as providers expanded remote monitoring. Strong investment in infusion technologies and training enhanced safe delivery. Growing neonatal and oncology needs also helped Los Angeles remain a key regional market.
Chicago
Chicago held about 19% share in 2024. Major teaching hospitals and specialty clinics used parenteral nutrition for complex gastrointestinal and metabolic disorders. Strong adoption came from improved ICU protocols and rising use of personalized nutrition plans. The city focused on reducing infection risk through better catheter care and upgraded compounding systems. Homecare networks expanded as more chronic patients received long-term support outside hospitals. These factors strengthened Chicago’s position as a significant regional market.
Houston
Houston represented roughly 17% share in 2024. Large medical centers and strong critical care capacity supported steady demand for parenteral nutrition. Hospitals treated many trauma, cancer, and surgical cases that required controlled nutrient infusion. Growth came from advanced lipid emulsions, safer micronutrient mixes, and strong clinical guidelines. The city also expanded home-based infusion programs for chronic patients. Rising population and expanding healthcare infrastructure helped Houston maintain consistent adoption across its hospitals and clinics.
United States Parenteral Nutrition Market Segmentations:
By Product
- Oral
- Enteral
- Standard Formula
- Disease-Specific Formulas
- Parenteral
- Carbohydrates
- Parenteral Lipid Emulsion
- Single Dose Amino Acid Solution
- Trace Elements
- Vitamins & Minerals
By End User
- Hospitals
- Clinics
- Homecare settings
- Other end-users
By Geography
- New York
- Los Angeles
- Chicago
- Houston
Competitive Landscape
The United States Parenteral Nutrition Market features strong competition led by Fresenius SE & Co KGaA, Baxter International Inc, CSL Ltd, Pfizer Inc, Grifols SA Ordinary Shares Class A, Teva Pharmaceutical Industries Ltd, B. Braun, Otsuka Pharmaceutical, Sichuan Kelun Pharmaceutical, and Allergan. Market players focus on advanced nutrient formulations, improved lipid emulsions, and balanced amino acid mixes that support safer and more effective clinical outcomes. Many companies invest in sterile manufacturing upgrades and automated compounding systems to strengthen product quality and reduce contamination risks. Hospitals and clinics prefer suppliers offering reliable distribution networks and consistent product availability. Firms also enhance training programs, digital monitoring tools, and infusion technologies to improve patient management and reduce line-associated complications. Strategic partnerships with healthcare providers help expand clinical reach, while rising demand for home-based therapy encourages development of portable infusion solutions and tailored nutrition packs.
Key Player Analysis
- Fresenius SE & Co KGaA
- Baxter International Inc
- CSL Ltd
- Pfizer Inc
- Grifols SA Ordinary Shares - Class A
- Teva Pharmaceutical Industries Ltd
- B. Braun
- Otsuka Pharmaceutical
- Sichuan Kelun Pharmaceutical
- Allergan
Recent Developments
- In 2025, Otsuka ICU Medical LLC was formed as a joint venture between Otsuka Pharmaceutical Factory America, Inc. (a subsidiary of Otsuka Pharmaceutical) and ICU Medical.
- In 2025, B. Braun Medical Inc. receive U.S. FDA approval for Piperacillin and Tazobactam for Injection in its DUPLEX Drug Delivery System.
- In 2024, Baxter International Inc. leads developments in U.S. parenteral nutrition with FDA approval in for expanded Clinolipid indications to include pediatric patients, including neonates.
Report Coverage
The research report offers an in-depth analysis based on Product, End-User and Geography. It details leading market players, providing an overview of their business, product offerings, investments, revenue streams, and key applications. Additionally, the report includes insights into the competitive environment, SWOT analysis, current market trends, as well as the primary drivers and constraints. Furthermore, it discusses various factors that have driven market expansion in recent years. The report also explores market dynamics, regulatory scenarios, and technological advancements that are shaping the industry. It assesses the impact of external factors and global economic changes on market growth. Lastly, it provides strategic recommendations for new entrants and established companies to navigate the complexities of the market.
Request a Free Sample
Fill in your details and we'll send you a free sample report.
- Sample data tables & charts
- Research methodology
Need a Custom Version of This Report?
Tailor the scope, geography, or segments to your exact requirements.
- Custom geography or segment scope
- Direct access to our analyst team
Frequently Asked Questions
What is the current market size for United States Parenteral Nutrition Market, and what is its projected size in 2032?
At what Compound Annual Growth Rate is the United States Parenteral Nutrition Market projected to grow between 2025 and 2032?
Which United States Parenteral Nutrition Market segment held the largest share in 2024?
What are the primary factors fueling the growth of the United States Parenteral Nutrition Market?
Who are the leading companies in the United States Parenteral Nutrition Market?
Which region commanded the largest share of the United States Parenteral Nutrition Market in 2024?
Table of Content
Chapter 1. Report Introduction
- 1.1 Report Description & Purpose
- 1.1.1 Report Title & Market Definition
- 1.1.2 Unique Selling Propositions (USP) & Key Differentiators
- 1.1.3 Value Proposition for Stakeholders
- 1.2 Research Objectives
- 1.2.1 Market Sizing Objectives (Volume & Revenue)
- 1.2.2 Segmentation Objectives
- 1.2.3 Competitive Intelligence Objectives
- 1.2.4 Forecast & Scenario Objectives
- 1.3 Report Scope
- 1.3.1 United States Parenteral Nutrition Scope – Types & Subtypes Covered
- 1.3.2 Geographic Scope – Regions & Countries Covered
- 1.3.3 Historical Period, Base Year & Forecast Period (2024; forecast to 2032)
- 1.3.4 Inclusions & Exclusions
- 1.4 HS Code & Classification Framework
- 1.5 Currency, Units & Pricing Basis
- 1.6 Target Stakeholders
- 1.7 Limitations & Assumptions
Chapter 2. Executive Summary
- 2.1 Global United States Parenteral Nutrition Market Snapshot
- 2.1.1 Market Size – Historical (2024) & Forecast (2024-2032) (2024: USD 2,719.56 million → 2032: USD 4,237.38 million)
- 2.1.2 Volume & Revenue – Global Totals
- 2.1.3 Key Market Highlights – Top Five Facts
- 2.2 United States Parenteral Nutrition Market Segmentation Snapshot
- 2.2.1 Market Split by Region – 2024 vs. 2032
- 2.3 Competitive Snapshot
- 2.3.1 Top 10 Players by Revenue Share – 2024
- 2.3.2 Top 10 Players by Volume Share – 2024
- 2.3.3 Recent Strategic Developments (18-Month Summary)
- 2.4 Key Investment Highlights & Strategic Conclusions
Chapter 3. United States Parenteral Nutrition Market Dynamics & Industry Analysis
- 3.1 Market Overview & Context
- 3.1.1 United States Parenteral Nutrition Market Position in the Broader Automotive Value Chain
- 3.1.2 OEM vs. Replacement Market Dynamics
- 3.1.3 Market Maturity & Development Stage by Region
- 3.2 United States Parenteral Nutrition Market Drivers
- 3.3 United States Parenteral Nutrition Market Restraints & Challenges
- 3.4 United States Parenteral Nutrition Market Opportunities
- 3.5 Porter's Five Forces Analysis
- 3.5.1 Threat of New Entrants
- 3.5.2 Bargaining Power of Suppliers
- 3.5.3 Bargaining Power of Buyers
- 3.5.4 Threat of Substitutes
- 3.5.5 Competitive Rivalry – Intensity Assessment
- 3.6 United States Parenteral Nutrition Value Chain Analysis
- 3.6.1 Upstream – Raw Material/Input Suppliers
- 3.6.1.1 Raw Material/Input 1
- 3.6.1.2 Raw Material/Input 2
- 3.6.1.3 Raw Material/Input 3
- 3.6.2 Midstream – Production/Manufacturing/Service Delivery
- 3.6.2.1 Production/Process Overview
- 3.6.2.2 Key Facility Locations & Capacity by Manufacturer
- 3.6.3 Downstream – Distribution & End Consumer
- 3.6.3.1 Primary Channel – B2B/OEM
- 3.6.3.2 Secondary Channels – Dealer, Retail, Online, Direct
- 3.6.4 Value Chain Profitability Analysis
- 3.6.1 Upstream – Raw Material/Input Suppliers
- 3.7 PESTEL Analysis
- 3.7.1 Political Factors
- 3.7.2 Economic Factors
- 3.7.3 Social Factors
- 3.7.4 Technological Factors
- 3.7.5 Environmental Factors
- 3.7.6 Legal Factors
- 3.8 United States Parenteral Nutrition Supply Chain Analysis
- 3.8.1 Raw Material/Input Supply Risk Assessment
- 3.8.2 Manufacturing Concentration Risk (Geographic Exposure)
- 3.8.3 Trade Disruption Impact Analysis
- 3.9 Regulatory & Policy Landscape
Note: The regulatory and policy landscape section covers regulations based on their applicability to the market, United States Parenteral Nutrition category, geography, and scope of the study. Only regulatory frameworks with a material impact on operations, compliance, trade, sustainability, or market access are analyzed in detail.
Chapter 4. Key Investment Pockets & Opportunity Analysis
- 4.1 United States Parenteral Nutrition Market Attractiveness Analysis
- 4.1.1 By Region – Investment Attractiveness Matrix (Volume × CAGR)
- 4.2 Absolute Revenue Growth Opportunity
- 4.2.1 By Region – Absolute USD Growth Through 2032
- 4.3 Incremental Volume Opportunity
- 4.3.1 By Region – Incremental Volume Through 2032
- 4.3.2 Segment – Incremental Volume
- 4.4 Emerging Submarket Opportunity Deep Dive (Subject to Applicability)
- 4.5 Emerging Market Opportunity Scorecards
- 4.5.1 United States
- 4.5.2 Europe
- 4.5.3 Asia
- 4.5.4 Middle East & Africa
Note: Emerging Market Opportunity Scorecards will be included based on relevance and strategic importance. Regions listed are indicative and may vary depending on data availability and market dynamics.
Chapter 5. United States Parenteral Nutrition Import-Export Analysis & Trade Flows
- 5.1 Global Trade Overview
- 5.1.1 Global Export Value by Country (2024)
- 5.1.2 Global Export Volume by Country (2024)
- 5.1.3 Global Import Value by Country (2024)
- 5.1.4 Global Import Volume by Country (2024)
- 5.1.5 Net Trade Balance by Country (2024)
- 5.2 Export Analysis – Segment
- 5.2.1 Type 1 (HS Code)
- 5.2.2 Type 2 (HS Code)
- 5.2.3 Type 3 (HS Code)
- 5.2.4 Type 4 (HS Code)
- 5.2.5 Type 5 (HS Code)
- 5.3 Import Analysis – Segment
- 5.3.1 Type 1 (HS Code)
- 5.3.2 Type 2 (HS Code)
- 5.3.3 Type 3 (HS Code)
- 5.3.4 Type 4 (HS Code)
- 5.3.5 Type 5 (HS Code)
- 5.4 Average Unit Trade Prices
- 5.4.1 Average Export Price – Segment & Country
- 5.4.2 Average Import Price – Segment & Source Country
- 5.4.3 Price Trends (2024)
- 5.5 Key Trade Route Analysis
- 5.5.1 Trade Route 1
- 5.5.2 Trade Route 2
- 5.5.3 Trade Route 3
- 5.5.4 Trade Route 4
- 5.5.5 Trade Route 5
- 5.6 Trade Policy Impact Assessment
- 5.6.1 US Anti-Dumping & Section 301 Tariffs
- 5.6.2 EU Customs Union Impact
- 5.6.3 Major Free Trade Agreements
- 5.6.4 USMCA Rules of Origin
Note: Trade policy analysis will be included only where relevant to the United States Parenteral Nutrition market.
Chapter 6. Competitive Landscape & Company Benchmarking
- 6.1 United States Parenteral Nutrition Market Concentration & Structure
- 6.1.1 Herfindahl-Hirschman Index (HHI) – vs. 2024
- 6.1.2 Tier 1, Tier 2 & Tier 3 Market Structure
- 6.1.3 Global, Regional & Local Player Dynamics
- 6.2 United States Parenteral Nutrition Market Share Analysis – 2024
- 6.2.1 Global Revenue Share by Company
- 6.2.2 Global Volume Share by Company
- 6.2.3 Regional Revenue Share
- 6.2.4 Market Share Evolution ( vs. 2024)
- 6.2.5 OEM Segment Share by Company
- 6.2.6 Replacement Segment Share by Company
- 6.3 Production/Delivery Capacity & Facility Analysis
- 6.3.1 Global Installed Capacity
- 6.3.2 Capacity Utilization Rates
- 6.3.3 Production/Output Volume
- 6.3.4 Facility Locations & Capacity Map
- 6.3.5 Planned Capacity Additions
- 6.4 United States Parenteral Nutrition Competitive Benchmarking Matrix
- 6.4.1 Revenue, Volume, CAGR & Profitability Comparison
- 6.4.2 Channel Revenue Mix
- 6.4.3 Geographic Revenue Exposure
- 6.4.4 R&D Intensity
- 6.4.5 Sustainability Maturity
- 6.5 Strategic Developments in United States Parenteral Nutrition (Last 24 Months)
- 6.5.1 Mergers, Acquisitions & Divestments
- 6.5.2 New United States Parenteral Nutrition Launches
- 6.5.3 Facility Expansions
- 6.5.4 Strategic Alliances, Joint Ventures & Partnerships
- 6.5.5 Distribution Expansion & Market Entry
- 6.5.6 Sustainability & ESG Initiatives
- 6.6 Competitive Strategy Mapping
- 6.6.1 Leader, Challenger, Follower & Niche Classification
- 6.6.2 Pricing Strategy Comparison
- 6.6.3 Channel Strategy Matrix
Note: Strategic developments are included based on their materiality and the availability of reliable information.
Chapter 7. Global United States Parenteral Nutrition Market – By Distribution Channel
- 7.1 Segment Overview
- 7.1.1 Volume & Revenue Split by Channel (2024 & 2032)
- 7.1.2 Channel Mix Evolution (2024-2032)
Chapter 8. Regional Market Analysis – Global Overview
- 8.1 Global Regional Overview
- 8.1.1 Regional Volume Share
- 8.1.2 Regional Revenue Share
- 8.1.3 Regional Volume by Region
- 8.1.4 Regional Revenue by Region
- 8.1.5 Regional Forecast Through 2032
- 8.2 Cross-Regional Segment Analysis
- 8.2.1 By Distribution Channel
- 8.2.2 By Brand/Price Tier
Chapter 9. North America United States Parenteral Nutrition Market
- 9.1 United States
- 9.2 Canada
- 9.3 Mexico
Chapter 10. Europe United States Parenteral Nutrition Market
- 10.1 Germany
- 10.2 France
- 10.3 Italy
- 10.4 United Kingdom
- 10.5 Spain
- 10.6 Poland
- 10.7 Russia
- 10.8 Netherlands
- 10.9 Belgium
- 10.10 Sweden
- 10.11 Denmark
- 10.12 Norway
- 10.13 Rest of Europe
Chapter 11. Asia Pacific United States Parenteral Nutrition Market
- 11.1 China
- 11.2 India
- 11.3 Japan
- 11.4 South Korea
- 11.5 Thailand
- 11.6 Indonesia
- 11.7 Vietnam
- 11.8 Malaysia
- 11.9 Australia
- 11.10 Rest of Asia Pacific
Chapter 12. Latin America United States Parenteral Nutrition Market
- 12.1 Brazil
- 12.2 Argentina
- 12.3 Colombia
- 12.4 Chile
- 12.5 Rest of Latin America
Chapter 13. Middle East United States Parenteral Nutrition Market
- 13.1 Saudi Arabia
- 13.2 United Arab Emirates
- 13.3 Turkey
- 13.4 Israel
- 13.5 Iran
- 13.6 Rest of the Middle East
Chapter 14. Africa United States Parenteral Nutrition Market
- 14.1 South Africa
- 14.2 Egypt
- 14.3 Nigeria
- 14.4 Morocco
- 14.5 Rest of Africa
Chapter 15. United States Parenteral Nutrition Company Profiles
- 15.1 [Company 01]
- 15.1.1 Company Overview
- 15.1.2 Key Management Personnel
- 15.1.3 Products & Services Portfolio
- 15.1.4 Financial Performance
- 15.1.5 Key Market Focus & Geographic Presence
- 15.1.6 Recent Developments & Strategic Initiatives
Note: The company profile list is preliminary and may change based on research findings, market developments, data availability, and client requirements.
Chapter 16. Appendices
- Appendix A – List of Abbreviations & Acronyms
- Appendix B – Industry Classification Code Reference – Full Series
- Appendix C – Production & Capacity Data Tables
- Appendix D – End-Use & Demand Base Tables
- Appendix E – Consumption & Replacement Rate Assumptions
- Appendix F – ASP Reference Tables
- Appendix G – Manufacturing & Facility Database
- Appendix H – Import-Export Data Tables
- Appendix I – Regulatory Summary Tables
- Appendix J – Primary Research Participant List (Anonymized)
- Appendix K – Primary Research Questionnaire Framework
- Appendix L – Data Sources & Bibliography
- Appendix M – Market Size Divergence & Source Comparison
Chapter 17. Research Methodology
- 17.1 Research Framework & Philosophy
- 17.2 Secondary Research – Sources, Hierarchy & Data Extraction
- 17.3 Data Modeling – Bottom-Up & Top-Down Market Sizing
- 17.4 Primary Research – Stakeholder Framework, LOI & Sample Sizes
- 17.5 Forecast Methodology – Regression, Scenario & Sensitivity Analysis
- 17.6 Quality Control – Four-Layer Validation Framework
- 17.7 Limitations & Standard Assumptions
- 17.8 Disclaimer
