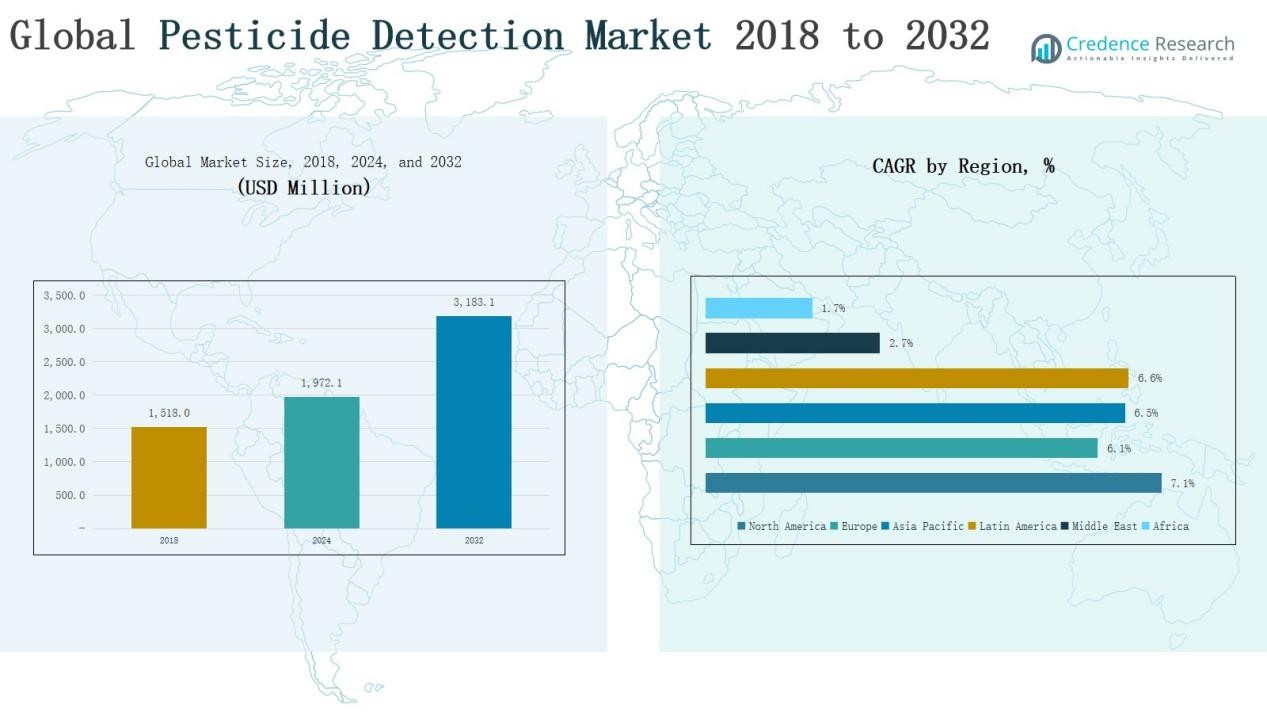
The Global Pesticide Detection Market was valued at USD 1,518.0 million in 2018, increased to USD 1,972.1 million in 2024, and is anticipated to reach USD 3,183.1 million by 2032, growing at a CAGR of 6.29% during the forecast period.
REPORT ATTRIBUTE
DETAILS
Historical Period
2020-2023
Base Year
2024
Forecast Period
2025-2032
Pesticide Detection Market Size 2024
USD 1,972.1 Million
Pesticide Detection Market, CAGR
6.29%
Pesticide Detection Market Size 2032
USD 3,183.1 Million
The Global Pesticide Detection Market is driven by major players such as Thermo Fisher Scientific Inc., Agilent Technologies, Shimadzu Corporation, Waters Corporation, PerkinElmer Inc., SGS SA, Sciex, Renka Bio, Equinox Lab, and Spensa Karlabs. These companies lead through innovations in chromatography, spectroscopy, and biosensor-based detection technologies, providing high-precision solutions for food safety and environmental monitoring. Strategic collaborations, product diversification, and technological advancements strengthen their global footprint. North America emerged as the leading region in 2024, capturing a 33% market share, supported by robust regulatory frameworks, advanced testing infrastructure, and strong demand from analytical laboratories.
Pesticide Detection Market Insights
The Global Pesticide Detection Market was valued at USD 1,972.1 million in 2024 and is expected to reach USD 3,183.1 million by 2032, growing at a CAGR of 6.29%.
Chromatography-based technology dominated with a 42% share in 2024, driven by its precision, reproducibility, and compatibility across multiple pesticide detection applications.
Food & beverage samples led the market with a 46% share, supported by strict safety regulations and advanced multi-residue analysis techniques.
Environmental testing laboratories accounted for a 38% share, supported by strong demand for pollution control and regulatory compliance monitoring.
North America led the global market with a 33% share in 2024, fueled by FDA and EPA regulations, advanced analytical infrastructure, and high adoption of testing technologies.
Pesticide Detection Market Segment Insights
By Technology:
Chromatography-based technology dominated the Global Pesticide Detection Market in 2024 with a 42% share. Its precision, reproducibility, and compatibility with multiple pesticide classes make it the preferred choice across testing laboratories. High-performance liquid chromatography (HPLC) and gas chromatography (GC) remain key tools for regulatory compliance and trace-level detection. Growing investments in advanced column materials and automated systems continue to strengthen adoption across environmental and food safety applications, supporting the market’s overall technological advancement.
For instance, Shimadzu Corporation launched the Nexera UC hybrid SFC-HPLC system, enabling faster separation of pesticide residues in complex food matrices.
By Sample:
Food & beverage samples accounted for the largest market share of 46% in 2024, driven by stringent global food safety standards and increased consumer awareness of pesticide residues. Regulatory bodies such as the FDA and EFSA enforce strict limits, boosting demand for reliable residue monitoring in processed foods, fruits, and vegetables. Advancements in multi-residue analysis and portable testing kits are enhancing real-time detection capabilities across manufacturing and distribution points.
For instance, Shimadzu launched its LC/MS-2050 system, allowing simultaneous detection of over 500 pesticide residues in fruit and vegetable batches for European exporters.
By End User:
Environmental testing laboratories led the market with a 38% share in 2024, owing to their critical role in regulatory compliance, contamination monitoring, and pollution control. The rise in environmental surveillance programs and water quality assessments has significantly boosted analytical service demand. Advanced laboratories are increasingly adopting integrated biosensor and spectroscopy tools to improve detection efficiency and reduce analysis time, supporting rapid and accurate pesticide identification in diverse ecosystems.
Access crucial information at unmatched prices!
Request your sample report today & start making informed decisions powered by Credence Research Inc.!
Stringent global regulations on pesticide residue limits drive the need for advanced detection systems. Agencies such as the FDA, EFSA, and WHO enforce strict compliance to ensure food quality and consumer safety. This regulatory push compels food manufacturers and testing laboratories to adopt high-precision analytical tools like chromatography and spectroscopy. Growing export standards and international trade requirements further accelerate the use of pesticide detection technologies across the food, agriculture, and environmental sectors.
For instance, Thermo Fisher Scientific unveiled the TSQ 9610 GC-MS/MS platform, engineered for food safety labs to comply with updated FDA residue limits in processed fruit and vegetable testing.
Technological Advancements in Detection Methods
Continuous innovation in analytical chemistry and biosensor technology fuels market expansion. Modern detection systems now deliver faster results, improved accuracy, and lower detection limits. The integration of automation, microfluidics, and AI-based data interpretation enhances efficiency in laboratory and on-site applications. These advancements reduce testing time and costs while enabling multi-residue screening, making them vital for regulatory compliance and real-time monitoring across industries such as food safety and environmental management.
For instance, Agilent Technologies updated its 7800 ICP-MS System with advanced multi-residue screening capabilities, allowing environmental labs to simultaneously detect over 60 trace elements in water samples with detection limits below 0.1 ppb.
Growth in Agricultural and Environmental Monitoring
Expanding agricultural production and rising pesticide usage globally create strong demand for monitoring solutions. Environmental agencies and agricultural research institutions increasingly invest in advanced detection technologies to assess soil, water, and crop contamination. This growth is further supported by sustainability initiatives and eco-friendly farming practices, emphasizing pesticide traceability and pollution control. The trend strengthens partnerships between technology providers, governments, and laboratories to develop comprehensive monitoring frameworks.
Key Trends & Opportunities
Adoption of Portable and Real-Time Detection Devices
Portable pesticide analyzers and handheld biosensors are transforming field-based testing. These tools enable rapid, on-site detection with minimal sample preparation, improving decision-making in agricultural and environmental monitoring. Growing demand from developing countries, where laboratory infrastructure is limited, presents a major growth opportunity. The integration of wireless connectivity and data analytics further enhances traceability and reporting accuracy across supply chains.
For instance, Agilent Technologies offers portable pesticide analyzers used worldwide for real-time field analysis, allowing farmers to assess contamination levels immediately.
Rising Use of Biosensor-Based Technologies
Biosensor-based pesticide detection is gaining momentum due to its speed, selectivity, and low cost. These systems utilize biological elements such as enzymes and antibodies for sensitive residue detection. Their miniaturized and user-friendly designs make them ideal for point-of-care and in-field testing. Increasing research investments and collaborations between academic institutions and biotech firms are expanding the application scope of biosensors in food safety, environmental health, and water quality assessment.
For instance, Iowa State University researchers created a flexible, disposable graphene-ink biosensor that can detect pesticides in soil within minutes.
Key Challenges
High Cost of Advanced Analytical Instruments
Sophisticated technologies like LC-MS/MS and GC-MS require substantial capital investment and maintenance. These costs limit adoption among small laboratories and developing regions. The need for skilled operators further increases operational expenses. This economic barrier slows widespread technology penetration, particularly in cost-sensitive agricultural and food processing sectors that rely on low-budget testing solutions.
Complexity of Multi-Residue Detection
Detecting multiple pesticide residues simultaneously remains technically challenging. Variations in chemical structures, concentrations, and matrices demand complex sample preparation and calibration. Despite advances in analytical methods, ensuring consistent accuracy across diverse pesticide classes is difficult. This complexity often results in longer testing cycles and limits throughput in high-volume laboratories, affecting efficiency and scalability.
Limited Infrastructure in Developing Regions
Developing nations face significant gaps in testing infrastructure, trained personnel, and quality control frameworks. Many regions lack accredited laboratories and modern equipment necessary for reliable pesticide analysis. Weak regulatory enforcement and low awareness among farmers further hinder market growth. Addressing these barriers requires public-private partnerships and investments in laboratory modernization, capacity building, and affordable portable detection systems.
Regional Analysis
North America
The North America Pesticide Detection Market was valued at USD 489.6 million in 2018, increased to USD 653.8 million in 2024, and is projected to reach USD 1,052.3 million by 2032, expanding at a CAGR of 6.7%. The region held a 33% share in 2024, driven by strict regulatory enforcement by the FDA and EPA and the presence of major analytical technology providers. Strong demand from food and environmental testing laboratories, coupled with advanced research capabilities and government-supported monitoring initiatives, sustains market growth across the United States and Canada.
Europe
Europe accounted for a 28% market share in 2024, with the market growing from USD 425.0 million in 2018 to USD 552.2 million in 2024, and it is expected to reach USD 873.0 million by 2032, at a CAGR of 6.1%. Growth is primarily supported by stringent pesticide residue limits set by the European Food Safety Authority (EFSA) and growing investments in food quality control infrastructure. Widespread adoption of chromatography and biosensor-based methods across countries such as Germany, France, and the UK enhances traceability and regulatory compliance in the food and agriculture industries.
Asia Pacific
Asia Pacific emerged as the fastest-growing regional market, capturing a 25% share in 2024. It was valued at USD 379.5 million in 2018, rose to USD 493.0 million in 2024, and is projected to reach USD 889.3 million by 2032, expanding at a CAGR of 7.7%. Growth is driven by increasing pesticide usage in agriculture, rising awareness of food contamination, and expanding government-led monitoring programs. Rapid urbanization, along with advancements in portable detection technologies, fuels adoption in major markets such as China, Japan, India, and South Korea.
Latin America
The Latin America Pesticide Detection Market held an 8% share in 2024, with values increasing from USD 121.4 million in 2018 to USD 157.8 million in 2024, and projected to reach USD 245.6 million by 2032, at a CAGR of 5.6%. Market growth is supported by increasing agricultural exports, stricter residue regulations, and growing use of analytical technologies in Brazil and Argentina. Adoption of cost-effective and rapid testing solutions is expanding, supported by collaborations between government agencies and private laboratories focused on improving food safety compliance.
Middle East & Africa
The Middle East & Africa region collectively accounted for a 6% share in 2024. The market grew from USD 102.5 million in 2018 to USD 115.3 million in 2024, and is projected to reach USD 123.0 million by 2032, expanding at a CAGR of 5.1%. Growth is driven by increasing government focus on water and soil testing, rising awareness of pesticide contamination, and expanding laboratory networks. However, limited infrastructure and high equipment costs continue to challenge widespread adoption, especially across African nations, where portable and biosensor-based solutions show rising potential.
Pesticide Detection Market Segmentations:
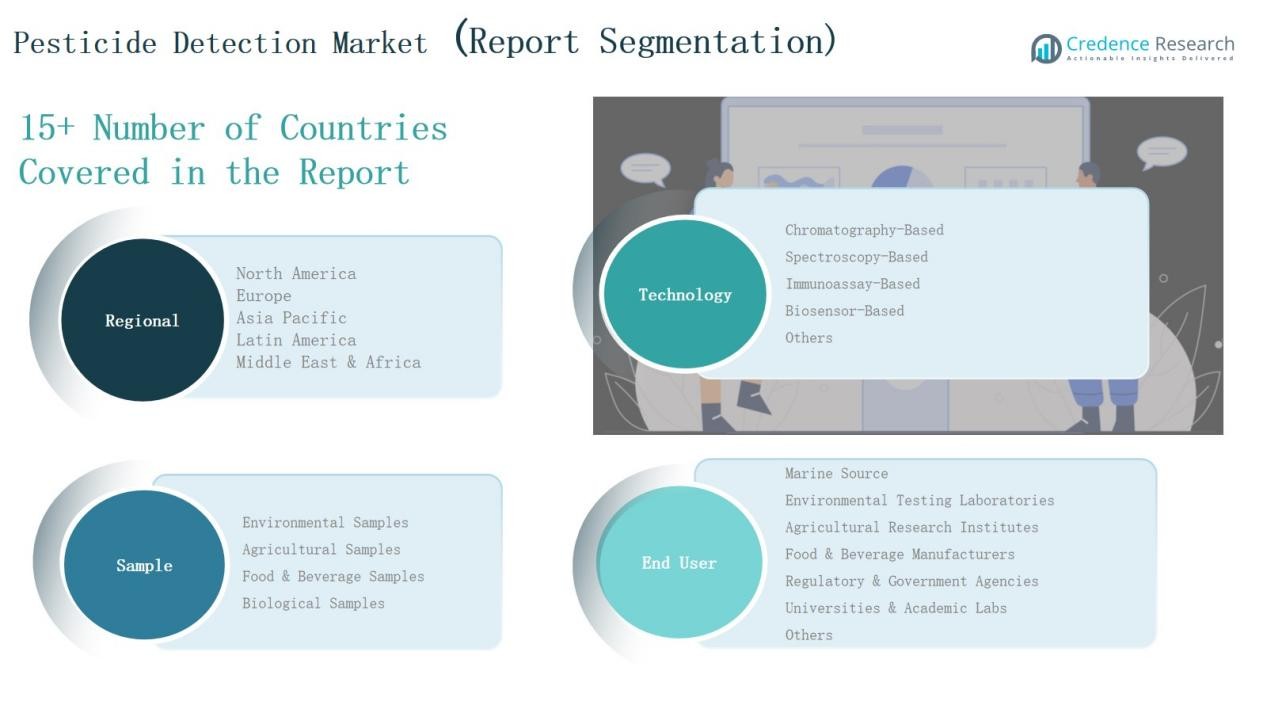
By Technology:
Chromatography-Based
Spectroscopy-Based
Immunoassay-Based
Biosensor-Based
Others
By Sample:
Environmental Samples
Agricultural Samples
Food & Beverage Samples
Biological Samples
By End User:
Marine Source
Environmental Testing Laboratories
Agricultural Research Institutes
Food & Beverage Manufacturers
Regulatory & Government Agencies
Universities & Academic Labs
Others
By Region:
North America
U.S.
Canada
Mexico
Europe
Germany
France
U.K.
Italy
Spain
Rest of Europe
Asia Pacific
China
Japan
India
South Korea
South-east Asia
Rest of Asia Pacific
Latin America
Brazil
Argentina
Rest of Latin America
Middle East & Africa
GCC Countries
South Africa
Rest of the Middle East and Africa
Competitive Landscape
The Global Pesticide Detection Market is moderately fragmented, featuring a mix of multinational corporations and regional analytical service providers. Leading players such as Thermo Fisher Scientific Inc., Agilent Technologies, Shimadzu Corporation, Waters Corporation, PerkinElmer Inc., SGS SA, Sciex, and Renka Bio dominate through advanced detection instruments, chromatography systems, and biosensor technologies. These companies focus on enhancing precision, automation, and multi-residue capabilities to meet evolving food safety regulations. Strategic partnerships, mergers, and R&D investments strengthen their technological portfolios and global distribution networks. Regional laboratories and niche firms like Equinox Lab and Spensa Karlabs contribute by offering specialized testing services and portable analytical solutions. Sustainability initiatives, cost-effective biosensors, and AI-based analysis tools are reshaping competition, driving innovation toward faster and more reliable detection methods. Overall, competition is intensifying as companies expand in emerging markets, develop user-friendly devices, and pursue integrated digital solutions for real-time pesticide residue monitoring.
Shape Your Report to Specific Countries or Regions & Enjoy 30% Off!
In October 2024, Harbin Medical University unveiled a SERS imaging technique that enables ultra-sensitive, noninvasive detection of pesticide residues in crops.
In October 2025, Syngenta partnered with Taranis to enhance AI-powered crop intelligence platforms supporting pesticide application and residue monitoring.
In October 2025, Corteva announced the separation of its seed and pesticide divisions into two listed entities to improve operational focus and efficiency.
In July 2025, Mérieux NutriSciences completed the acquisition of Bureau Veritas’ food testing operations in Ecuador, expanding its global food safety and residue testing network.
Report Coverage
The research report offers an in-depth analysis based on Technology, Sample, End User and Region. It details leading market players, providing an overview of their business, product offerings, investments, revenue streams, and key applications. Additionally, the report includes insights into the competitive environment, SWOT analysis, current market trends, as well as the primary drivers and constraints. Furthermore, it discusses various factors that have driven market expansion in recent years. The report also explores market dynamics, regulatory scenarios, and technological advancements that are shaping the industry. It assesses the impact of external factors and global economic changes on market growth. Lastly, it provides strategic recommendations for new entrants and established companies to navigate the complexities of the market.
Future Outlook
Demand for rapid and portable pesticide detection devices will continue to rise globally.
Integration of AI and machine learning will enhance data accuracy and residue prediction.
Biosensor-based systems will gain strong adoption for on-site and low-cost testing.
Growing regulatory enforcement will increase testing frequency across food supply chains.
Expansion of certified laboratories in developing countries will strengthen regional monitoring capacity.
Automation and robotics will improve throughput in large-scale testing facilities.
Partnerships between governments and private firms will boost technology development and awareness.
Cloud-based reporting systems will streamline result sharing and regulatory documentation.
Demand from environmental agencies for soil and water testing will expand significantly.
Continuous R&D investments will drive innovation toward faster, sensitive, and eco-friendly detection technologies.
CHAPTER NO. 1 : GENESIS OF THE MARKET
1.1 Market Prelude – Introduction & Scope
1.2 The Big Picture – Objectives & Vision
1.3 Strategic Edge – Unique Value Proposition
1.4 Stakeholder Compass – Key Beneficiaries CHAPTER NO. 2 : EXECUTIVE LENS
2.1 Pulse of the Industry – Market Snapshot
2.2 Growth Arc – Revenue Projections (USD Million)
2.3. Premium Insights – Based on Primary Interviews CHAPTER NO. 3 : PESTICIDE DETECTION MARKET FORCES & INDUSTRY PULSE
3.1 Foundations of Change – Market Overview
3.2 Catalysts of Expansion – Key Market Drivers
3.2.1 Momentum Boosters – Growth Triggers
3.2.2 Innovation Fuel – Disruptive Technologies
3.3 Headwinds & Crosswinds – Market Restraints
3.3.1 Regulatory Tides – Compliance Challenges
3.3.2 Economic Frictions – Inflationary Pressures
3.4 Untapped Horizons – Growth Potential & Opportunities
3.5 Strategic Navigation – Industry Frameworks
3.5.1 Market Equilibrium – Porter’s Five Forces
3.5.2 Ecosystem Dynamics – Value Chain Analysis
3.5.3 Macro Forces – PESTEL Breakdown CHAPTER NO. 4 : KEY INVESTMENT EPICENTER
4.1 Regional Goldmines – High-Growth Geographies
4.2 Product Frontiers – Lucrative Technology Categories
4.3 End User Sweet Spots – Emerging Demand Segments CHAPTER NO. 5: REVENUE TRAJECTORY & WEALTH MAPPING
5.1 Momentum Metrics – Forecast & Growth Curves
5.2 Regional Revenue Footprint – Market Share Insights
5.3 Segmental Wealth Flow – Technology, Sample, and End User Revenue CHAPTER NO. 6 : TRADE & COMMERCE ANALYSIS
6.1. Import Analysis By Region
6.1.1. Global Pesticide Detection Market Import Revenue By Region
6.2. Export Analysis By Region
6.2.1. Global Pesticide Detection Market Export Revenue By Region CHAPTER NO. 7 : COMPETITION ANALYSIS
7.1. Company Market Share Analysis
7.1.1. Global Pesticide Detection Market: Company Market Share
7.2. Global Pesticide Detection Market Company Revenue Market Share
7.3. Strategic Developments
7.3.1. Acquisitions & Mergers
7.3.2. New Product Launch
7.3.3. Regional Expansion
7.4. Competitive Dashboard
7.5. Company Assessment Metrics, 2024 CHAPTER NO. 8 : PESTICIDE DETECTION MARKET – BY TECHNOLOGY SEGMENT ANALYSIS
8.1. Pesticide Detection Market Overview By Technology Segment
8.1.1. Pesticide Detection Market Revenue Share By Technology
8.2. Chromatography-Based
8.3. Spectroscopy-Based
8.4. Immunoassay-Based
8.5. Biosensor-Based
8.6. Others CHAPTER NO. 9 : PESTICIDE DETECTION MARKET – BY SAMPLE SEGMENT ANALYSIS
9.1. Pesticide Detection Market Overview By Sample Segment
9.1.1. Pesticide Detection Market Revenue Share By Sample
9.2. Environmental Samples
9.3. Agricultural Samples
9.4. Food & Beverage Samples
9.5. Biological Samples CHAPTER NO. 10 : PESTICIDE DETECTION MARKET – BY END USER SEGMENT ANALYSIS
10.1. Pesticide Detection Market Overview By End User Segment
10.1.1. Pesticide Detection Market Revenue Share By End User
10.2. Marine Source
10.3. Environmental Testing Laboratories
10.4. Agricultural Research Institutes
10.5. Food & Beverage Manufacturers
10.6. Regulatory & Government Agencies
10.7. Universities & Academic Labs
10.8. Others CHAPTER NO. 11 : PESTICIDE DETECTION MARKET – REGIONAL ANALYSIS
11.1. Pesticide Detection Market Overview By Region Segment
11.1.1. Global Pesticide Detection Market Revenue Share By Region
10.1.2. Regions
11.1.3. Global Pesticide Detection Market Revenue By Region
11.1.4. Technology
11.1.5. Global Pesticide Detection Market Revenue By Technology
11.1.6. Sample
11.1.7. Global Pesticide Detection Market Revenue By Sample
11.1.8. End User
11.1.9. Global Pesticide Detection Market Revenue By End User CHAPTER NO. 12 : NORTH AMERICA PESTICIDE DETECTION MARKET – COUNTRY ANALYSIS
12.1. North America Pesticide Detection Market Overview By Country Segment
12.1.1. North America Pesticide Detection Market Revenue Share By Region
12.2. North America
12.2.1. North America Pesticide Detection Market Revenue By Country
12.2.2. Technology
12.2.3. North America Pesticide Detection Market Revenue By Technology
12.2.4. Sample
12.2.5. North America Pesticide Detection Market Revenue By Sample
12.2.6. End User
12.2.7. North America Pesticide Detection Market Revenue By End User
12.3. U.S.
12.4. Canada
12.5. Mexico CHAPTER NO. 13 : EUROPE PESTICIDE DETECTION MARKET – COUNTRY ANALYSIS
13.1. Europe Pesticide Detection Market Overview By Country Segment
13.1.1. Europe Pesticide Detection Market Revenue Share By Region
13.2. Europe
13.2.1. Europe Pesticide Detection Market Revenue By Country
13.2.2. Technology
13.2.3. Europe Pesticide Detection Market Revenue By Technology
13.2.4. Sample
13.2.5. Europe Pesticide Detection Market Revenue By Sample
13.2.6. End User
13.2.7. Europe Pesticide Detection Market Revenue By End User
13.3. UK
13.4. France
13.5. Germany
13.6. Italy
13.7. Spain
13.8. Russia
13.9. Rest of Europe CHAPTER NO. 14 : ASIA PACIFIC PESTICIDE DETECTION MARKET – COUNTRY ANALYSIS
14.1. Asia Pacific Pesticide Detection Market Overview By Country Segment
14.1.1. Asia Pacific Pesticide Detection Market Revenue Share By Region
14.2. Asia Pacific
14.2.1. Asia Pacific Pesticide Detection Market Revenue By Country
14.2.2. Technology
14.2.3. Asia Pacific Pesticide Detection Market Revenue By Technology
14.2.4. Sample
14.2.5. Asia Pacific Pesticide Detection Market Revenue By Sample
14.2.6. End User
14.2.7. Asia Pacific Pesticide Detection Market Revenue By End User
14.3. China
14.4. Japan
14.5. South Korea
14.6. India
14.7. Australia
14.8. Southeast Asia
14.9. Rest of Asia Pacific CHAPTER NO. 15 : LATIN AMERICA PESTICIDE DETECTION MARKET – COUNTRY ANALYSIS
15.1. Latin America Pesticide Detection Market Overview By Country Segment
15.1.1. Latin America Pesticide Detection Market Revenue Share By Region
15.2. Latin America
15.2.1. Latin America Pesticide Detection Market Revenue By Country
15.2.2. Technology
15.2.3. Latin America Pesticide Detection Market Revenue By Technology
15.2.4. Sample
15.2.5. Latin America Pesticide Detection Market Revenue By Sample
15.2.6. End User
15.2.7. Latin America Pesticide Detection Market Revenue By End User
15.3. Brazil
15.4. Argentina
15.5. Rest of Latin America CHAPTER NO. 16 : MIDDLE EAST PESTICIDE DETECTION MARKET – COUNTRY ANALYSIS
16.1. Middle East Pesticide Detection Market Overview By Country Segment
16.1.1. Middle East Pesticide Detection Market Revenue Share By Region
16.2. Middle East
16.2.1. Middle East Pesticide Detection Market Revenue By Country
16.2.2. Technology
16.2.3. Middle East Pesticide Detection Market Revenue By Technology
16.2.4. Sample
16.2.5. Middle East Pesticide Detection Market Revenue By Sample
16.2.6. End User
16.2.7. Middle East Pesticide Detection Market Revenue By End User
16.3. GCC Countries
16.4. Israel
16.5. Turkey
16.6. Rest of Middle East CHAPTER NO. 17 : AFRICA PESTICIDE DETECTION MARKET – COUNTRY ANALYSIS
17.1. Africa Pesticide Detection Market Overview By Country Segment
17.1.1. Africa Pesticide Detection Market Revenue Share By Region
17.2. Africa
17.2.1. Africa Pesticide Detection Market Revenue By Country
17.2.2. Technology
17.2.3. Africa Pesticide Detection Market Revenue By Technology
17.2.4. Sample
17.2.5. Africa Pesticide Detection Market Revenue By Sample
17.2.6. End User
17.2.7. Africa Pesticide Detection Market Revenue By End User
17.3. South Africa
17.4. Egypt
17.5. Rest of Africa CHAPTER NO. 18 : COMPANY PROFILES
18.1. SGS SA
18.1.1. Company Overview
18.1.2. Product Portfolio
18.1.3. Financial Overview
18.1.4. Recent Developments
18.1.5. Growth Strategy
18.1.6. SWOT Analysis
18.2. Renka Bio
18.3. Sciex
18.4. Equinox Lab
18.5. Agilent Technologies
18.6. PerkinElmer Inc.
18.7. Shimadzu Corporation
18.8. Waters Corporation
18.9. Thermo Fisher Scientific
18.10. Spensa Karlabs
18.11. Other Key Players
Request A Free Sample
We prioritize the confidentiality and security of your data. Our promise: your information remains private.
Ready to Transform Data into Decisions?
Request Your Sample Report and Start Your Journey of Informed Choices
Providing the strategic compass for industry titans.
Frequently Asked Questions
What is the current market size for Global Pesticide Detection Market, and what is its projected size in 2032?
The Global Pesticide Detection Market was valued at USD 1,972.1 million in 2024 and is projected to reach USD 3,183.1 million by 2032.
At what Compound Annual Growth Rate is the Global Pesticide Detection Market projected to grow between 2025 and 2032?
The Global Pesticide Detection Market is projected to grow at a steady Compound Annual Growth Rate (CAGR) of 6.29% during the forecast period of 2025–2032.
Which Global Pesticide Detection Market segment held the largest share in 2024?
The Chromatography-based technology segment dominated the Global Pesticide Detection Market in 2024, accounting for the largest market share of 42% due to high precision.
Who are the leading companies in the Global Pesticide Detection Market?
Major players include Thermo Fisher Scientific Inc., Agilent Technologies, Shimadzu Corporation, PerkinElmer Inc., Waters Corporation, SGS SA, Sciex, and Renka Bio.
Which region commanded the largest share of the Global Pesticide Detection Market in 2024?
North America led the Global Pesticide Detection Market in 2024, capturing a 33% share due to strong regulatory frameworks and advanced laboratory infrastructure.
About Author
Shweta Bisht
Healthcare & Biotech Analyst
Shweta is a healthcare and biotech researcher with strong analytical skills in chemical and agri domains.
Lawn And Garden Consumables Market size was valued USD 22918.6 million in 2024 and is anticipated to reach USD 36035.47 million by 2032, at a CAGR of 5.82% during the forecast period.
Soil Monitoring market size was valued at USD 734 Million in 2024 and is anticipated to reach USD 2,137.12 Million by 2032, at a CAGR of 14.3% during the forecast period.
Forage Feed market size was valued USD 123,439 Million in 2024 and is anticipated to reach USD 204,290.4 Million by 2032, at a CAGR of 6.5% during the forecast period.
The landscaping and gardening services market was valued at USD 123,478.6 million in 2024 and is projected to reach USD 180,222 million by 2032, expanding at a CAGR of 4.84% over the forecast period.
The plant molecular farming market was valued at USD 219 million in 2024 and is projected to reach USD 1,336.08 million by 2032, expanding at a compound annual growth rate (CAGR) of 25.4% during the forecast period (2025-2032).
The global rodenticides market was valued at USD 5,596 million in 2024 and is projected to reach USD 8,640.84 million by 2032, expanding at a CAGR of 5.58% during the forecast period.
The global spinosad active ingredient market was valued at USD 589 million in 2024 and is anticipated to reach USD 1,118.98 million by 2032, expanding at a compound annual growth rate (CAGR) of 8.36% during the forecast period.
The global biodegradable agrochemicals market was valued at USD 4,549 million in 2024 and is projected to reach USD 7,815.34 million by 2032, expanding at a compound annual growth rate (CAGR) of 7% during the forecast period.
The Asia Pacific soil remediation market was valued at USD 15,649 million in 2024 and is projected to reach USD 27,992.12 million by 2032, expanding at a compound annual growth rate (CAGR) of 7.54% during the forecast period.
Fishmeal market size was valued USD 10,184.48 Million in 2024 and is anticipated to reach USD 17,643.27 Million by 2032, at a CAGR of 7.11% during the forecast period.
The global Dicamba Herbicide Market size was estimated at USD 2,468.37 million in 2025 and is expected to reach USD 3,275.85 million by 2032, growing at a CAGR of 4.83% from 2025 to 2032.
The Thailand Crop Protection Chemicals Pesticides Market size was estimated at USD 2,684.17 million in 2025 and is expected to reach USD 3,625.92 million by 2032, growing at a CAGR of 5.14% from 2025 to 2032.
Licence Option
The report comes as a view-only PDF document, optimized for individual clients. This version is recommended for personal digital use and does not allow printing. Use restricted to one purchaser only.
$4999
To meet the needs of modern corporate teams, our report comes in two formats: a printable PDF and a data-rich Excel sheet. This package is optimized for internal analysis. Unlimited users allowed within one corporate location (e.g., regional office).
$5999
The report will be delivered in printable PDF format along with the report’s data Excel sheet. This license offers 100 Free Analyst hours where the client can utilize Credence Research Inc. research team. Permitted for unlimited global use by all users within the purchasing corporation, such as all employees of a single company.
Thank you for the data! The numbers are exactly what we asked for and what we need to build our business case.
Materials Scientist (privacy requested)
The report was an excellent overview of the Industrial Burners market. This report does a great job of breaking everything down into manageable chunks.