
Market Overview
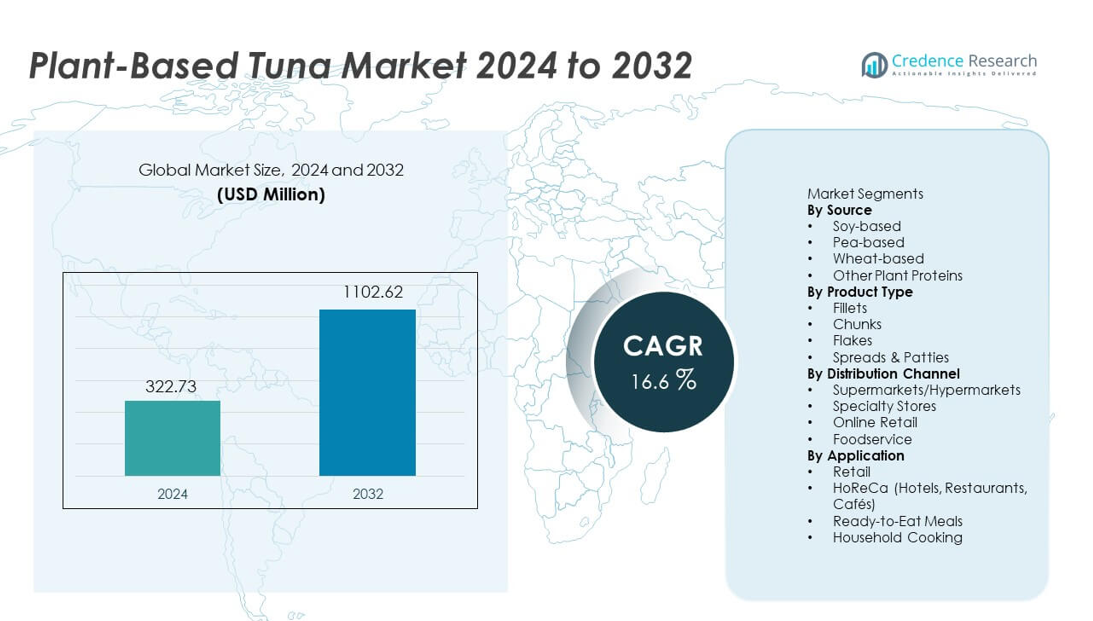
The Plant-Based Tuna Market reached USD 322.73 million in 2024 and is projected to grow to USD 1,102.62 million by 2032, expanding at a CAGR of 16.6% during the forecast period.
| REPORT ATTRIBUTE | DETAILS |
|---|---|
| Historical Period | 2020-2023 |
| Base Year | 2024 |
| Forecast Period | 2025-2032 |
| Plant-Based Tuna Market Size 2024 | USD 322.73 million |
| Plant-Based Tuna Market, CAGR | 16.6% |
| Plant-Based Tuna Market Size 2032 | USD 1,102.62 million |
The Plant-Based Tuna market is shaped by leading innovators including Good Catch Foods, Ocean Hugger Foods, Sophie’s Kitchen, TUNO, New Wave Foods, Loma Linda, Akua, Wild Type, Kuleana, and Sushi Mushi, all of which focus on sustainable ingredients, improved texture engineering, and cleaner nutritional profiles. These companies expand global reach through wider retail placement, foodservice partnerships, and region-specific flavor development. North America leads the market with 38% share, driven by strong consumer interest in mercury-free seafood alternatives, rapid product innovation, and expanding supermarket availability, making it the most influential region in driving category adoption.
Market Insights
- The Plant-Based Tuna market reached USD 322.73 million in 2024 and will grow to USD 1,102.62 million by 2032 at a 16.6% CAGR, supported by rising demand for sustainable seafood alternatives.
- Market growth is driven by health awareness, interest in ocean-safe products, and strong performance of soy-based tuna, which holds 44% share due to its texture and protein density.
- Key trends include rapid innovation in algae-based flavor systems, improved extrusion for flaky texture, and expanding demand for chunk-style products, which lead the category with 41% share.
- Competition intensifies as brands enhance product authenticity and expand foodservice presence, while high production costs and ingredient price variability remain key restraints.
- Regionally, North America holds 38% share, Europe captures 33%, and Asia Pacific accounts for 20%, driven by strong flexitarian adoption, clean-label demand, and widening retail distribution.
Market Segmentation Analysis:
By Source
Soy-based tuna holds the dominant position with 44% share, driven by its strong protein content, firm texture, and ability to replicate traditional tuna profiles more accurately than other plant proteins. Manufacturers prefer soy due to its processing stability and wide availability, which supports consistent large-scale production. Pea-based variants grow steadily as allergen-friendly demand rises, while wheat-based options gain niche traction in blended formulations. Other plant proteins, including fava bean and chickpea, expand innovation opportunities, but soy remains the leading source due to superior binding performance and consumer familiarity across retail and foodservice sectors.
- For instance, Schouten Food produces a vegan tuna using soy protein that is widely distributed in European retail chains, benefiting from soy’s reliable supply.
By Product Type
Chunks lead the market with 41% share, supported by their versatility in salads, sandwiches, and ready meals. Consumers prefer chunk-style products because they closely mimic the texture and bite of conventional tuna, which drives strong adoption in both retail and HoReCa channels. Fillets appeal to premium buyers seeking whole-cut experiences, while flakes gain traction in prepared meals and spreads. Spreads & patties expand as convenient protein-rich options for quick snacks. Chunk formats remain dominant due to broad culinary compatibility, ease of use, and strong acceptance among first-time plant-based seafood buyers.
- For instance, Good Catch Foods markets chunk-style plant-based tuna alternatives that combine multiple proteins (pea, soy, chickpea, broad bean, lentil, white bean), allowing flexible use in sandwiches or salads.
By Distribution Channel
Supermarkets and hypermarkets dominate distribution with 53% share, benefiting from wide shelf presence, strong brand visibility, and frequent in-store promotions. These outlets provide easier access for mainstream consumers, supporting higher conversion rates for emerging plant-based seafood products. Specialty stores grow through targeted health-focused assortments, while online retail accelerates due to home delivery convenience and rapid expansion of vegan marketplaces. Foodservice adoption rises as restaurants explore sustainable seafood alternatives. However, supermarkets remain the leading channel due to their scale, diverse consumer base, and ability to introduce new brands effectively.
Key Growth Drivers
Rising Shift Toward Sustainable and Ethical Seafood Alternatives
Consumers seek seafood options that avoid overfishing, mercury exposure, and environmental harm, which boosts demand for plant-based tuna. Growing awareness of ocean depletion and microplastic contamination strengthens the move toward sustainable protein sources. Brands respond with clean-label, ocean-safe products that appeal to environmentally conscious buyers. This shift draws interest from flexitarians who reduce seafood intake but still want familiar flavors and textures. The trend supports rapid market expansion across retail, online platforms, and foodservice menus.
- For instance, Ocean Hugger Foods developed its tomato-based “Ahimi” tuna using five natural ingredients and confirmed zero microplastic presence through internal product testing, which removes contamination risk linked to raw tuna supply chains.
Advancements in Texture, Flavor, and Nutritional Engineering
Improved extrusion, fermentation, and flavor-enhancement technologies help manufacturers replicate tuna’s flaky structure and savory profile more accurately. These innovations increase consumer satisfaction and support repeat purchases in mainstream retail. Enhanced nutrient fortification, including omega-3 alternatives from algae, further boosts product appeal. Brands also develop versatile formats such as chunks, flakes, and fillets to match wide culinary uses. Continued R&D investment strengthens product realism and accelerates adoption across multiple regions.
- For instance, New Wave Foods uses algal oil with standardized DHA content to resemble the long-chain omega profile of seafood and improve nutritional parity.
Growing Retail and Foodservice Penetration
Major supermarkets expand plant-based seafood aisles, improving visibility and accessibility for plant-based tuna products. Foodservice operators introduce tuna-free sushi, wraps, and salads to meet rising sustainability expectations, which drives trial among non-vegan consumers. Stronger distribution networks and better cold-chain systems support consistent supply. Promotional campaigns and sampling programs also accelerate brand recognition. As retail partnerships widen and restaurant menus diversify, market reach grows across both mature and emerging regions.
Key Trends & Opportunities
Expansion of Clean-Label and Allergen-Friendly Formulations
Consumers prefer plant-based tuna products made from simple, transparent ingredients with minimal additives. Demand rises for allergen-friendly alternatives using pea, fava bean, or chickpea proteins instead of soy or wheat. Brands explore natural flavoring systems and algae-based nutritional enhancers to meet health-conscious preferences. This trend creates opportunities for premium offerings and supports higher price points. Clean-label innovation strengthens trust and positions plant-based tuna as a healthier seafood replacement.
- For instance, Nestlé’s Sensational Vuna has a limited ingredient list and provides significant protein per serving, using pea protein to offer a fish alternative verified through Nestlé product specification data.
Innovation in Global and Culinary Applications
Brands develop region-inspired flavors and formats suitable for sushi, poke bowls, Mediterranean dishes, and fusion meals. These innovations expand culinary versatility and attract younger consumers seeking novel seafood experiences. Restaurants experiment with plant-based tuna across wraps, salads, and appetizers, increasing exposure in foodservice. Product diversification through flavored chunks, spiced flakes, and marinated fillets creates new revenue streams. The trend enhances brand differentiation and strengthens market competitiveness.
- For instance, Current Foods' plant-based tuna in sushi-grade form contains a notable amount of protein per portion, although significantly less than conventional tuna, and is used in a range of foodservice locations, including specific sushi bars and poke outlets.
Key Challenges
High Production Costs and Ingredient Price Variability
Plant-based tuna requires specialized proteins, algae oils, and processing technologies that raise manufacturing costs. Ingredient price fluctuations, especially for pea protein and algae extracts, affect pricing stability. Smaller producers struggle to reach competitive pricing due to limited scale. These cost pressures reduce affordability in certain regions and slow adoption against lower-priced canned tuna. Improving supply chains and scaling production remain essential to reduce long-term cost barriers.
Sensory and Consumer Perception Limitations
Despite improvements, some consumers still find plant-based tuna different from traditional tuna in taste, aroma, and moisture retention. Achieving authentic flakiness and sea-like flavor remains a key technical challenge. Skepticism around processed plant foods also affects acceptance among health-focused buyers. Meat and seafood eaters compare these products directly with real tuna, raising expectations for sensory accuracy. Overcoming these perception gaps is vital for broader market penetration and repeat purchase behavior.
Regional Analysis
North America
North America leads the Plant-Based Tuna market with 38% share, driven by strong demand for sustainable seafood alternatives and high adoption among flexitarian consumers. Supermarkets and online retailers expand shelf space, making tuna-free products widely accessible. Foodservice chains add plant-based tuna to sushi rolls, salads, and wraps, increasing exposure among mainstream diners. Strong innovation from U.S.-based startups accelerates product realism through improved texture and algae-based flavoring. Rising concerns about mercury and overfishing further strengthen regional growth as consumers seek safer and environmentally responsible options.
Europe
Europe holds 33% share, supported by advanced sustainability regulations, strong vegan population growth, and rising preference for clean-label seafood alternatives. Countries such as the United Kingdom, Germany, and the Netherlands show high adoption due to well-developed plant-based ecosystems and strong retailer commitments to ocean-friendly products. Foodservice operators integrate plant-based tuna into poke bowls, sandwiches, and ready meals, boosting trial among flexitarians. Continuous focus on carbon reduction and ethical sourcing strengthens regional demand. Investments in algae-derived omega-3 formulations further enhance nutritional positioning across European markets.
Asia Pacific
Asia Pacific accounts for 20% share, driven by a rising shift toward sustainable seafood replacements and growing health-conscious consumer behavior. Major markets like Japan, China, and Australia adopt plant-based tuna in sushi, rice bowls, and convenience meals. Rapid urbanization and expanding middle-class awareness support interest in low-mercury seafood alternatives. Local manufacturers introduce region-specific flavors and formats tailored to Asian cuisine. Online platforms play a major role in product distribution, helping brands reach young and tech-savvy consumers. Increased focus on marine conservation also fuels demand across coastal markets.
Latin America
Latin America captures 6% share, supported by growing environmental awareness and rising interest in plant-based diets among urban consumers. Brazil, Mexico, and Chile show increasing retail presence of plant-based seafood products, including tuna chunks and spreads. Younger buyers experiment with sustainable protein alternatives, driving steady demand. Foodservice expansion in cafés and fast-casual chains further boosts visibility. Limited local production and higher price sensitivity remain barriers, but awareness campaigns and expanding e-commerce channels help widen market reach across the region.
Middle East & Africa
The Middle East & Africa region holds 3% share, characterized by gradual adoption driven by premium retail formats and rising interest in sustainable protein options. The UAE and Saudi Arabia lead demand due to strong expatriate influence and wider availability of plant-based seafood products. Health-conscious consumers explore low-mercury, clean-label tuna alternatives, while foodservice outlets introduce plant-based sushi and wraps. Higher import dependency and pricing challenges slow mass-market penetration. However, ongoing expansion of vegan product lines and growth in online grocery platforms support incremental market growth.
Market Segmentations:
By Source
- Soy-based
- Pea-based
- Wheat-based
- Other Plant Proteins
By Product Type
- Fillets
- Chunks
- Flakes
- Spreads & Patties
By Distribution Channel
- Supermarkets/Hypermarkets
- Specialty Stores
- Online Retail
- Foodservice
By Application
- Retail
- HoReCa (Hotels, Restaurants, Cafés)
- Ready-to-Eat Meals
- Household Cooking
By Geography
- North America
- U.S.
- Canada
- Mexico
- Europe
- Germany
- France
- U.K.
- Italy
- Spain
- Rest of Europe
- Asia Pacific
- China
- Japan
- India
- South Korea
- South-east Asia
- Rest of Asia Pacific
- Latin America
- Brazil
- Argentina
- Rest of Latin America
- Middle East & Africa
- GCC Countries
- South Africa
- Rest of the Middle East and Africa
Competitive Landscape
The competitive landscape features key players such as Good Catch Foods, Ocean Hugger Foods, Sophie’s Kitchen, TUNO, New Wave Foods, Loma Linda, Akua, Wild Type, Kuleana, and Sushi Mushi. These companies focus on replicating the taste, texture, and nutritional profile of traditional tuna through advanced processing technologies, algae-based flavor systems, and improved protein blends. Leading brands expand retail and foodservice presence by offering versatile formats such as chunks, flakes, fillets, and spreads that fit various culinary applications. Partnerships with sushi chains, cafés, and meal kit platforms improve visibility and consumer trial rates. Many players prioritize clean-label formulations and omega-rich ingredients to appeal to health-conscious buyers. Continued investment in R&D, sustainable sourcing, and regional flavor innovation strengthens competition as companies work to differentiate their products in a fast-growing plant-based seafood category.
Key Player Analysis
- Akua
- TUNO
- Sushi Mushi
- Wild Type
- Good Catch Foods
- Kuleana
- Sophie's Kitchen
- New Wave Foods
- Loma Linda
- Ocean Hugger Foods
Recent Developments
- In August 2025, Atlantic Natural Foods (ANF) completed the sale of its assets, including the Loma Linda and TUNO business units, to Century Pacific North America (CPNA) after bankruptcy proceedings. The sale allows for the continuation of the brands' legacy products with supply to over 30 countries.
- In April 2025, TUNO's parent company, Atlantic Natural Foods, filed for Chapter 11 bankruptcy amid challenges in the plant-based seafood sector.
- In 2024, Akua, known for seaweed-based alternatives including tuna explorations, ceased operations after facing logistical hurdles and market declines in plant-based meat.
Report Coverage
The research report offers an in-depth analysis based on Source, Product Type, Distribution Channel, Application and Geography. It details leading market players, providing an overview of their business, product offerings, investments, revenue streams, and key applications. Additionally, the report includes insights into the competitive environment, SWOT analysis, current market trends, as well as the primary drivers and constraints. Furthermore, it discusses various factors that have driven market expansion in recent years. The report also explores market dynamics, regulatory scenarios, and technological advancements that are shaping the industry. It assesses the impact of external factors and global economic changes on market growth. Lastly, it provides strategic recommendations for new entrants and established companies to navigate the complexities of the market.
Future Outlook
- Demand will rise as consumers seek sustainable and mercury-free seafood alternatives.
- Product realism will improve with better algae-based flavor systems and extrusion methods.
- Clean-label and allergen-friendly formulations will gain stronger market preference.
- Foodservice chains will expand plant-based tuna options in sushi, salads, and wraps.
- Regional flavor innovation will support broader adoption and repeat buying.
- Retailers will increase shelf presence for plant-based seafood categories.
- Scaling production will help reduce ingredient costs and improve affordability.
- Partnerships between brands and protein suppliers will accelerate R&D progress.
- Emerging markets will show faster uptake due to rising environmental awareness.
- Sustainability messaging will strengthen brand loyalty and long-term category growth.
Request a Free Sample
Fill in your details and we'll send you a free sample report.
- Sample data tables & charts
- Research methodology
Need a Custom Version of This Report?
Tailor the scope, geography, or segments to your exact requirements.
- Custom geography or segment scope
- Direct access to our analyst team
Frequently Asked Questions
What is the current market size for the Plant-Based Tuna market, and what is its projected size in 2032?
At what Compound Annual Growth Rate is the Plant-Based Tuna market projected to grow between 2025 and 2032?
Which Plant-Based Tuna market segment held the largest share in 2024?
What are the primary factors fueling the growth of the Plant-Based Tuna market?
Who are the leading companies in the Plant-Based Tuna market?
Table of Content
Chapter 1. Report Introduction
- 1.1 Report Description & Purpose
- 1.1.1 Report Title & Market Definition
- 1.1.2 Unique Selling Propositions (USP) & Key Differentiators
- 1.1.3 Value Proposition for Stakeholders
- 1.2 Research Objectives
- 1.2.1 Market Sizing Objectives (Volume & Revenue)
- 1.2.2 Segmentation Objectives
- 1.2.3 Competitive Intelligence Objectives
- 1.2.4 Forecast & Scenario Objectives
- 1.3 Report Scope
- 1.3.1 Plant-Based Tuna Scope – Types & Subtypes Covered
- 1.3.2 Geographic Scope – Regions & Countries Covered
- 1.3.3 Historical Period, Base Year & Forecast Period (2024; forecast to 2032)
- 1.3.4 Inclusions & Exclusions
- 1.4 HS Code & Classification Framework
- 1.5 Currency, Units & Pricing Basis
- 1.6 Target Stakeholders
- 1.7 Limitations & Assumptions
Chapter 2. Executive Summary
- 2.1 Global Plant-Based Tuna Market Snapshot
- 2.1.1 Market Size – Historical (2024) & Forecast (2024-2032) (2024: USD 322.73 million → 2032: USD 1,102.62 million)
- 2.1.2 Volume & Revenue – Global Totals
- 2.1.3 Key Market Highlights – Top Five Facts
- 2.2 Plant-Based Tuna Market Segmentation Snapshot
- 2.2.1 Market Split by Region – 2024 vs. 2032
- 2.3 Competitive Snapshot
- 2.3.1 Top 10 Players by Revenue Share – 2024
- 2.3.2 Top 10 Players by Volume Share – 2024
- 2.3.3 Recent Strategic Developments (18-Month Summary)
- 2.4 Key Investment Highlights & Strategic Conclusions
Chapter 3. Plant-Based Tuna Market Dynamics & Industry Analysis
- 3.1 Market Overview & Context
- 3.1.1 Plant-Based Tuna Market Position in the Broader Automotive Value Chain
- 3.1.2 OEM vs. Replacement Market Dynamics
- 3.1.3 Market Maturity & Development Stage by Region
- 3.2 Plant-Based Tuna Market Drivers
- 3.3 Plant-Based Tuna Market Restraints & Challenges
- 3.4 Plant-Based Tuna Market Opportunities
- 3.5 Porter's Five Forces Analysis
- 3.5.1 Threat of New Entrants
- 3.5.2 Bargaining Power of Suppliers
- 3.5.3 Bargaining Power of Buyers
- 3.5.4 Threat of Substitutes
- 3.5.5 Competitive Rivalry – Intensity Assessment
- 3.6 Plant-Based Tuna Value Chain Analysis
- 3.6.1 Upstream – Raw Material/Input Suppliers
- 3.6.1.1 Raw Material/Input 1
- 3.6.1.2 Raw Material/Input 2
- 3.6.1.3 Raw Material/Input 3
- 3.6.2 Midstream – Production/Manufacturing/Service Delivery
- 3.6.2.1 Production/Process Overview
- 3.6.2.2 Key Facility Locations & Capacity by Manufacturer
- 3.6.3 Downstream – Distribution & End Consumer
- 3.6.3.1 Primary Channel – B2B/OEM
- 3.6.3.2 Secondary Channels – Dealer, Retail, Online, Direct
- 3.6.4 Value Chain Profitability Analysis
- 3.6.1 Upstream – Raw Material/Input Suppliers
- 3.7 PESTEL Analysis
- 3.7.1 Political Factors
- 3.7.2 Economic Factors
- 3.7.3 Social Factors
- 3.7.4 Technological Factors
- 3.7.5 Environmental Factors
- 3.7.6 Legal Factors
- 3.8 Plant-Based Tuna Supply Chain Analysis
- 3.8.1 Raw Material/Input Supply Risk Assessment
- 3.8.2 Manufacturing Concentration Risk (Geographic Exposure)
- 3.8.3 Trade Disruption Impact Analysis
- 3.9 Regulatory & Policy Landscape
Note: The regulatory and policy landscape section covers regulations based on their applicability to the market, Plant-Based Tuna category, geography, and scope of the study. Only regulatory frameworks with a material impact on operations, compliance, trade, sustainability, or market access are analyzed in detail.
Chapter 4. Key Investment Pockets & Opportunity Analysis
- 4.1 Plant-Based Tuna Market Attractiveness Analysis
- 4.1.1 By Region – Investment Attractiveness Matrix (Volume × CAGR)
- 4.2 Absolute Revenue Growth Opportunity
- 4.2.1 By Region – Absolute USD Growth Through 2032
- 4.3 Incremental Volume Opportunity
- 4.3.1 By Region – Incremental Volume Through 2032
- 4.3.2 Segment – Incremental Volume
- 4.4 Emerging Submarket Opportunity Deep Dive (Subject to Applicability)
- 4.5 Emerging Market Opportunity Scorecards
- 4.5.1 United States
- 4.5.2 Europe
- 4.5.3 Asia
- 4.5.4 Middle East & Africa
Note: Emerging Market Opportunity Scorecards will be included based on relevance and strategic importance. Regions listed are indicative and may vary depending on data availability and market dynamics.
Chapter 5. Plant-Based Tuna Import-Export Analysis & Trade Flows
- 5.1 Global Trade Overview
- 5.1.1 Global Export Value by Country (2024)
- 5.1.2 Global Export Volume by Country (2024)
- 5.1.3 Global Import Value by Country (2024)
- 5.1.4 Global Import Volume by Country (2024)
- 5.1.5 Net Trade Balance by Country (2024)
- 5.2 Export Analysis – Segment
- 5.2.1 Type 1 (HS Code)
- 5.2.2 Type 2 (HS Code)
- 5.2.3 Type 3 (HS Code)
- 5.2.4 Type 4 (HS Code)
- 5.2.5 Type 5 (HS Code)
- 5.3 Import Analysis – Segment
- 5.3.1 Type 1 (HS Code)
- 5.3.2 Type 2 (HS Code)
- 5.3.3 Type 3 (HS Code)
- 5.3.4 Type 4 (HS Code)
- 5.3.5 Type 5 (HS Code)
- 5.4 Average Unit Trade Prices
- 5.4.1 Average Export Price – Segment & Country
- 5.4.2 Average Import Price – Segment & Source Country
- 5.4.3 Price Trends (2024)
- 5.5 Key Trade Route Analysis
- 5.5.1 Trade Route 1
- 5.5.2 Trade Route 2
- 5.5.3 Trade Route 3
- 5.5.4 Trade Route 4
- 5.5.5 Trade Route 5
- 5.6 Trade Policy Impact Assessment
- 5.6.1 US Anti-Dumping & Section 301 Tariffs
- 5.6.2 EU Customs Union Impact
- 5.6.3 Major Free Trade Agreements
- 5.6.4 USMCA Rules of Origin
Note: Trade policy analysis will be included only where relevant to the Plant-Based Tuna market.
Chapter 6. Competitive Landscape & Company Benchmarking
- 6.1 Plant-Based Tuna Market Concentration & Structure
- 6.1.1 Herfindahl-Hirschman Index (HHI) – vs. 2024
- 6.1.2 Tier 1, Tier 2 & Tier 3 Market Structure
- 6.1.3 Global, Regional & Local Player Dynamics
- 6.2 Plant-Based Tuna Market Share Analysis – 2024
- 6.2.1 Global Revenue Share by Company
- 6.2.2 Global Volume Share by Company
- 6.2.3 Regional Revenue Share
- 6.2.4 Market Share Evolution ( vs. 2024)
- 6.2.5 OEM Segment Share by Company
- 6.2.6 Replacement Segment Share by Company
- 6.3 Production/Delivery Capacity & Facility Analysis
- 6.3.1 Global Installed Capacity
- 6.3.2 Capacity Utilization Rates
- 6.3.3 Production/Output Volume
- 6.3.4 Facility Locations & Capacity Map
- 6.3.5 Planned Capacity Additions
- 6.4 Plant-Based Tuna Competitive Benchmarking Matrix
- 6.4.1 Revenue, Volume, CAGR & Profitability Comparison
- 6.4.2 Channel Revenue Mix
- 6.4.3 Geographic Revenue Exposure
- 6.4.4 R&D Intensity
- 6.4.5 Sustainability Maturity
- 6.5 Strategic Developments in Plant-Based Tuna (Last 24 Months)
- 6.5.1 Mergers, Acquisitions & Divestments
- 6.5.2 New Plant-Based Tuna Launches
- 6.5.3 Facility Expansions
- 6.5.4 Strategic Alliances, Joint Ventures & Partnerships
- 6.5.5 Distribution Expansion & Market Entry
- 6.5.6 Sustainability & ESG Initiatives
- 6.6 Competitive Strategy Mapping
- 6.6.1 Leader, Challenger, Follower & Niche Classification
- 6.6.2 Pricing Strategy Comparison
- 6.6.3 Channel Strategy Matrix
Note: Strategic developments are included based on their materiality and the availability of reliable information.
Chapter 7. Global Plant-Based Tuna Market – By Distribution Channel
- 7.1 Segment Overview
- 7.1.1 Volume & Revenue Split by Channel (2024 & 2032)
- 7.1.2 Channel Mix Evolution (2024-2032)
Chapter 8. Regional Market Analysis – Global Overview
- 8.1 Global Regional Overview
- 8.1.1 Regional Volume Share
- 8.1.2 Regional Revenue Share
- 8.1.3 Regional Volume by Region
- 8.1.4 Regional Revenue by Region
- 8.1.5 Regional Forecast Through 2032
- 8.2 Cross-Regional Segment Analysis
- 8.2.1 By Distribution Channel
- 8.2.2 By Brand/Price Tier
Chapter 9. North America Plant-Based Tuna Market
- 9.1 United States
- 9.2 Canada
- 9.3 Mexico
Chapter 10. Europe Plant-Based Tuna Market
- 10.1 Germany
- 10.2 France
- 10.3 Italy
- 10.4 United Kingdom
- 10.5 Spain
- 10.6 Poland
- 10.7 Russia
- 10.8 Netherlands
- 10.9 Belgium
- 10.10 Sweden
- 10.11 Denmark
- 10.12 Norway
- 10.13 Rest of Europe
Chapter 11. Asia Pacific Plant-Based Tuna Market
- 11.1 China
- 11.2 India
- 11.3 Japan
- 11.4 South Korea
- 11.5 Thailand
- 11.6 Indonesia
- 11.7 Vietnam
- 11.8 Malaysia
- 11.9 Australia
- 11.10 Rest of Asia Pacific
Chapter 12. Latin America Plant-Based Tuna Market
- 12.1 Brazil
- 12.2 Argentina
- 12.3 Colombia
- 12.4 Chile
- 12.5 Rest of Latin America
Chapter 13. Middle East Plant-Based Tuna Market
- 13.1 Saudi Arabia
- 13.2 United Arab Emirates
- 13.3 Turkey
- 13.4 Israel
- 13.5 Iran
- 13.6 Rest of the Middle East
Chapter 14. Africa Plant-Based Tuna Market
- 14.1 South Africa
- 14.2 Egypt
- 14.3 Nigeria
- 14.4 Morocco
- 14.5 Rest of Africa
Chapter 15. Plant-Based Tuna Company Profiles
- 15.1 [Company 01]
- 15.1.1 Company Overview
- 15.1.2 Key Management Personnel
- 15.1.3 Products & Services Portfolio
- 15.1.4 Financial Performance
- 15.1.5 Key Market Focus & Geographic Presence
- 15.1.6 Recent Developments & Strategic Initiatives
Note: The company profile list is preliminary and may change based on research findings, market developments, data availability, and client requirements.
Chapter 16. Appendices
- Appendix A – List of Abbreviations & Acronyms
- Appendix B – Industry Classification Code Reference – Full Series
- Appendix C – Production & Capacity Data Tables
- Appendix D – End-Use & Demand Base Tables
- Appendix E – Consumption & Replacement Rate Assumptions
- Appendix F – ASP Reference Tables
- Appendix G – Manufacturing & Facility Database
- Appendix H – Import-Export Data Tables
- Appendix I – Regulatory Summary Tables
- Appendix J – Primary Research Participant List (Anonymized)
- Appendix K – Primary Research Questionnaire Framework
- Appendix L – Data Sources & Bibliography
- Appendix M – Market Size Divergence & Source Comparison
Chapter 17. Research Methodology
- 17.1 Research Framework & Philosophy
- 17.2 Secondary Research – Sources, Hierarchy & Data Extraction
- 17.3 Data Modeling – Bottom-Up & Top-Down Market Sizing
- 17.4 Primary Research – Stakeholder Framework, LOI & Sample Sizes
- 17.5 Forecast Methodology – Regression, Scenario & Sensitivity Analysis
- 17.6 Quality Control – Four-Layer Validation Framework
- 17.7 Limitations & Standard Assumptions
- 17.8 Disclaimer
