
Market Overview
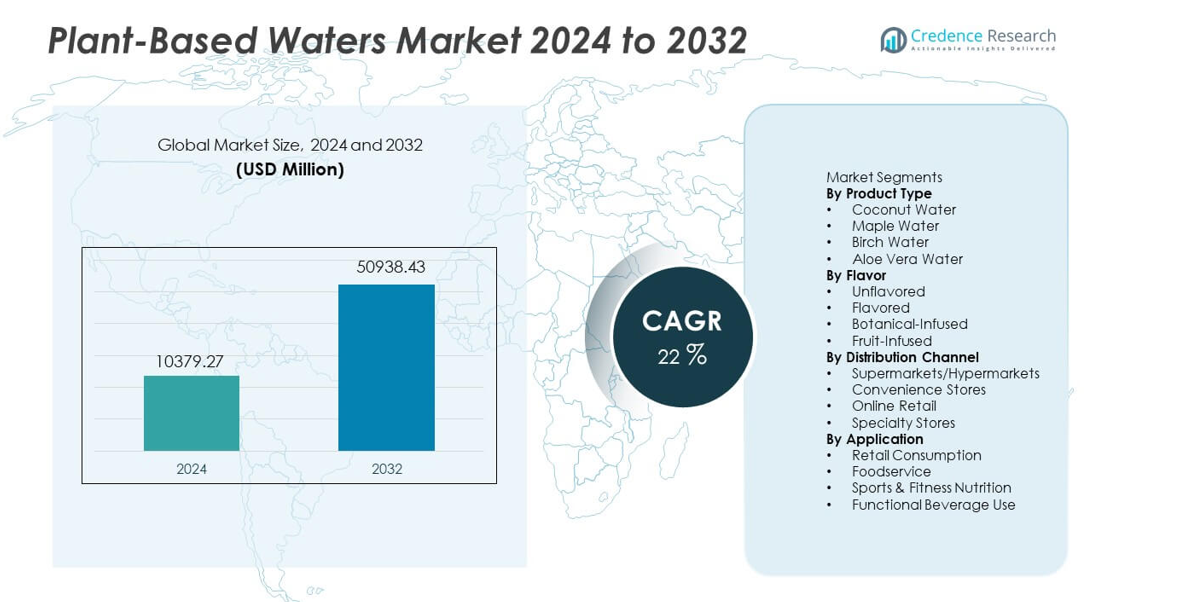
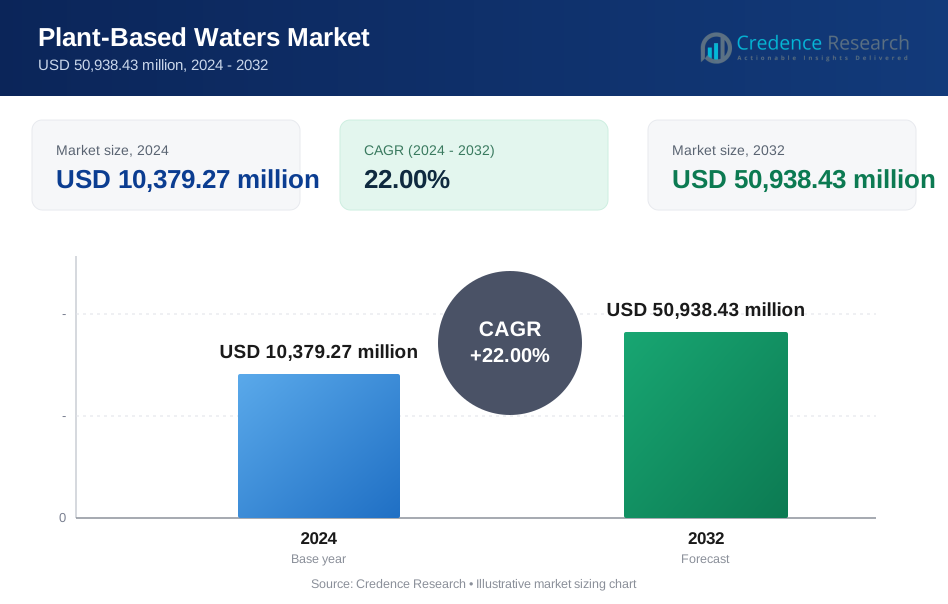
The Plant-Based Waters market was valued at USD 10,379.27 million in 2024 and is projected to reach USD 50,938.43 million by 2032, expanding at a CAGR of 22% over the forecast period.
| REPORT ATTRIBUTE | DETAILS |
|---|---|
| Historical Period | 2020-2023 |
| Base Year | 2024 |
| Forecast Period | 2025-2032 |
| Plant-Based Waters Market Size 2024 | USD 10,379.27 million |
| Plant-Based Waters Market, CAGR | 22% |
| Plant-Based Waters Market Size 2032 | USD 50,938.43 million |
Top players in the Plant-Based Waters market include Vita Coco, Harmless Harvest, PepsiCo, Coca-Cola, Maple 3, Happy Tree, TREO Birch Water, Drink Simple, Aloe Gloe, and Wai Koko, each expanding their reach through clean-label offerings and strong retail partnerships. These companies focus on flavor innovation, sustainable sourcing, and advanced processing methods to meet rising demand for natural hydration. North America leads the market with 37% share, supported by high awareness of plant-based wellness products and strong e-commerce adoption. Europe follows with 28% share, driven by strict clean-label standards and growing interest in functional, low-sugar beverages.
Market Insights
- The Plant-Based Waters market reached USD 10,379.27 million in 2024 and will hit USD 50,938.43 million by 2032, growing at a CAGR of 22.
- Demand grows as clean-label hydration gains traction, with coconut water leading the product segment at 46% share, supported by strong retail visibility and fitness-driven use.
- Innovation remains strong as brands expand botanical and fruit-infused flavors, driven by rising interest in natural wellness and low-sugar beverage options across global markets.
- Competition intensifies as major players strengthen supply chains, improve sustainability practices, and widen digital distribution to retain share in fast-growing premium categories.
- North America leads with 37% share, followed by Europe at 28%, Asia Pacific at 22%, Latin America at 8%, and Middle East & Africa at 5%, reflecting diverse adoption patterns and strengthening regional demand.
Market Segmentation Analysis:
By Product Type
Coconut water leads this segment with 46% share, supported by strong use as a natural hydration drink and wide retail penetration. Brands expand value through clean-label positioning, steady supply chains, and rising preference for low-calorie beverages. Maple water and birch water gain traction due to mineral-rich profiles that appeal to wellness-focused buyers. Aloe vera water shows steady growth as immunity-based claims influence purchase decisions. Product innovation, regional sourcing, and premium packaging boost consumer trust and extend reach across developed and emerging markets.
- For instance, PepsiCo expanded its O.N.E. Coconut Water line through expanded distribution, while Coca-Cola previously owned and then sold ZICO in a separate transaction, with the brand later reacquired by its founder who then relaunched it in North America.
By Flavor
Unflavored plant-based waters dominate this segment with 52% share, driven by demand for clean, additive-free drinks. Consumers favor simple hydration options with minimal processing, which supports strong adoption across fitness and lifestyle categories. Flavored options gain pace as brands introduce tropical blends with natural sweeteners and low-calorie formulations. Botanical-infused variants grow due to rising interest in calming and detox-oriented drinks. Fruit-infused blends remain niche but expand through limited-edition launches that target younger buyers seeking novelty.
- For instance, Vita Coco released several flavored SKUs, which extend beyond just coconut-pineapple and coconut-mango formats, and distributed these products widely through many retail doors in the United States.
By Distribution Channel
Supermarkets and hypermarkets hold the leading 41% share, supported by broad shelf space, private-label rollouts, and strong brand visibility. Retail chains promote plant-based waters through bundled deals and health-focused aisles, which increase impulse purchases. Convenience stores achieve stable growth due to rising demand for ready-to-drink hydration options in urban areas. Online retail expands quickly as buyers seek doorstep delivery, subscription packs, and wider product variety. Specialty stores attract premium shoppers who prefer artisanal or region-specific plant-water brands.
Key Growth Driers
Growing Demand for Natural and Clean-Label Hydration
The market grows as consumers shift toward natural hydration drinks with simple ingredient lists and minimal processing. Plant-based waters gain strong traction due to their electrolyte content, low sugar levels, and clean-label appeal. Fitness users and wellness-focused buyers prefer these beverages over synthetic sports drinks. Brands highlight purity, sustainable sourcing, and traceability to strengthen trust. Wider retail presence and flavor innovation also support higher adoption across both developed and emerging regions.
- For instance, Harmless Harvest sources coconuts from certified organic farms in Thailand and processes water each year using proprietary multi-step micro-filtration technology.
Expansion of Functional and Nutrient-Enhanced Formulations
Functional plant-based waters gain momentum as companies add vitamins, antioxidants, and botanical extracts. These enhanced variants attract health-conscious users seeking daily wellness support. Functional claims such as immunity, detox, and energy enhancement increase market visibility. Brands invest in R&D to refine nutrient stability and flavor balance in low-calorie formats. Growing interest in preventive health and active lifestyles drives demand for fortified beverages across retail and online channels.
- For instance, the ZICO brand, now a part of the PowerPlant Ventures portfolio, offers a variety of coconut water options, including some with added ingredients like vitamin C in certain older or flavored blends, confirmed under FDA nutrition labeling guidelines.
Rising Popularity of Sustainable and Eco-Friendly Beverages
Sustainability drives strong growth as consumers prefer drinks sourced from renewable plant materials with lower environmental impact. Coconut, birch, and maple waters align with this shift due to sustainable harvesting and reduced carbon footprints. Brands adopt recyclable packaging and eco-friendly supply chains to appeal to environmentally aware buyers. Retailers expand shelf space for green-labeled products, strengthening category confidence. This trend supports long-term brand loyalty and pushes companies to enhance transparency and ethical sourcing practices.
Key Trends & Opportunities
Innovation in Flavor Profiles and Botanical Blends
Flavor innovation creates new opportunities as brands introduce botanical and fruit-infused blends that appeal to younger buyers. Herbal ingredients such as mint, hibiscus, and ginger enhance taste and deliver perceived wellness benefits. Limited-edition flavors and region-inspired profiles help brands stand out in crowded beverage aisles. This trend supports premium positioning and allows companies to tap into niche health segments. Expanding flavor diversity drives experimentation and repeat purchases across global markets.
- For instance, TREO Birch Water launched a variety of flavored birch blends and expanded placement to many stores across the United States, including major retailers like Wegmans and Stop & Shop.
Growth of Digital Retail and Subscription-Based Models
Online retail emerges as a major opportunity as consumers seek convenience, broader product access, and personalized bundles. Subscription models encourage repeat purchases by offering curated assortments and discounts. Digital platforms support targeted marketing based on lifestyle data and flavor preferences. Brands use e-commerce to test new formulations and gather fast consumer feedback. Rising mobile shopping adoption and improved logistics further accelerate digital channel growth.
- For instance, Maple 3, a leading company in the Canadian maple water industry, distributes its products through various online and physical retailers, including national e-grocers like Amazon.ca and Avril Supermarché, to meet the growing consumer interest in natural, healthy beverages.
Key Challenges
High Production Costs and Supply Chain Sensitivity
Plant-based waters face cost pressures linked to seasonal crop yields, labor intensity, and complex extraction processes. Coconut and maple water supply chains rely on specific climates, making them vulnerable to weather fluctuations and regional disruptions. Rising transport and packaging costs add further strain. Smaller brands struggle to maintain competitive pricing, which limits mass-market penetration. Efficient sourcing and improved processing technologies are essential to lower long-term production costs.
Limited Consumer Awareness in Emerging Markets
Awareness gaps hinder growth in regions where plant-based hydration drinks remain unfamiliar. Many consumers still rely on traditional beverages, reducing adoption of premium-priced plant-based options. Limited marketing exposure and fewer product demonstrations slow trial intent. Retail availability also remains inconsistent in rural and semi-urban areas. Brands must invest in education campaigns, sampling programs, and localized messaging to build trust and encourage first-time purchases across new markets.
Regional Analysis
North America
North America leads the market with 37% share, driven by strong demand for clean-label hydration products and wide acceptance of coconut and aloe-based waters. The region benefits from high retail visibility, extensive flavor innovation, and strong promotion of low-calorie beverages. Fitness communities and wellness programs support consistent adoption across the United States and Canada. E-commerce platforms expand access to premium plant-based waters, boosting repeat purchases. Major brands invest in sustainable packaging and transparent sourcing, which strengthens consumer trust and drives long-term category growth across mainstream and specialty channels.
Europe
Europe holds 28% share, supported by rising interest in natural hydration, botanical blends, and low-sugar beverages. Consumers in Western Europe favor plant-based options with clear environmental claims and ethical sourcing. Retailers expand product assortments as demand grows for organic and vegan-friendly drinks. Flavor diversity, including birch and maple waters, gains popularity among health-driven buyers. Stringent regulations on artificial additives push brands to refine clean-label formulations. Increased sustainability awareness and growth of functional beverage segments strengthen market expansion across Germany, the UK, France, and Nordic countries.
Asia Pacific
Asia Pacific accounts for 22% share, fueled by growing health awareness, rapid urbanization, and rising acceptance of functional hydration products. Coconut water enjoys strong cultural relevance in Southeast Asia, which supports high consumption levels. Expanding middle-class populations in China and India drive demand for premium, low-sugar beverage options. E-commerce adoption helps brands reach wider audiences with diverse pack formats. Local manufacturers introduce cost-effective plant-water variants, enhancing affordability. Increasing interest in natural wellness trends strengthens long-term growth across emerging markets in the region.
Latin America
Latin America captures 8% share, driven by expanding demand for clean hydration and strong presence of coconut water across Brazil and Mexico. Younger consumers adopt plant-based beverages as healthier alternatives to carbonated drinks. Retailers increase shelf space for flavored and functional variants that align with local taste preferences. Economic shifts influence buying patterns, yet demand for natural and low-calorie drinks remains steady. Strong tropical fruit supply supports innovation in infused plant-water blends. Growing social media influence boosts product discovery across online channels, supporting broader market penetration.
Middle East & Africa
The Middle East & Africa region holds 5% share, supported by rising interest in hydration-focused wellness products in urban centers. Hot climates drive steady demand for refreshing, low-sugar beverages, including coconut and aloe-based waters. Premium imports dominate due to limited local production capacity. Retail chains expand offerings within health-oriented aisles, improving visibility. Higher disposable incomes in Gulf countries boost adoption of premium and flavored variants. However, price sensitivity and limited consumer awareness in parts of Africa slow widespread growth, creating room for targeted education and sampling initiatives.
Market Segmentations:
By Product Type
- Coconut Water
- Maple Water
- Birch Water
- Aloe Vera Water
By Flavor
- Unflavored
- Flavored
- Botanical-Infused
- Fruit-Infused
By Distribution Channel
- Supermarkets/Hypermarkets
- Convenience Stores
- Online Retail
- Specialty Stores
By Application
- Retail Consumption
- Foodservice
- Sports & Fitness Nutrition
- Functional Beverage Use
By Geography
- North America
- U.S.
- Canada
- Mexico
- Europe
- Germany
- France
- U.K.
- Italy
- Spain
- Rest of Europe
- Asia Pacific
- China
- Japan
- India
- South Korea
- South-east Asia
- Rest of Asia Pacific
- Latin America
- Brazil
- Argentina
- Rest of Latin America
- Middle East & Africa
- GCC Countries
- South Africa
- Rest of the Middle East and Africa
Competitive Landscape
The competitive landscape features leading companies such as Vita Coco, Harmless Harvest, PepsiCo, Coca-Cola, Maple 3, Happy Tree, TREO Birch Water, Drink Simple, Aloe Gloe, and Wai Koko, all working to strengthen their presence through product innovation and wider distribution. Market leaders focus on clean-label formulations, advanced flavor development, and sustainable sourcing to appeal to health-driven consumers. Companies invest in new extraction methods that maintain nutrient integrity while improving shelf stability. Retail partnerships expand visibility across supermarkets, convenience chains, and online platforms. Many brands adopt recyclable packaging and transparent supply chains to enhance credibility. Premium players emphasize functional claims, while emerging brands target niche segments with botanical-infused and limited-edition blends. Rising competition encourages continuous branding efforts, regional diversification, and stronger digital engagement strategies.
Key Player Analysis
- Vita Coco
- Harmless Harvest
- PepsiCo (O.N.E. Coconut Water)
- Coca-Cola (ZICO)
- Maple 3
- Happy Tree Maple Water
- TREO Birch Water
- Drink Simple
- Aloe Gloe
- Wai Koko
Recent Developments
- In June 2023, Vita Coco partnered with Bluestone Lane to create a Coconut Water Cold Brew drink using Vita Coco coconut water.
- In January 2023, Vita Coco launched a “Barista MLK” coconut-based milk (plant-milk) variety in collaboration with Alfred Coffee
Report Coverage
The research report offers an in-depth analysis based on Product Type, Flavor, Distribution Channel, Application and Geography. It details leading market players, providing an overview of their business, product offerings, investments, revenue streams, and key applications. Additionally, the report includes insights into the competitive environment, SWOT analysis, current market trends, as well as the primary drivers and constraints. Furthermore, it discusses various factors that have driven market expansion in recent years. The report also explores market dynamics, regulatory scenarios, and technological advancements that are shaping the industry. It assesses the impact of external factors and global economic changes on market growth. Lastly, it provides strategic recommendations for new entrants and established companies to navigate the complexities of the market.
Future Outlook
- Demand for clean-label hydration will rise as consumers shift toward natural wellness products.
- Brands will expand functional formulations that include vitamins, minerals, and botanical extracts.
- Flavor innovation will increase as companies introduce regional and seasonal blends.
- Sustainable packaging will gain priority as buyers favor eco-friendly and recyclable materials.
- Digital retail growth will strengthen due to higher subscription use and targeted marketing.
- Emerging markets will see faster adoption as awareness of plant-based hydration improves.
- Supply chain optimization will become key as brands work to reduce production costs.
- Partnerships with fitness and lifestyle platforms will expand consumer reach.
- Premium and specialty plant-water variants will grow as health-focused buyers seek higher quality.
- Investment in R&D will rise to enhance nutrient stability, shelf life, and processing efficiency.
Request a Free Sample
Fill in your details and we'll send you a free sample report.
- Sample data tables & charts
- Research methodology
Need a Custom Version of This Report?
Tailor the scope, geography, or segments to your exact requirements.
- Custom geography or segment scope
- Direct access to our analyst team
Frequently Asked Questions
What is the current market size for Plant-Based Waters market, and what is its projected size in 2032?
At what Compound Annual Growth Rate is the Plant-Based Waters market projected to grow between 2025 and 2032?
Which Plant-Based Waters market segment held the largest share in 2024?
What are the primary factors fueling the growth of the Plant-Based Waters market?
Who are the leading companies in the Plant-Based Waters market?
Table of Content
Chapter 1. Report Introduction
- 1.1 Report Description & Purpose
- 1.1.1 Report Title & Market Definition
- 1.1.2 Unique Selling Propositions (USP) & Key Differentiators
- 1.1.3 Value Proposition for Stakeholders
- 1.2 Research Objectives
- 1.2.1 Market Sizing Objectives (Volume & Revenue)
- 1.2.2 Segmentation Objectives
- 1.2.3 Competitive Intelligence Objectives
- 1.2.4 Forecast & Scenario Objectives
- 1.3 Report Scope
- 1.3.1 Plant-Based Waters Scope – Types & Subtypes Covered
- 1.3.2 Geographic Scope – Regions & Countries Covered
- 1.3.3 Historical Period, Base Year & Forecast Period (2024; forecast to 2032)
- 1.3.4 Inclusions & Exclusions
- 1.4 HS Code & Classification Framework
- 1.5 Currency, Units & Pricing Basis
- 1.6 Target Stakeholders
- 1.7 Limitations & Assumptions
Chapter 2. Executive Summary
- 2.1 Global Plant-Based Waters Market Snapshot
- 2.1.1 Market Size – Historical (2024) & Forecast (2024-2032) (2024: USD 10,379.27 million → 2032: USD 50,938.43 million)
- 2.1.2 Volume & Revenue – Global Totals
- 2.1.3 Key Market Highlights – Top Five Facts
- 2.2 Plant-Based Waters Market Segmentation Snapshot
- 2.2.1 Market Split by Region – 2024 vs. 2032
- 2.3 Competitive Snapshot
- 2.3.1 Top 10 Players by Revenue Share – 2024
- 2.3.2 Top 10 Players by Volume Share – 2024
- 2.3.3 Recent Strategic Developments (18-Month Summary)
- 2.4 Key Investment Highlights & Strategic Conclusions
Chapter 3. Plant-Based Waters Market Dynamics & Industry Analysis
- 3.1 Market Overview & Context
- 3.1.1 Plant-Based Waters Market Position in the Broader Automotive Value Chain
- 3.1.2 OEM vs. Replacement Market Dynamics
- 3.1.3 Market Maturity & Development Stage by Region
- 3.2 Plant-Based Waters Market Drivers
- 3.3 Plant-Based Waters Market Restraints & Challenges
- 3.4 Plant-Based Waters Market Opportunities
- 3.5 Porter's Five Forces Analysis
- 3.5.1 Threat of New Entrants
- 3.5.2 Bargaining Power of Suppliers
- 3.5.3 Bargaining Power of Buyers
- 3.5.4 Threat of Substitutes
- 3.5.5 Competitive Rivalry – Intensity Assessment
- 3.6 Plant-Based Waters Value Chain Analysis
- 3.6.1 Upstream – Raw Material/Input Suppliers
- 3.6.1.1 Raw Material/Input 1
- 3.6.1.2 Raw Material/Input 2
- 3.6.1.3 Raw Material/Input 3
- 3.6.2 Midstream – Production/Manufacturing/Service Delivery
- 3.6.2.1 Production/Process Overview
- 3.6.2.2 Key Facility Locations & Capacity by Manufacturer
- 3.6.3 Downstream – Distribution & End Consumer
- 3.6.3.1 Primary Channel – B2B/OEM
- 3.6.3.2 Secondary Channels – Dealer, Retail, Online, Direct
- 3.6.4 Value Chain Profitability Analysis
- 3.6.1 Upstream – Raw Material/Input Suppliers
- 3.7 PESTEL Analysis
- 3.7.1 Political Factors
- 3.7.2 Economic Factors
- 3.7.3 Social Factors
- 3.7.4 Technological Factors
- 3.7.5 Environmental Factors
- 3.7.6 Legal Factors
- 3.8 Plant-Based Waters Supply Chain Analysis
- 3.8.1 Raw Material/Input Supply Risk Assessment
- 3.8.2 Manufacturing Concentration Risk (Geographic Exposure)
- 3.8.3 Trade Disruption Impact Analysis
- 3.9 Regulatory & Policy Landscape
Note: The regulatory and policy landscape section covers regulations based on their applicability to the market, Plant-Based Waters category, geography, and scope of the study. Only regulatory frameworks with a material impact on operations, compliance, trade, sustainability, or market access are analyzed in detail.
Chapter 4. Key Investment Pockets & Opportunity Analysis
- 4.1 Plant-Based Waters Market Attractiveness Analysis
- 4.1.1 By Region – Investment Attractiveness Matrix (Volume × CAGR)
- 4.2 Absolute Revenue Growth Opportunity
- 4.2.1 By Region – Absolute USD Growth Through 2032
- 4.3 Incremental Volume Opportunity
- 4.3.1 By Region – Incremental Volume Through 2032
- 4.3.2 Segment – Incremental Volume
- 4.4 Emerging Submarket Opportunity Deep Dive (Subject to Applicability)
- 4.5 Emerging Market Opportunity Scorecards
- 4.5.1 United States
- 4.5.2 Europe
- 4.5.3 Asia
- 4.5.4 Middle East & Africa
Note: Emerging Market Opportunity Scorecards will be included based on relevance and strategic importance. Regions listed are indicative and may vary depending on data availability and market dynamics.
Chapter 5. Plant-Based Waters Import-Export Analysis & Trade Flows
- 5.1 Global Trade Overview
- 5.1.1 Global Export Value by Country (2024)
- 5.1.2 Global Export Volume by Country (2024)
- 5.1.3 Global Import Value by Country (2024)
- 5.1.4 Global Import Volume by Country (2024)
- 5.1.5 Net Trade Balance by Country (2024)
- 5.2 Export Analysis – Segment
- 5.2.1 Type 1 (HS Code)
- 5.2.2 Type 2 (HS Code)
- 5.2.3 Type 3 (HS Code)
- 5.2.4 Type 4 (HS Code)
- 5.2.5 Type 5 (HS Code)
- 5.3 Import Analysis – Segment
- 5.3.1 Type 1 (HS Code)
- 5.3.2 Type 2 (HS Code)
- 5.3.3 Type 3 (HS Code)
- 5.3.4 Type 4 (HS Code)
- 5.3.5 Type 5 (HS Code)
- 5.4 Average Unit Trade Prices
- 5.4.1 Average Export Price – Segment & Country
- 5.4.2 Average Import Price – Segment & Source Country
- 5.4.3 Price Trends (2024)
- 5.5 Key Trade Route Analysis
- 5.5.1 Trade Route 1
- 5.5.2 Trade Route 2
- 5.5.3 Trade Route 3
- 5.5.4 Trade Route 4
- 5.5.5 Trade Route 5
- 5.6 Trade Policy Impact Assessment
- 5.6.1 US Anti-Dumping & Section 301 Tariffs
- 5.6.2 EU Customs Union Impact
- 5.6.3 Major Free Trade Agreements
- 5.6.4 USMCA Rules of Origin
Note: Trade policy analysis will be included only where relevant to the Plant-Based Waters market.
Chapter 6. Competitive Landscape & Company Benchmarking
- 6.1 Plant-Based Waters Market Concentration & Structure
- 6.1.1 Herfindahl-Hirschman Index (HHI) – vs. 2024
- 6.1.2 Tier 1, Tier 2 & Tier 3 Market Structure
- 6.1.3 Global, Regional & Local Player Dynamics
- 6.2 Plant-Based Waters Market Share Analysis – 2024
- 6.2.1 Global Revenue Share by Company
- 6.2.2 Global Volume Share by Company
- 6.2.3 Regional Revenue Share
- 6.2.4 Market Share Evolution ( vs. 2024)
- 6.2.5 OEM Segment Share by Company
- 6.2.6 Replacement Segment Share by Company
- 6.3 Production/Delivery Capacity & Facility Analysis
- 6.3.1 Global Installed Capacity
- 6.3.2 Capacity Utilization Rates
- 6.3.3 Production/Output Volume
- 6.3.4 Facility Locations & Capacity Map
- 6.3.5 Planned Capacity Additions
- 6.4 Plant-Based Waters Competitive Benchmarking Matrix
- 6.4.1 Revenue, Volume, CAGR & Profitability Comparison
- 6.4.2 Channel Revenue Mix
- 6.4.3 Geographic Revenue Exposure
- 6.4.4 R&D Intensity
- 6.4.5 Sustainability Maturity
- 6.5 Strategic Developments in Plant-Based Waters (Last 24 Months)
- 6.5.1 Mergers, Acquisitions & Divestments
- 6.5.2 New Plant-Based Waters Launches
- 6.5.3 Facility Expansions
- 6.5.4 Strategic Alliances, Joint Ventures & Partnerships
- 6.5.5 Distribution Expansion & Market Entry
- 6.5.6 Sustainability & ESG Initiatives
- 6.6 Competitive Strategy Mapping
- 6.6.1 Leader, Challenger, Follower & Niche Classification
- 6.6.2 Pricing Strategy Comparison
- 6.6.3 Channel Strategy Matrix
Note: Strategic developments are included based on their materiality and the availability of reliable information.
Chapter 7. Global Plant-Based Waters Market – By Distribution Channel
- 7.1 Segment Overview
- 7.1.1 Volume & Revenue Split by Channel (2024 & 2032)
- 7.1.2 Channel Mix Evolution (2024-2032)
Chapter 8. Regional Market Analysis – Global Overview
- 8.1 Global Regional Overview
- 8.1.1 Regional Volume Share
- 8.1.2 Regional Revenue Share
- 8.1.3 Regional Volume by Region
- 8.1.4 Regional Revenue by Region
- 8.1.5 Regional Forecast Through 2032
- 8.2 Cross-Regional Segment Analysis
- 8.2.1 By Distribution Channel
- 8.2.2 By Brand/Price Tier
Chapter 9. North America Plant-Based Waters Market
- 9.1 United States
- 9.2 Canada
- 9.3 Mexico
Chapter 10. Europe Plant-Based Waters Market
- 10.1 Germany
- 10.2 France
- 10.3 Italy
- 10.4 United Kingdom
- 10.5 Spain
- 10.6 Poland
- 10.7 Russia
- 10.8 Netherlands
- 10.9 Belgium
- 10.10 Sweden
- 10.11 Denmark
- 10.12 Norway
- 10.13 Rest of Europe
Chapter 11. Asia Pacific Plant-Based Waters Market
- 11.1 China
- 11.2 India
- 11.3 Japan
- 11.4 South Korea
- 11.5 Thailand
- 11.6 Indonesia
- 11.7 Vietnam
- 11.8 Malaysia
- 11.9 Australia
- 11.10 Rest of Asia Pacific
Chapter 12. Latin America Plant-Based Waters Market
- 12.1 Brazil
- 12.2 Argentina
- 12.3 Colombia
- 12.4 Chile
- 12.5 Rest of Latin America
Chapter 13. Middle East Plant-Based Waters Market
- 13.1 Saudi Arabia
- 13.2 United Arab Emirates
- 13.3 Turkey
- 13.4 Israel
- 13.5 Iran
- 13.6 Rest of the Middle East
Chapter 14. Africa Plant-Based Waters Market
- 14.1 South Africa
- 14.2 Egypt
- 14.3 Nigeria
- 14.4 Morocco
- 14.5 Rest of Africa
Chapter 15. Plant-Based Waters Company Profiles
- 15.1 [Company 01]
- 15.1.1 Company Overview
- 15.1.2 Key Management Personnel
- 15.1.3 Products & Services Portfolio
- 15.1.4 Financial Performance
- 15.1.5 Key Market Focus & Geographic Presence
- 15.1.6 Recent Developments & Strategic Initiatives
Note: The company profile list is preliminary and may change based on research findings, market developments, data availability, and client requirements.
Chapter 16. Appendices
- Appendix A – List of Abbreviations & Acronyms
- Appendix B – Industry Classification Code Reference – Full Series
- Appendix C – Production & Capacity Data Tables
- Appendix D – End-Use & Demand Base Tables
- Appendix E – Consumption & Replacement Rate Assumptions
- Appendix F – ASP Reference Tables
- Appendix G – Manufacturing & Facility Database
- Appendix H – Import-Export Data Tables
- Appendix I – Regulatory Summary Tables
- Appendix J – Primary Research Participant List (Anonymized)
- Appendix K – Primary Research Questionnaire Framework
- Appendix L – Data Sources & Bibliography
- Appendix M – Market Size Divergence & Source Comparison
Chapter 17. Research Methodology
- 17.1 Research Framework & Philosophy
- 17.2 Secondary Research – Sources, Hierarchy & Data Extraction
- 17.3 Data Modeling – Bottom-Up & Top-Down Market Sizing
- 17.4 Primary Research – Stakeholder Framework, LOI & Sample Sizes
- 17.5 Forecast Methodology – Regression, Scenario & Sensitivity Analysis
- 17.6 Quality Control – Four-Layer Validation Framework
- 17.7 Limitations & Standard Assumptions
- 17.8 Disclaimer
