
Market Overview
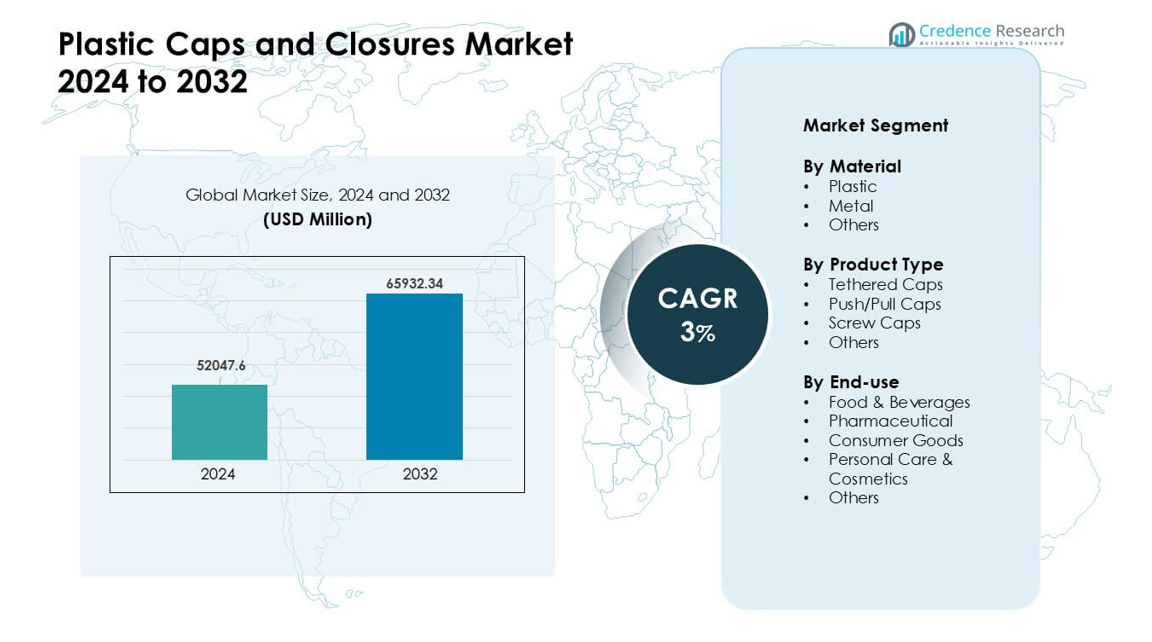
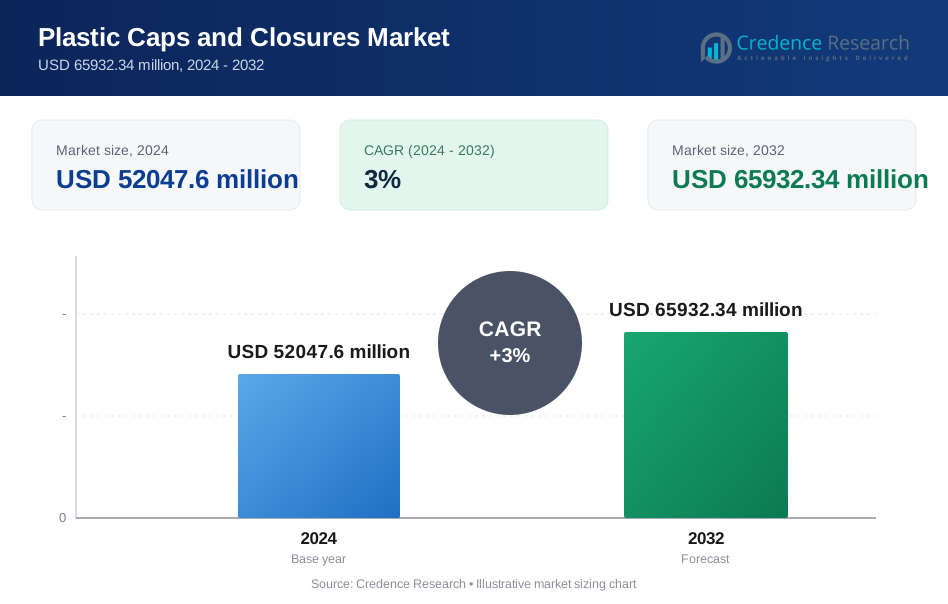
Plastic Caps and Closures Market was valued at USD 52047.6 million in 2024 and is anticipated to reach USD 65932.34 million by 2032, growing at a CAGR of 3 % during the forecast period.
| REPORT ATTRIBUTE | DETAILS |
|---|---|
| Historical Period | 2020-2023 |
| Base Year | 2024 |
| Forecast Period | 2025-2032 |
| Plastic Caps and Closures Market Size 2024 | USD 52047.6 million |
| Plastic Caps and Closures Market, CAGR | 3% |
| Plastic Caps and Closures Market Size 2032 | USD 65932.34 million |
The Plastic Caps and Closures Market is shaped by major players such as Aptar Group, Silgan Holdings, Amcor, Guala Closures, BERICAP, UNITED CAPS, Nippon Closures, Mold-Rite Plastics, Closure Systems International, and O.Berk. These companies compete through advanced molding technology, lightweight designs, and rising use of recyclable materials. Many producers also focus on tamper-evident and dispensing solutions to meet safety and convenience needs across beverage, food, and pharmaceutical sectors. Asia Pacific led the global market in 2024 with about 39% share, supported by strong FMCG demand, large-scale bottle production, and rapid expansion of local packaging manufacturers.
Market Insights
- The Plastic Caps and Closures Market reached USD 52047.6 million in 2024 and is projected to hit USD 65932.34 million by 2032, growing at a CAGR of 3%. • Demand rises due to strong use in beverages, food, personal care, and pharma, with screw caps holding the largest share because of wide compatibility and low cost. • Lightweight designs, tethered caps, and higher recycled content shape major trends as brands shift toward sustainable packaging solutions. • Competition stays intense among Aptar Group, Silgan, Amcor, Guala Closures, BERICAP, UNITED CAPS, and Nippon Closures, with focus on faster molding lines and tamper-evident formats. • Asia Pacific leads with about 39% share, followed by North America at nearly 32% and Europe at about 27%, while the beverage segment remains dominant across all regions due to rising PET bottle consumption.
Market Segmentation Analysis:
By Material
Plastic held the dominant share in 2024 with about 82% of the Plastic Caps and Closures Market. Brands favored plastic due to low cost, light weight, and strong sealing strength. Beverage and packaged food companies also used plastic because the material supports fast production and tight-fit closures. Metal and other materials saw niche use in premium goods and products needing higher barrier protection. Rising demand for recyclable and lightweight packaging continued to push plastic ahead in mass-market applications across global supply chains.
- For instance, Berry Global, a major packaging manufacturer, is known for its sustainability efforts and focus on "lightweighting" reducing the amount of plastic used in products to lessen environmental impact and transport weight. This general practice is a standard industry trend.
By Product Type
Screw caps led this segment in 2024 with nearly 61% share. These closures stayed ahead because they offer secure sealing, easy use, and wide compatibility across bottles in food, drinks, personal care, and household goods. Brands preferred screw caps due to strong leak prevention and cost-effective production. Tethered and push/pull caps grew with higher demand for convenience and regulatory support for attached-cap designs. New shapes and tamper-evident features also helped expand product choices for high-volume users.
- For instance, according to a 2024 analysis from Mordor Intelligence, screw closures accounted for 65.56% of the global plastic caps and closures market by product type that year underscoring their dominance in high-speed bottling lines.
By End-use
Food and beverages dominated end-use in 2024 with about 46% share. Companies in this sector relied on secure, hygienic closures to protect liquids, sauces, dairy, and ready-to-drink products. Rising use of PET and HDPE bottles pushed demand for reliable plastic caps with easy-open and reclosable designs. Pharmaceuticals and personal care adopted closures with higher safety and dosing features, while consumer goods used them for broad packaging needs. Growth in packaged drinks and rising hygiene awareness kept food and beverages in the leading position.
Key Growth Drivers
Expansion of Packaged Food and Beverage Demand
Rising consumption of packaged food and beverage products remains a major growth driver for the Plastic Caps and Closures Market. Brands need secure, leak-proof closures for water, soft drinks, juices, sauces, and dairy items. The surge in ready-to-drink products also boosts demand for lightweight plastic caps that support fast filling lines. Growing urban populations and higher reliance on convenience food push manufacturers to adopt durable sealing systems that preserve freshness during transport. PET bottle consumption continues to climb worldwide, which reinforces the need for cost-efficient plastic closures. Strong hygiene demand after global health events has further encouraged companies to upgrade closure quality across all mass-market categories.
- For instance, a 2024 industry report highlighted that the beverage segment covering bottled water, juices and non-carbonated drinks remains the largest end-use for plastic closures, underscoring how bottled beverages drive closure demand globally.
Shift Toward Lightweight and Cost-Efficient Packaging
Manufacturers focus heavily on lightweight packaging to cut material use, lower transport costs, and reduce environmental load. Plastic caps support this shift because they offer strength with lower resin use compared with metal closures. Brands also adopt lightweight closures to improve sustainability scores and meet regulatory expectations for reduced packaging waste. Advanced molding technologies now produce thinner but stronger caps that maintain safety standards. High-volume FMCG companies select lightweight closures to manage operating costs without compromising product safety. This shift drives steady market expansion as producers seek flexible and energy-efficient packaging solutions that help protect margins.
- For instance, some plastic caps are now manufactured using advanced compression-molding techniques that achieve a fastest cycle time of 1.44 seconds per cap — enabling extremely high throughput while maintaining precise dimensional tolerances and seal integrity.
Rising Adoption of Convenience and Safety Features
Demand grows for caps that improve user convenience and safety, including tamper-evident bands, child-resistant designs, and reclosable formats. Food, beverage, and personal care sectors rely on such features to boost consumer trust and enhance brand value. Regulations requiring improved safety in pharmaceuticals and household chemicals also push manufacturers toward advanced closure formats. Easy-open caps support consumers with mobility limitations and increase satisfaction in mass-market applications. Growth in e-commerce adds pressure for stronger sealing systems that endure transit stress. These combined needs accelerate the shift toward specialized closure designs that offer added functionality and protect product integrity.
Key Trends & Opportunities
Expansion of Tethered and Sustainable Closure Designs
Tethered caps are gaining rapid adoption as global regulations encourage attached-cap formats to reduce litter. This trend opens a strong opportunity for manufacturers to redesign closures with improved hinge durability, flexible materials, and user-friendly opening systems. Many beverage brands already shift to tethered solutions to meet sustainability goals and strengthen packaging circularity. Recycled resin use in closures is rising, driven by corporate commitments and consumer demand for eco-friendly packaging. Innovation in bio-based polymers also expands material options. These factors position sustainable closure technologies as a major opportunity for long-term market expansion.
- For instance, under the EU Single‑Use Plastics Directive which came into force in July 2024, all plastic beverage bottles up to three liters must have caps that remain attached to the container pushing companies across Europe to convert existing screw-cap product lines into tethered-cap formats.
Growth of Premium and Specialized Closure Applications
Premium personal care, cosmetics, and wellness products create demand for high-quality closures with unique finishes, soft-touch textures, and precise dispensing. This trend offers strong opportunities for brands to differentiate through aesthetics and performance. Growth in health drinks, nutraceuticals, and specialty beverages also boosts interest in closures that improve dose control or enhance product freshness. Smart caps with freshness indicators, digital authentication, or micro-dispensing functions emerge as niche opportunities. As consumer preferences shift toward premium experiences and safety-assured packaging, companies expand R&D investment to develop next-generation closure solutions.
- For instance, a growing body of research explores "chemically-recyclable" polymers for food and beverage packaging for example, a recent polymer-informatics project identified a polymer whose monomer can be recovered at 95% yield after use, pointing to future possibilities for fully circular, high-performance closures.
Key Challenges
Rising Regulatory Pressure on Plastic Waste
Regulations targeting single-use plastics create significant challenges for closure manufacturers. Several regions enforce restrictions, recyclability standards, or mandates for attached caps. Producers must redesign caps to meet compliance while keeping costs manageable for high-volume industries. Transitioning to recycled or bio-based materials increases complexity because supply availability and mechanical properties vary widely. Brands must also balance sustainability needs with performance requirements such as sealing strength, tamper resistance, and compatibility with filling lines. These pressures raise operational costs and demand ongoing design changes.
Volatility in Resin Prices and Supply Chain Disruptions
Plastic caps rely heavily on polypropylene and polyethylene resins, which face frequent price fluctuations due to shifts in crude oil markets. Sudden spikes increase production costs for manufacturers operating at tight margins. Supply chain disruptions can delay raw material availability and affect output stability, especially for large beverage and FMCG producers. Companies must maintain large inventories or diversify sourcing, which adds financial pressure. These cost swings also limit long-term pricing commitments, making planning difficult for both suppliers and end-use industries.
Regional Analysis
North America
North America held about 32% share in the Plastic Caps and Closures Market in 2024. Strong demand came from beverage, household care, and pharmaceutical brands that adopted lightweight and tamper-evident solutions. The region benefited from high automation, strict quality norms, and steady packaging upgrades across FMCG products. Growth stayed supported by rising bottled water consumption and wider use of child-resistant closures in regulated sectors. Sustainability goals pushed major converters to expand PCR-based caps and mono-material systems. These shifts helped North America maintain a solid position while creating steady momentum for advanced closure formats.
Europe
Europe accounted for nearly 27% share in 2024 due to strict recycling mandates and rapid adoption of tethered caps across beverage packaging. Regional producers invested in high-precision molding lines to support uniformity, safety, and circular-economy compliance. Demand increased in cosmetics, personal care, and specialty food categories as brands upgraded packaging for better dosing and consumer convenience. Strong support from EU plastic directives encouraged higher recycled-content integration. Western Europe led growth, while Central and Eastern Europe showed rising adoption as retail expansion and private-label penetration increased across wider product ranges.
Asia Pacific
Asia Pacific dominated the Plastic Caps and Closures Market with about 39% share in 2024. Fast expansion of beverage, pharmaceutical, and packaged food industries supported large-scale closure production across China, India, Indonesia, and Vietnam. Manufacturers increased output of flip-top, screw, and dispensing caps to meet rising demand from urban consumers. Strong investment in FMCG and e-commerce drove higher consumption of PET bottles and HDPE containers. Regional players also adopted lightweight and cost-efficient designs to improve margins. Growing focus on recyclability and upgraded quality standards strengthened Asia Pacific’s leading position.
Latin America
Latin America captured roughly 6% share in 2024, supported by steady growth in bottled drinks, household cleaners, and personal care goods. Brazil and Mexico led demand as local converters expanded supply of cost-effective closures for mainstream brands. Adoption of tamper-evident and dispensing formats grew due to safety needs and rising consumer expectations. Regional packaging upgrades improved durability and compatibility with PET and HDPE containers. Market momentum rose further as food and pharmaceutical sectors increased reliance on standardized closure systems. Economic recovery in key countries helped stabilize demand across major applications.
Middle East & Africa
The Middle East & Africa region held close to 5% share in 2024. Growth came from expanding beverage filling operations, rising packaged water use, and increasing demand for affordable FMCG packaging. Gulf countries adopted advanced molding technologies, while African markets focused on cost-efficient and durable closures. Urbanization boosted consumption of personal care and household cleaning products, supporting wider closure use. Investments in local manufacturing improved supply stability, reducing import dependency. Gradual adoption of lightweight and tamper-evident designs strengthened market presence across both premium and mass-market product lines.
Market Segmentations:
By Material
- Plastic
- Metal
- Others
By Product Type
- Tethered Caps
- Push/Pull Caps
- Screw Caps
- Others
By End-use
- Food & Beverages
- Pharmaceutical
- Consumer Goods
- Personal Care & Cosmetics
- Others
By Geography
- North America
- U.S.
- Canada
- Mexico
- Europe
- Germany
- France
- U.K.
- Italy
- Spain
- Rest of Europe
- Asia Pacific
- China
- Japan
- India
- South Korea
- South-east Asia
- Rest of Asia Pacific
- Latin America
- Brazil
- Argentina
- Rest of Latin America
- Middle East & Africa
- GCC Countries
- South Africa
- Rest of the Middle East and Africa
Competitive Landscape
The Plastic Caps and Closures Market shows strong competition led by global players such as Aptar Group, UNITED CAPS, Silgan Holdings Inc., Nippon Closures Co., Ltd., O.Berk Company, Guala Closures S.p.A, Closure Systems International, Amcor Plc, Mold-Rite Plastics, and BERICAP Holding GmbH. These companies expand their reach through steady product upgrades, smart lightweight designs, and better sealing systems for food, beverage, and personal care brands. Many producers invest in high-speed molding lines and recyclable resin grades to meet rising demand for sustainable packaging. Strategic mergers, regional plant expansions, and custom closure designs also help players strengthen customer ties. The shift toward tethered caps, driven by tightening rules in Europe and Asia, pushes manufacturers to speed up innovation programs. Growing use of precision molds and digital quality checks further supports competitive advantage in large-volume applications.
Key Player Analysis
- Aptar Group (U.S.)
- UNITED CAPS (Luxembourg)
- Silgan Holdings Inc. (U.S.)
- Nippon Closures Co., Ltd. (Japan)
- O.Berk Company, LLC (U.S.)
- Guala Closures S.p.A (Italy)
- Closure Systems International, Inc. (U.S.)
- Amcor Plc (Australia)
- Mold-Rite Plastics, LLC (U.S.)
- BERICAP Holding GmbH (Germany
Recent Developments
- In November 2025, UNITED CAPS participated for the first time in ProPak Indonesia 2025 marking a strategic push to strengthen its footprint in Southeast Asia and expand relationships with regional customers/partners.
- In September 2025, At Drinktec 2025, Aptar Closures introduced a new generation of tamper-evident, recycling‑ready sports beverage closures. The showcased closures (NexTE, Rocket, Balance) are designed for better user‑experience, improved recyclability, and compliance with plastic regulations.
- In June 2025, UNITED CAPS showcased new high‑performance closures at ProPak Asia 2025 (Bangkok). Among them: a 29/25 S-SPRING II tethered sport cap and a 127 SAFE-TE infant‑nutrition snap cap both designed for safety, convenience, and sustainable packaging
Report Coverage
The research report offers an in-depth analysis based on Material, Product type, End-Use and Geography. It details leading market players, providing an overview of their business, product offerings, investments, revenue streams, and key applications. Additionally, the report includes insights into the competitive environment, SWOT analysis, current market trends, as well as the primary drivers and constraints. Furthermore, it discusses various factors that have driven market expansion in recent years. The report also explores market dynamics, regulatory scenarios, and technological advancements that are shaping the industry. It assesses the impact of external factors and global economic changes on market growth. Lastly, it provides strategic recommendations for new entrants and established companies to navigate the complexities of the market.
Future Outlook
- Demand will grow as beverage and personal care brands expand packaging use.
- Recyclable and mono-material caps will gain wider adoption across regions.
- Tethered closures will become standard due to tightening sustainability rules.
- Smart and enhanced-dosing caps will rise in pharma and premium segments.
- Lightweight designs will cut material use and lower production costs.
- Automation and high-speed molding lines will shape production efficiency.
- Regional players will expand capacity to reduce import dependence.
- E-commerce packaging growth will increase demand for secure closures.
- Brands will adopt more tamper-evident formats to improve product safety.
- Circular-economy goals will push manufacturers to increase recycled-content integration.
Request a Free Sample
Fill in your details and we'll send you a free sample report.
- Sample data tables & charts
- Research methodology
Need a Custom Version of This Report?
Tailor the scope, geography, or segments to your exact requirements.
- Custom geography or segment scope
- Direct access to our analyst team
Frequently Asked Questions
What is the current market size for Plastic Caps and Closures Market, and what is its projected size in 2032?
At what Compound Annual Growth Rate is Plastic Caps and Closures Market projected to grow between 2024 and 2032?
Which Plastic Caps and Closures Market segment held the largest share in 2024?
What are the primary factors fueling the growth of Plastic Caps and Closures Market?
Who are the leading companies in Plastic Caps and Closures Market?
Table of Content
Chapter 1. Report Introduction
- 1.1 Report Description & Purpose
- 1.1.1 Report Title & Market Definition
- 1.1.2 Unique Selling Propositions (USP) & Key Differentiators
- 1.1.3 Value Proposition for Stakeholders
- 1.2 Research Objectives
- 1.2.1 Market Sizing Objectives (Volume & Revenue)
- 1.2.2 Segmentation Objectives
- 1.2.3 Competitive Intelligence Objectives
- 1.2.4 Forecast & Scenario Objectives
- 1.3 Report Scope
- 1.3.1 Plastic Caps and Closures Scope – Types & Subtypes Covered
- 1.3.2 Geographic Scope – Regions & Countries Covered
- 1.3.3 Historical Period, Base Year & Forecast Period (2024; forecast to 2032)
- 1.3.4 Inclusions & Exclusions
- 1.4 HS Code & Classification Framework
- 1.5 Currency, Units & Pricing Basis
- 1.6 Target Stakeholders
- 1.7 Limitations & Assumptions
Chapter 2. Executive Summary
- 2.1 Global Plastic Caps and Closures Market Snapshot
- 2.1.1 Market Size – Historical (2024) & Forecast (2024-2032) (2024: USD 52047.6 million → 2032: USD 65932.34 million)
- 2.1.2 Volume & Revenue – Global Totals
- 2.1.3 Key Market Highlights – Top Five Facts
- 2.2 Plastic Caps and Closures Market Segmentation Snapshot
- 2.2.1 Market Split by Region – 2024 vs. 2032
- 2.3 Competitive Snapshot
- 2.3.1 Top 10 Players by Revenue Share – 2024
- 2.3.2 Top 10 Players by Volume Share – 2024
- 2.3.3 Recent Strategic Developments (18-Month Summary)
- 2.4 Key Investment Highlights & Strategic Conclusions
Chapter 3. Plastic Caps and Closures Market Dynamics & Industry Analysis
- 3.1 Market Overview & Context
- 3.1.1 Plastic Caps and Closures Market Position in the Broader Automotive Value Chain
- 3.1.2 OEM vs. Replacement Market Dynamics
- 3.1.3 Market Maturity & Development Stage by Region
- 3.2 Plastic Caps and Closures Market Drivers
- 3.3 Plastic Caps and Closures Market Restraints & Challenges
- 3.4 Plastic Caps and Closures Market Opportunities
- 3.5 Porter's Five Forces Analysis
- 3.5.1 Threat of New Entrants
- 3.5.2 Bargaining Power of Suppliers
- 3.5.3 Bargaining Power of Buyers
- 3.5.4 Threat of Substitutes
- 3.5.5 Competitive Rivalry – Intensity Assessment
- 3.6 Plastic Caps and Closures Value Chain Analysis
- 3.6.1 Upstream – Raw Material/Input Suppliers
- 3.6.1.1 Raw Material/Input 1
- 3.6.1.2 Raw Material/Input 2
- 3.6.1.3 Raw Material/Input 3
- 3.6.2 Midstream – Production/Manufacturing/Service Delivery
- 3.6.2.1 Production/Process Overview
- 3.6.2.2 Key Facility Locations & Capacity by Manufacturer
- 3.6.3 Downstream – Distribution & End Consumer
- 3.6.3.1 Primary Channel – B2B/OEM
- 3.6.3.2 Secondary Channels – Dealer, Retail, Online, Direct
- 3.6.4 Value Chain Profitability Analysis
- 3.6.1 Upstream – Raw Material/Input Suppliers
- 3.7 PESTEL Analysis
- 3.7.1 Political Factors
- 3.7.2 Economic Factors
- 3.7.3 Social Factors
- 3.7.4 Technological Factors
- 3.7.5 Environmental Factors
- 3.7.6 Legal Factors
- 3.8 Plastic Caps and Closures Supply Chain Analysis
- 3.8.1 Raw Material/Input Supply Risk Assessment
- 3.8.2 Manufacturing Concentration Risk (Geographic Exposure)
- 3.8.3 Trade Disruption Impact Analysis
- 3.9 Regulatory & Policy Landscape
Note: The regulatory and policy landscape section covers regulations based on their applicability to the market, Plastic Caps and Closures category, geography, and scope of the study. Only regulatory frameworks with a material impact on operations, compliance, trade, sustainability, or market access are analyzed in detail.
Chapter 4. Key Investment Pockets & Opportunity Analysis
- 4.1 Plastic Caps and Closures Market Attractiveness Analysis
- 4.1.1 By Region – Investment Attractiveness Matrix (Volume × CAGR)
- 4.2 Absolute Revenue Growth Opportunity
- 4.2.1 By Region – Absolute USD Growth Through 2032
- 4.3 Incremental Volume Opportunity
- 4.3.1 By Region – Incremental Volume Through 2032
- 4.3.2 Segment – Incremental Volume
- 4.4 Emerging Submarket Opportunity Deep Dive (Subject to Applicability)
- 4.5 Emerging Market Opportunity Scorecards
- 4.5.1 United States
- 4.5.2 Europe
- 4.5.3 Asia
- 4.5.4 Middle East & Africa
Note: Emerging Market Opportunity Scorecards will be included based on relevance and strategic importance. Regions listed are indicative and may vary depending on data availability and market dynamics.
Chapter 5. Plastic Caps and Closures Import-Export Analysis & Trade Flows
- 5.1 Global Trade Overview
- 5.1.1 Global Export Value by Country (2024)
- 5.1.2 Global Export Volume by Country (2024)
- 5.1.3 Global Import Value by Country (2024)
- 5.1.4 Global Import Volume by Country (2024)
- 5.1.5 Net Trade Balance by Country (2024)
- 5.2 Export Analysis – Segment
- 5.2.1 Type 1 (HS Code)
- 5.2.2 Type 2 (HS Code)
- 5.2.3 Type 3 (HS Code)
- 5.2.4 Type 4 (HS Code)
- 5.2.5 Type 5 (HS Code)
- 5.3 Import Analysis – Segment
- 5.3.1 Type 1 (HS Code)
- 5.3.2 Type 2 (HS Code)
- 5.3.3 Type 3 (HS Code)
- 5.3.4 Type 4 (HS Code)
- 5.3.5 Type 5 (HS Code)
- 5.4 Average Unit Trade Prices
- 5.4.1 Average Export Price – Segment & Country
- 5.4.2 Average Import Price – Segment & Source Country
- 5.4.3 Price Trends (2024)
- 5.5 Key Trade Route Analysis
- 5.5.1 Trade Route 1
- 5.5.2 Trade Route 2
- 5.5.3 Trade Route 3
- 5.5.4 Trade Route 4
- 5.5.5 Trade Route 5
- 5.6 Trade Policy Impact Assessment
- 5.6.1 US Anti-Dumping & Section 301 Tariffs
- 5.6.2 EU Customs Union Impact
- 5.6.3 Major Free Trade Agreements
- 5.6.4 USMCA Rules of Origin
Note: Trade policy analysis will be included only where relevant to the Plastic Caps and Closures market.
Chapter 6. Competitive Landscape & Company Benchmarking
- 6.1 Plastic Caps and Closures Market Concentration & Structure
- 6.1.1 Herfindahl-Hirschman Index (HHI) – vs. 2024
- 6.1.2 Tier 1, Tier 2 & Tier 3 Market Structure
- 6.1.3 Global, Regional & Local Player Dynamics
- 6.2 Plastic Caps and Closures Market Share Analysis – 2024
- 6.2.1 Global Revenue Share by Company
- 6.2.2 Global Volume Share by Company
- 6.2.3 Regional Revenue Share
- 6.2.4 Market Share Evolution ( vs. 2024)
- 6.2.5 OEM Segment Share by Company
- 6.2.6 Replacement Segment Share by Company
- 6.3 Production/Delivery Capacity & Facility Analysis
- 6.3.1 Global Installed Capacity
- 6.3.2 Capacity Utilization Rates
- 6.3.3 Production/Output Volume
- 6.3.4 Facility Locations & Capacity Map
- 6.3.5 Planned Capacity Additions
- 6.4 Plastic Caps and Closures Competitive Benchmarking Matrix
- 6.4.1 Revenue, Volume, CAGR & Profitability Comparison
- 6.4.2 Channel Revenue Mix
- 6.4.3 Geographic Revenue Exposure
- 6.4.4 R&D Intensity
- 6.4.5 Sustainability Maturity
- 6.5 Strategic Developments in Plastic Caps and Closures (Last 24 Months)
- 6.5.1 Mergers, Acquisitions & Divestments
- 6.5.2 New Plastic Caps and Closures Launches
- 6.5.3 Facility Expansions
- 6.5.4 Strategic Alliances, Joint Ventures & Partnerships
- 6.5.5 Distribution Expansion & Market Entry
- 6.5.6 Sustainability & ESG Initiatives
- 6.6 Competitive Strategy Mapping
- 6.6.1 Leader, Challenger, Follower & Niche Classification
- 6.6.2 Pricing Strategy Comparison
- 6.6.3 Channel Strategy Matrix
Note: Strategic developments are included based on their materiality and the availability of reliable information.
Chapter 7. Global Plastic Caps and Closures Market – By Distribution Channel
- 7.1 Segment Overview
- 7.1.1 Volume & Revenue Split by Channel (2024 & 2032)
- 7.1.2 Channel Mix Evolution (2024-2032)
Chapter 8. Regional Market Analysis – Global Overview
- 8.1 Global Regional Overview
- 8.1.1 Regional Volume Share
- 8.1.2 Regional Revenue Share
- 8.1.3 Regional Volume by Region
- 8.1.4 Regional Revenue by Region
- 8.1.5 Regional Forecast Through 2032
- 8.2 Cross-Regional Segment Analysis
- 8.2.1 By Distribution Channel
- 8.2.2 By Brand/Price Tier
Chapter 9. North America Plastic Caps and Closures Market
- 9.1 United States
- 9.2 Canada
- 9.3 Mexico
Chapter 10. Europe Plastic Caps and Closures Market
- 10.1 Germany
- 10.2 France
- 10.3 Italy
- 10.4 United Kingdom
- 10.5 Spain
- 10.6 Poland
- 10.7 Russia
- 10.8 Netherlands
- 10.9 Belgium
- 10.10 Sweden
- 10.11 Denmark
- 10.12 Norway
- 10.13 Rest of Europe
Chapter 11. Asia Pacific Plastic Caps and Closures Market
- 11.1 China
- 11.2 India
- 11.3 Japan
- 11.4 South Korea
- 11.5 Thailand
- 11.6 Indonesia
- 11.7 Vietnam
- 11.8 Malaysia
- 11.9 Australia
- 11.10 Rest of Asia Pacific
Chapter 12. Latin America Plastic Caps and Closures Market
- 12.1 Brazil
- 12.2 Argentina
- 12.3 Colombia
- 12.4 Chile
- 12.5 Rest of Latin America
Chapter 13. Middle East Plastic Caps and Closures Market
- 13.1 Saudi Arabia
- 13.2 United Arab Emirates
- 13.3 Turkey
- 13.4 Israel
- 13.5 Iran
- 13.6 Rest of the Middle East
Chapter 14. Africa Plastic Caps and Closures Market
- 14.1 South Africa
- 14.2 Egypt
- 14.3 Nigeria
- 14.4 Morocco
- 14.5 Rest of Africa
Chapter 15. Plastic Caps and Closures Company Profiles
- 15.1 [Company 01]
- 15.1.1 Company Overview
- 15.1.2 Key Management Personnel
- 15.1.3 Products & Services Portfolio
- 15.1.4 Financial Performance
- 15.1.5 Key Market Focus & Geographic Presence
- 15.1.6 Recent Developments & Strategic Initiatives
Note: The company profile list is preliminary and may change based on research findings, market developments, data availability, and client requirements.
Chapter 16. Appendices
- Appendix A – List of Abbreviations & Acronyms
- Appendix B – Industry Classification Code Reference – Full Series
- Appendix C – Production & Capacity Data Tables
- Appendix D – End-Use & Demand Base Tables
- Appendix E – Consumption & Replacement Rate Assumptions
- Appendix F – ASP Reference Tables
- Appendix G – Manufacturing & Facility Database
- Appendix H – Import-Export Data Tables
- Appendix I – Regulatory Summary Tables
- Appendix J – Primary Research Participant List (Anonymized)
- Appendix K – Primary Research Questionnaire Framework
- Appendix L – Data Sources & Bibliography
- Appendix M – Market Size Divergence & Source Comparison
Chapter 17. Research Methodology
- 17.1 Research Framework & Philosophy
- 17.2 Secondary Research – Sources, Hierarchy & Data Extraction
- 17.3 Data Modeling – Bottom-Up & Top-Down Market Sizing
- 17.4 Primary Research – Stakeholder Framework, LOI & Sample Sizes
- 17.5 Forecast Methodology – Regression, Scenario & Sensitivity Analysis
- 17.6 Quality Control – Four-Layer Validation Framework
- 17.7 Limitations & Standard Assumptions
- 17.8 Disclaimer
