Market Overview
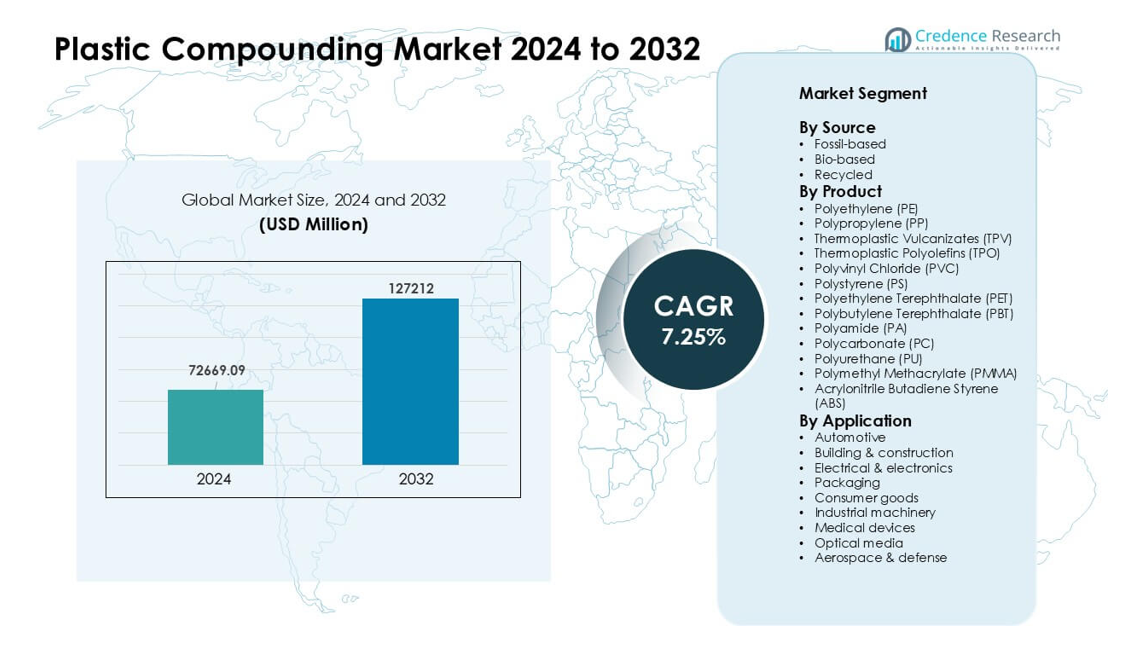
Plastic Compounding Market was valued at USD 72669.09 million in 2024 and is anticipated to reach USD 127212 million by 2032, growing at a CAGR of 7.25 % during the forecast period.
| REPORT ATTRIBUTE |
DETAILS |
| Historical Period |
2020-2023 |
| Base Year |
2024 |
| Forecast Period |
2025-2032 |
| Plastic Compounding Market Size 2024 |
USD 72669.09 million |
| Plastic Compounding Market, CAGR |
7.25% |
| Plastic Compounding Market Size 2032 |
USD 127212 million |
The Plastic Compounding Market includes major players such as Covestro AG, RTP Company, BASF SE, Asahi Kasei Corporation, DuPont de Nemours, Inc., LyondellBasell Industries Holdings B.V., KRATON CORPORATION, Dow, Inc., S&E Specialty Polymers, LLC (Aurora Plastics), and SABIC. These companies expanded their presence through advanced engineered compounds, sustainable material development, and strong partnerships with automotive, electronics, and packaging manufacturers. Asia Pacific remained the leading region in 2024 with about 43% share, supported by large-scale production, strong demand from automotive and electronics industries, and rapid growth in manufacturing infrastructure across China, India, Japan, and South Korea.
Market Insights
- The Plastic Compounding Market reached a USD 72669.09 million value in 2024 and is projected to grow at a steady 7.25% CAGR through 2032, driven by rising demand across automotive, packaging, and electronics applications.
- Strong growth came from automotive, which held about 27% share in 2024 as manufacturers used lightweight compounds to improve efficiency and support EV platforms.
- Trends shifted toward sustainable and high-performance materials, with recycled and bio-based compounds gaining traction alongside reinforced PP, ABS, PC, and PA grades for advanced uses.
- Competition remained intense among Covestro AG, BASF SE, SABIC, LyondellBasell, Dow, and other players expanding engineered formulations, recycling partnerships, and regional production capacities.
- Asia Pacific dominated with nearly 43% share in 2024 due to strong manufacturing output, while North America and Europe followed with significant adoption of engineering plastics and recycled compounds across mobility, packaging, and electronics sectors.
Access crucial information at unmatched prices!
Request your sample report today & start making informed decisions powered by Credence Research Inc.!
Download Sample
Market Segmentation Analysis:
By Source
Fossil-based compounds held the dominant position in 2024 with nearly 78% share. Broad use in automotive, packaging, and electronics kept demand strong due to stable performance and wide processing options. Bio-based materials grew as brands pursued lower emissions and greener inputs. Recycled compounds advanced as waste-reduction rules increased the use of post-consumer resins. Strong supply chains and lower cost helped fossil-based materials stay ahead, while rising sustainability pressure continued to push both recycled and bio-based grades into high-volume applications.
- For instance, Ford uses more than 50 million pounds of post-consumer recycled plastics annually in various vehicle parts.
By Product
Polypropylene (PP) led the product segment in 2024 with about 32% share. PP stayed ahead because manufacturers relied on its low weight, solid strength, and high chemical resistance in automotive, packaging, and consumer goods. Polyethylene (PE), PET, ABS, and PA followed with steady demand in bottles, electronics housings, and structural parts. Engineering plastics such as PC, PBT, PMMA, and PU gained traction in high-heat or optical applications. Strong processability and broad end-use reach helped PP maintain a clear lead across global compounding lines.
- For instance, the global PP market volume was estimated at around 87.21 million tonnes in 2024.
By Application
Automotive dominated the application segment in 2024 with around 27% share. Automakers increased the use of lightweight compounds to boost fuel efficiency and support EV platform design. Packaging grew through strong PET, PP, and PE demand for rigid and flexible formats. Electrical and electronics advanced due to higher use of flame-retardant grades. Building and construction, consumer goods, industrial machinery, medical devices, optical media, and aerospace adopted engineered resins for strength and durability. Weight reduction and design flexibility kept automotive in the top position.
Key Growth Drivers
Rising Demand from Automotive and Electronics Sectors
Demand increased as automakers used lightweight compounds to cut vehicle weight and improve energy efficiency. Electronics producers also relied on engineered plastics for compact, heat-resistant, and safe device components. Strong growth in EV production raised the need for high-performance PP, PA, ABS, and PC grades. Tier-1 suppliers preferred compounded materials because they support tighter tolerances and help reduce total system cost. These advantages strengthened adoption across dashboards, battery housings, connectors, and lighting units. Rapid expansion in global mobility and smart devices kept automotive and electronics as the core forces driving the Plastic Compounding Market.
- For instance, the average modern car now contains around 426 pounds of plastics and composites a benchmark cited by industry analysis to quantify how deeply integrated plastics are into vehicle design and how much weight can be saved versus traditional metals.
Expansion of Packaging and Consumer Goods Applications
Packaging demand grew as brands adopted PE, PP, PET, and recycled compounds to meet performance and sustainability targets. Food, beverage, and personal care products required strong barrier strength, clarity, and chemical stability, which reinforced the need for advanced compounding solutions. Consumer goods producers increased use of customized textures, colors, and reinforced grades to support durable and appealing products. E-commerce growth accelerated demand for protective packaging and lightweight designs. These conditions strengthened the market as manufacturers sought cost-effective, high-throughput materials that improved product quality while supporting faster production cycles.
- For instance, in the global beverage-bottle market, resin such as Polyethylene terephthalate (PET) remains widely used because of its chemical inertness and strength. A key review of PET recycling notes that PET bottles represent one of the largest categories in beverage packaging demonstrating continued demand for PET in high-clarity, high-safety applications.
Shift Toward Sustainable and Recycled Materials
Global sustainability goals encouraged companies to adopt recycled and bio-based compounds at scale. Government rules on waste reduction pushed industries to integrate post-consumer resins into automotive, packaging, and electronics applications. Major brands pledged higher recycled content, which boosted investments in advanced sorting and reprocessing technologies. Bio-based polymers also gained interest due to lower emissions and reduced fossil dependence. Improved mechanical recovery methods increased the performance of recycled grades, making them suitable for mid- and high-end uses. This shift strengthened long-term demand and helped the Plastic Compounding Market move toward cleaner material systems.
Key Trends & Opportunities
Growth of High-Performance Engineering Plastics
Engineering plastics such as PA, PBT, PC, PMMA, and TPU saw rising use due to their heat resistance, dimensional stability, and strength. Industries expanded adoption in battery modules, charging systems, lightweight structures, and medical housings. Growth in 5G devices, EV components, and industrial automation opened new opportunities for functional additives, flame retardants, and conductive compounds. Manufacturers invested in high-precision compounding lines to meet strict quality needs. This trend strengthened demand for specialty formulations that replaced metals and supported design flexibility, allowing companies to serve advanced applications with better performance and lower production cost.
- For instance, The report states that the average mass of plastics in a U.S. automobile increased by 16% to 411 pounds (186 kg) from 2012 to 2021.
Advancements in Additive Technologies and Custom Formulations
Producers used advanced additives to deliver UV resistance, antimicrobial performance, higher impact strength, and improved surface finishing. Customized formulations helped customers meet exact performance targets in electrical systems, medical devices, and automotive interiors. Faster adoption of 3D printing materials created openings for tailored compounds that supported new design possibilities. Digital color-matching and online compound selection tools improved supply speed and reduced development time. These innovations helped compounders win high-margin orders and respond to niche requirements, offering strong opportunities to differentiate products in competitive markets.
- For instance, a major producer has a commercial cellulose nanocrystal (CNC) capacity of approximately 300 tonnes/year, indicating this general magnitude is relevant in the bio-based materials field.
Rising Investments in Recycling Infrastructure
Governments and brands invested in mechanical and chemical recycling to increase the supply of high-quality post-consumer resins. New technologies improved decontamination and molecular recovery for PP, PE, PET, and ABS streams. Infrastructure upgrades supported large-scale circular systems that fed packaging, automotive, and appliance applications. These changes encouraged compounders to create performance-enhanced recycled grades, which matched more demanding use cases. Growing collaboration between recyclers and compounders strengthened long-term opportunities as industries pursued lower-carbon materials and circular-economy models.
Key Challenges
Volatility in Raw Material Prices
Raw material prices fluctuated due to energy costs, supply shortages, and geopolitical instability. Compounders struggled to maintain stable pricing while managing unpredictable resin markets. Procurement teams faced pressure to secure reliable supply of PP, PE, ABS, PA, and additives at competitive rates. These fluctuations affected production planning and squeezed profit margins for both manufacturers and downstream customers. Many companies increased the use of recycled or alternative materials, but quality variability remained a challenge. Persistent cost swings limited long-term contract stability and created uncertainty for expansion plans across the Plastic Compounding Market.
Regulatory Pressure on Plastics Use and Waste Management
Stricter global rules on plastic waste, single-use products, and emissions challenged manufacturers. Companies needed investments in cleaner technologies and compliance systems to meet evolving standards. Restrictions on additives and hazardous substances added complexity in product development. Compliance failures risked penalties, product recalls, and restricted market access. Although regulations encouraged recycled and bio-based compounds, many industries faced technical and cost barriers in switching materials. Managing environmental expectations while meeting performance needs created a persistent challenge, especially for sectors with heavy reliance on traditional plastics.
Regional Analysis
North America
North America held around 27% share of the Plastic Compounding Market in 2024, supported by strong demand from automotive, packaging, and electrical industries. Compounded PP, PE, ABS, and PC gained wide use in lightweight vehicle parts and electronics housings. The region benefited from advanced manufacturing systems, high recycling capability, and steady investments in EV platforms. Growth in medical devices and consumer goods also increased the need for engineered compounds with stronger mechanical and thermal properties. Supportive regulations for sustainable materials encouraged higher adoption of recycled and bio-based compounds across major applications.
Europe
Europe accounted for nearly 24% share in 2024, driven by strict environmental rules and strong adoption of high-performance engineering plastics. Automakers used lightweight compounds to meet CO₂ reduction goals, while packaging companies shifted toward recycled PP, PE, and PET. Electronics and industrial machinery manufacturers expanded the use of flame-retardant and heat-resistant grades. The region’s circular-economy policies increased investment in mechanical and chemical recycling, boosting supply of high-quality post-consumer resins. Strong R&D capability helped Europe maintain leadership in specialty formulations, especially for transportation, healthcare, and advanced industrial applications.
Asia Pacific
Asia Pacific dominated the Plastic Compounding Market with about 43% share in 2024, supported by rapid industrialization, strong automotive production, and expanding electronics manufacturing. China, Japan, India, and South Korea invested heavily in EV platforms, consumer electronics, and packaging, which increased demand for PP, PE, ABS, PC, and PA compounds. The region’s cost-effective manufacturing base and large supplier ecosystem supported high-volume compounding operations. Growth in construction, appliances, and medical devices also contributed to strong uptake. Rising sustainability programs improved adoption of recycled compounds across both domestic and export-focused industries.
Latin America
Latin America captured roughly 4% share in 2024, with demand concentrated in automotive, packaging, consumer goods, and construction sectors. Brazil and Mexico led regional consumption due to their strong vehicle production and expanding FMCG markets. PP, PE, and PVC compounds remained widely used for pipes, cables, packaging films, and interiors. Economic recovery supported industrial output, while growing interest in circular materials encouraged early adoption of recycled compounds. However, limited local recycling infrastructure slowed broader uptake. Rising urbanization and investment in manufacturing helped sustain steady, though moderate, market growth across the region.
Middle East & Africa
The Middle East & Africa region held about 2% share in 2024, driven by growing construction, packaging, and consumer goods industries. Demand for PP, PE, and PVC compounds increased as infrastructure and housing projects expanded in the GCC and parts of Africa. Local polymer production capacity supported competitive pricing and stable supply for compounders. Industrial diversification programs in Saudi Arabia and the UAE encouraged downstream plastics development. However, slower adoption of high-performance engineering plastics and limited recycling infrastructure moderated regional growth. Rising investment in advanced manufacturing is expected to support future demand.
Market Segmentations:
By Source
- Fossil-based
- Bio-based
- Recycled
By Product
- Polyethylene (PE)
- Polypropylene (PP)
- Thermoplastic Vulcanizates (TPV)
- Thermoplastic Polyolefins (TPO)
- Polyvinyl Chloride (PVC)
- Polystyrene (PS)
- Polyethylene Terephthalate (PET)
- Polybutylene Terephthalate (PBT)
- Polyamide (PA)
- Polycarbonate (PC)
- Polyurethane (PU)
- Polymethyl Methacrylate (PMMA)
- Acrylonitrile Butadiene Styrene (ABS)
By Application
- Automotive
- Building & construction
- Electrical & electronics
- Packaging
- Consumer goods
- Industrial machinery
- Medical devices
- Optical media
- Aerospace & defense
By Geography
- North America
- Europe
- Germany
- France
- U.K.
- Italy
- Spain
- Rest of Europe
- Asia Pacific
- China
- Japan
- India
- South Korea
- South-east Asia
- Rest of Asia Pacific
- Latin America
- Brazil
- Argentina
- Rest of Latin America
- Middle East & Africa
- GCC Countries
- South Africa
- Rest of the Middle East and Africa
Competitive Landscape
The Plastic Compounding Market features strong competition among leading players such as Covestro AG, RTP Company, BASF SE, Asahi Kasei Corporation, DuPont de Nemours, Inc., LyondellBasell Industries Holdings B.V., KRATON CORPORATION, Dow, Inc., S&E Specialty Polymers, LLC (Aurora Plastics), and SABIC. These companies focused on expanding portfolios of PP, PE, ABS, PC, PA, and specialty engineered compounds to serve automotive, electronics, packaging, and construction applications. Firms strengthened their market positions through investments in high-performance formulations, recycled-content grades, and bio-based solutions. Many competitors improved their global presence by expanding production capacity in Asia Pacific and North America. Strategic partnerships with OEMs and recycling firms helped companies support circular-economy commitments and deliver sustainable compounds. Continuous innovation in additive technologies, color matching, and polymer modification kept competition intense across high-value end-use sectors.
Shape Your Report to Specific Countries or Regions & Enjoy 30% Off!
Key Player Analysis
- Covestro AG
- RTP Company
- BASF SE
- Asahi Kasei Corporation
- DuPont de Nemours, Inc.
- LyondellBasell Industries Holdings B.V.
- KRATON CORPORATION
- Dow, Inc.
- S&E Specialty Polymers, LLC (Aurora Plastics)
- SABIC
Recent Developments
- In January 2025, Covestro AG Announced a major investment to expand compounding capacity in the U.S.: Covestro said it will invest a low triple-digit million euro amount to expand its Hebron, Ohio site with multiple new production lines to manufacture custo
- mized polycarbonate compounds and blends.
- In August 2024, S&E Specialty Polymers, LLC (Aurora Plastics): Aurora Material Solutions, parent of S&E Specialty Polymers, completed an expansion of its Streetsboro, Ohio compounding facility. The project added over 140 million pounds of thermoplastic compounding capacity, strengthening its position in rigid PVC and related engineered compounds.
- In August 2024, SABIC signed a potential investment agreement with the Fujian provincial government to build an engineering thermoplastics compounding plant in Zhangzhou, China. The planned site will produce pelletized LEXAN™ PC and CYCOLOY™ PC/ABS blends for automotive, electronics, solar, and electrification applications.
Report Coverage
The research report offers an in-depth analysis based on Source, Product, Application and Geography. It details leading market players, providing an overview of their business, product offerings, investments, revenue streams, and key applications. Additionally, the report includes insights into the competitive environment, SWOT analysis, current market trends, as well as the primary drivers and constraints. Furthermore, it discusses various factors that have driven market expansion in recent years. The report also explores market dynamics, regulatory scenarios, and technological advancements that are shaping the industry. It assesses the impact of external factors and global economic changes on market growth. Lastly, it provides strategic recommendations for new entrants and established companies to navigate the complexities of the market.
Future Outlook
- Demand for lightweight automotive compounds will rise as EV production expands worldwide.
- Use of recycled and bio-based materials will grow due to stricter sustainability rules.
- Engineering plastics such as PA, PC, PBT, and ABS will gain wider adoption in electronics.
- Packaging producers will increase reliance on high-clarity and high-strength compounded resins.
- Chemical and mechanical recycling improvements will support higher-quality recycled compounds.
- Asia Pacific will remain the fastest-growing region with strong manufacturing output.
- Advanced additive technologies will improve compound performance and customization.
- Medical and industrial machinery sectors will expand the use of high-durability compounds.
- Global players will invest in new compounding plants to strengthen regional supply chains.
- Digital tools for color matching and formulation control will improve production efficiency and quality.


