
Market Overview
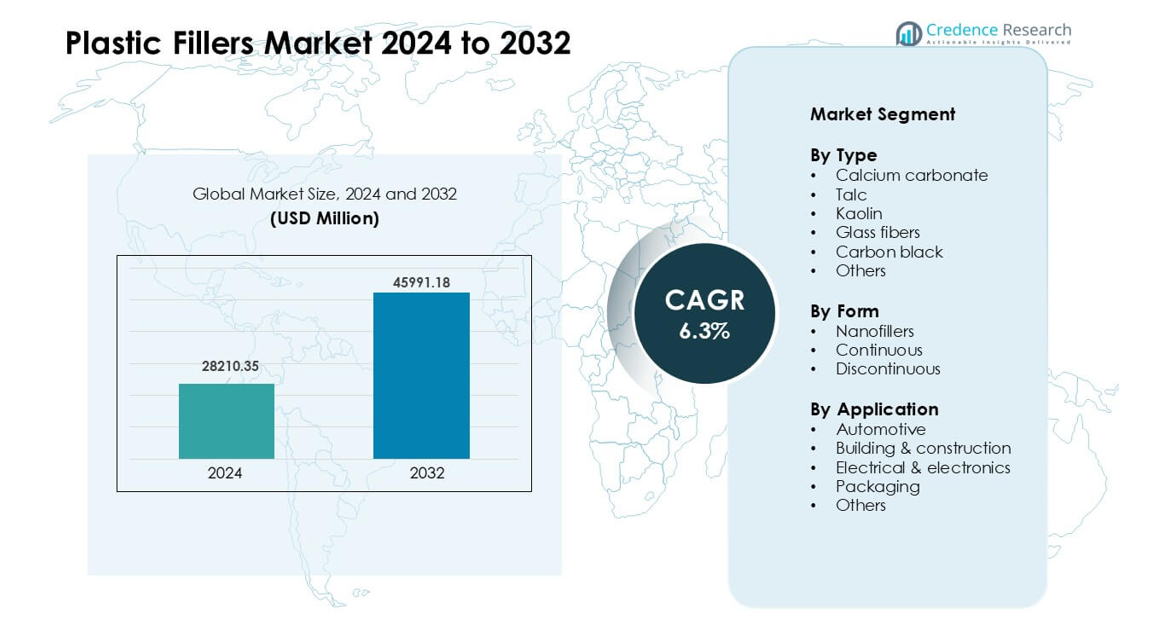
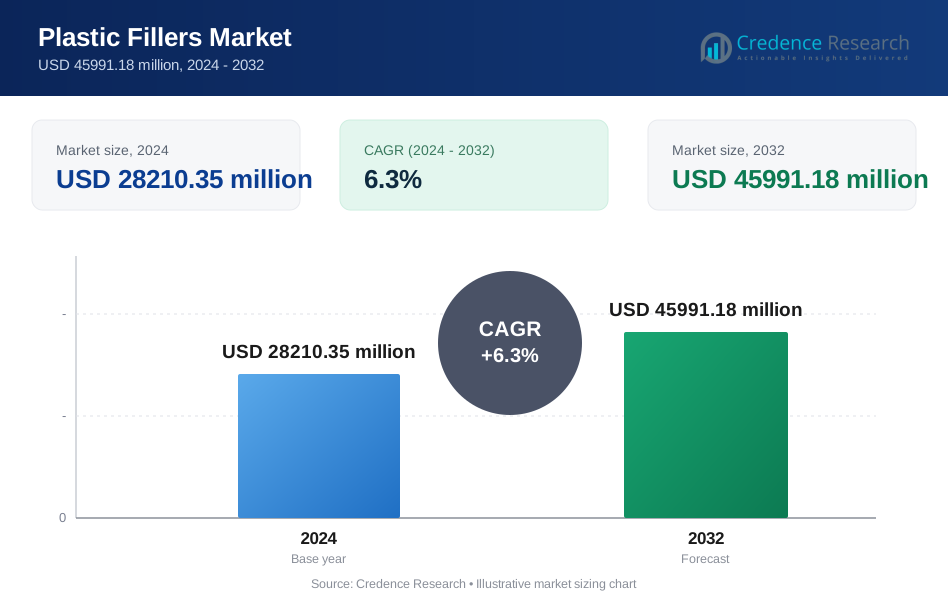
Plastic Fillers Market was valued at USD 28210.35 million in 2024 and is anticipated to reach USD 45991.18 million by 2032, growing at a CAGR of 6.3 % during the forecast period.
| REPORT ATTRIBUTE | DETAILS |
|---|---|
| Historical Period | 2020-2023 |
| Base Year | 2024 |
| Forecast Period | 2025-2032 |
| Plastic Fillers Market Size 2024 | USD 28210.35 million |
| Plastic Fillers Market, CAGR | 6.3% |
| Plastic Fillers Market Size 2032 | USD 45991.18 million |
The Plastic Fillers Market includes key players such as PolyMod Technologies, Inc., Solvay, Rogers Corporation, Shin-Etsu Chemical Co. Ltd., Momentive Performance Materials, Trelleborg AB, Lanxess, Saint-Gobain Performance Plastics, 3M, and Dow, which compete through advanced mineral fillers, engineered fibers, and specialty formulations for automotive, construction, packaging, and electronics applications. These companies focus on performance, dispersion quality, and cost efficiency to strengthen market presence. Asia Pacific emerged as the leading region in 2024 with about 41% share, driven by strong manufacturing capacity, rapid industrial growth, and expanded use of reinforced plastics in automotive, building materials, and consumer goods.
Market Insights
- The Plastic Fillers Market reached USD 28210.35 million in 2024 and is set to grow to USD 45991.18 million by 2032 at a CAGR of 6.3 %, supported by rising demand in automotive, construction, packaging, and electronics.
- Growth is driven by higher use of calcium carbonate and glass fibers in lightweight parts, stable demand in construction pipes and profiles, and cost reduction needs across high-volume plastic applications.
- Trends include wider adoption of nanofillers, strong interest in recycled mineral fillers, and increased use of surface-treated grades for better dispersion and heat resistance in advanced applications.
- Key players such as PolyMod Technologies, Solvay, Rogers Corporation, Shin-Etsu, and Dow lead through engineered fillers, specialty compounds, and expanded capacity in high-demand regions; restraints arise from raw material volatility and limits in high-clarity or high-flex applications.
- Asia Pacific held 41% share, North America 28%, and Europe 27% in 2024, while automotive led applications with 34% share and calcium carbonate dominated type with 42% share.
Market Segmentation Analysis:
By Type
Calcium carbonate led the type segment in 2024 with about 42% share. Strong demand came from its low cost, wide availability, and ability to improve stiffness and dimensional stability in plastics. The filler also supports better processing, which helps manufacturers lower production costs in packaging, construction panels, and automotive parts. Talc and glass fibers gained steady use due to their reinforcement strength, but calcium carbonate remained the preferred option because it offers balanced performance and broad compatibility across major polymer systems.
- For instance, Omya AG a global supplier of ground Calcium Carbonate offers grades tailored for PVC and PP extrusion, enabling processors to add high filler content while maintaining stable melt flow and surface finish.
By Form
Discontinuous fillers held the dominant share in 2024 with nearly 55% of the market. Manufacturers favored this form due to easy mixing, stable dispersion, and suitability for bulk plastic production. These fillers support higher mechanical strength without major changes in processing lines, which benefits large automotive and construction applications. Nanofillers grew at a faster pace thanks to improved barrier and thermal properties, but high cost limited wide adoption. Continuous fillers remained niche because they are mostly used in specialized engineered products.
- For instance, in polypropylene (PP) compounds, typical CaCO₃ filler loadings run from 10% to 50% by weight (and in some specialized applications even higher), allowing producers to replace a substantial portion of virgin polymer without major retooling.
By Application
Automotive was the leading application segment in 2024 with around 34% share. Growth came from rising use of lightweight polymer components that need reinforced strength, heat resistance, and dimensional control. Plastic fillers such as calcium carbonate and glass fibers help carmakers reduce vehicle weight while keeping durability high. Building and construction also showed strong uptake due to demand for filled PVC profiles, pipes, and insulation products. Packaging used fillers mainly for cost reduction and improved rigidity, but automotive continued to dominate due to higher performance needs.
Key Growth Drivers
Rising Demand for Lightweight and Cost-Efficient Materials
The plastic fillers market grows quickly due to strong demand for lightweight and affordable materials across major industries. Automakers use fillers to cut weight and improve fuel efficiency, while keeping part strength high. Packaging producers rely on fillers to reduce resin use and control production costs. Construction firms adopt filled plastics for pipes, panels, and profiles that need stiffness and durability. This demand increases filler use in polypropylene, polyethylene, PVC, and engineering plastics. The push for cost reduction, combined with better material properties, keeps calcium carbonate, talc, and glass fibers in steady demand across global manufacturing lines.
- For instance, Plastic fillers are widely used across various industries, including paper, plastics, rubber, paints, and adhesives, with ground calcium carbonate and talc among the top materials used globally.
Expansion of Construction and Infrastructure Activities
Large construction programs across Asia, the Middle East, and Africa boost filler consumption in building products. Filled plastics help deliver stronger profiles, improved insulation, and stable dimensional control for doors, windows, and pipe systems. These features support long service life, even in harsh climates. Rapid urban growth increases the need for utility networks, which expands use of reinforced plastic pipes and cable insulation. Builders favor filled compounds because they reduce overall system weight and support faster installation. As governments invest in housing, water supply, and smart city projects, demand for high-performance filled materials continues to rise.
- For instance, Mineral fillers such as calcium carbonate, talc, and kaolin are extensively used in plastics, including PVC, for applications like pipes, profiles, and flooring. They are added to reduce costs, improve stiffness, increase heat resistance, and enhance durability.
Growth in Consumer Goods and Electrical Applications
Wider adoption of fillers comes from rising production of appliances, electronics, and household products. Manufacturers use fillers to improve heat resistance, rigidity, and flame-retardant performance in casings, switches, adapters, and wire components. These gains help companies meet safety rules and reduce material costs in high-volume production. Consumer brands also value consistent product quality, which fillers support through better dimensional accuracy and surface finish. As electronics become smaller and more complex, reinforced compounds enable strong, thin designs. This shift strengthens filler use across thermoplastics used in connectors, housings, and structural parts.
Key Trends & Opportunities
Shift Toward High-Performance and Specialty Fillers
A clear trend involves rising demand for advanced fillers, such as nanofillers, engineered fibers, and surface-treated minerals. These options offer better heat stability, barrier strength, and mechanical performance than standard grades. Industries such as automotive, aerospace, and electronics adopt these materials to meet tight design limits and safety rules. Specialty fillers also support weight reduction and help manufacturers replace metal parts with reinforced plastics. Growing R&D investment improves compatibility with polymers, which supports stable dispersion and better final properties. As performance demands increase, specialty fillers gain a stronger role in emerging applications.
- For instance, a 2025 study on biopolymer‑nanoclay composites demonstrated that adding just 3 wt% of nanoclay into a chitosan–vanillin blend produced films with significantly improved barrier and mechanical performance compared to unfilled biopolymer films illustrating how even low-load nanofillers can deliver high-performance enhancements in packaging applications.
Growing Use of Sustainable and Recycled Filler Solutions
Sustainability pressures drive interest in recycled minerals, bio-based fillers, and low-emission processing additives. Many companies add recycled calcium carbonate from industrial waste streams to cut environmental impact and reduce reliance on virgin raw materials. Brands in packaging and consumer goods adopt these fillers to meet regulatory goals and customer expectations. Growth in circular manufacturing pushes companies to use materials that lower carbon footprints. Research in bio-fillers from wood fibers and agricultural waste expands new options for low-cost and low-impact formulations. This trend will shape future product development across global markets.
- For instance, Diatomaceous earth can be used as a filler in polymer composites, and its addition typically increases the flexural modulus (stiffness) compared to the pure polymer.
Opportunities in 3D Printing and Advanced Manufacturing
The rise of additive manufacturing creates new demand for fillers that improve print strength, stability, and heat tolerance. Reinforced filaments with minerals or fibers offer better rigidity and smoother surface finish for industrial and consumer prints. Companies exploring large-format 3D printing use filled polymers to build durable molds, fixtures, and prototypes. These materials help reduce warping and improve layer adhesion. As 3D printing shifts toward mass production, tailored filler blends will open strong growth opportunities. This trend supports higher filler use in engineering plastics designed for modern, digital manufacturing systems.
Key Challenges
Price Volatility and Supply Chain Instability
Raw material supply remains a major challenge for filler producers and compounders. Prices of minerals such as talc, kaolin, and glass fibers vary due to mining limits, energy costs, and transport issues. Global disruptions affect the movement of bulk materials, which increases lead times for manufacturers. These shifts raise production costs and make planning more difficult for compounders that depend on stable filler supply. Companies often face pressure to maintain low prices, which limits their ability to offset rising costs. This challenge forces many producers to seek alternative sources or develop recycled grades.
Technical Limits in High-Performance Applications
Plastic fillers improve many material properties, but they also create limits in toughness, impact strength, and surface clarity for certain polymers. Excess filler loading can cause brittleness, higher wear on processing equipment, and poor surface finish. These issues restrict use in products that need high flexibility, optical clarity, or complex shapes. Electronics and medical device makers require precise and stable materials, and fillers must meet strict performance and safety rules. Not all fillers work well with every resin, which demands frequent testing and reformulation. These limits slow adoption in advanced, high-value applications.
Regional Analysis
North America
North America held around 28% share of the Plastic Fillers Market in 2024. The region benefits from strong demand in automotive, packaging, and electrical applications, which rely on fillers to improve rigidity and reduce production costs. U.S. automakers use calcium carbonate, talc, and glass fibers to lighten vehicle components while maintaining safety standards. The construction sector also supports steady adoption through filled PVC pipes and profiles. Expanding recycling programs encourage greater use of sustainable fillers. Ongoing investment in advanced plastics and reinforced compounds helps maintain the region’s strong position in the global market.
Europe
Europe accounted for nearly 27% share in 2024, driven by strict regulations, high-quality standards, and strong adoption of engineered materials. Automotive companies in Germany, France, and Italy use advanced fillers to support lightweight vehicle design and emissions compliance. Packaging producers adopt mineral fillers to reduce resin use and support circular economy goals. The construction sector relies on filled PVC and polypropylene products for pipes, insulation, and window systems. Innovation in specialty fillers, including surface-treated minerals and nanofillers, strengthens demand across high-performance applications. Europe remains a leader in sustainable and technology-driven filler solutions.
Asia Pacific
Asia Pacific dominated the Plastic Fillers Market with about 41% share in 2024. The region’s leadership comes from large-scale manufacturing in China, India, Japan, and Southeast Asia. Automotive, construction, electronics, and packaging industries use high volumes of filled plastics to improve performance and manage costs. Rapid urban growth increases demand for filled PVC pipes, profiles, and insulation products. Expanding consumer goods and appliance production also drives steady uptake of reinforced compounds. Strong mineral reserves and competitive production costs support the supply of calcium carbonate, talc, and kaolin. This strong industrial base positions Asia Pacific as the fastest-growing region.
Latin America
Latin America captured roughly 9% share in 2024, supported by rising construction, packaging, and automotive production. Countries such as Brazil and Mexico use filled polymers to reduce manufacturing costs and improve product durability. Infrastructure projects increase demand for reinforced PVC pipes, sheets, and cable insulation. Local packaging firms adopt fillers to enhance rigidity and cut raw material consumption. Growth in household appliance manufacturing also supports steady demand. Despite slower industrial development than other regions, improving economic conditions and expanding plastic processing capacity continue to strengthen filler adoption across key Latin American markets.
Middle East & Africa
The Middle East & Africa region held close to 5% share in 2024. Market growth is driven by expanding construction activity, especially in Gulf countries focused on large infrastructure and real estate projects. Filled plastics support stronger and cost-effective piping, insulation, and panel systems. Demand for packaging materials rises with growing food, beverage, and consumer goods production. South Africa and the UAE show increasing adoption of reinforced compounds in automotive and electrical applications. Limited local raw material processing creates import dependency, but rising industrialization and new manufacturing investments help broaden the region’s market presence.
Market Segmentations:
By Type
- Calcium carbonate
- Talc
- Kaolin
- Glass fibers
- Carbon black
- Others
By Form
- Nanofillers
- Continuous
- Discontinuous
By Application
- Automotive
- Building & construction
- Electrical & electronics
- Packaging
- Others
By Geography
- North America
- U.S.
- Canada
- Mexico
- Europe
- Germany
- France
- U.K.
- Italy
- Spain
- Rest of Europe
- Asia Pacific
- China
- Japan
- India
- South Korea
- South-east Asia
- Rest of Asia Pacific
- Latin America
- Brazil
- Argentina
- Rest of Latin America
- Middle East & Africa
- GCC Countries
- South Africa
- Rest of the Middle East and Africa
Competitive Landscape
The Plastic Fillers Market is shaped by major players such as PolyMod Technologies, Inc., Solvay, Rogers Corporation, Shin-Etsu Chemical Co. Ltd., Momentive Performance Materials, Trelleborg AB, Lanxess, Saint-Gobain Performance Plastics, 3M, and Dow. These companies compete by offering high-performance calcium carbonate, talc, kaolin, glass fibers, and specialty functional fillers that enhance stiffness, heat resistance, dimensional stability, and cost efficiency across automotive, construction, packaging, and electronics applications. Many firms invest in engineered surface-treated fillers and nanofillers to support stronger dispersion and improved mechanical behavior. Market leaders also expand production in Asia Pacific to meet rising demand and secure mineral supply. Sustainability remains a strategic focus, with companies introducing recycled filler grades and adopting low-emission processing. Close collaboration with polymer producers and OEMs enables customized formulations that meet evolving performance and regulatory needs, strengthening competitive positioning across global markets.
Key Player Analysis
- PolyMod Technologies, Inc.
- Solvay
- Rogers Corporation
- Shin-Etsu Chemical Co. Ltd.
- Momentive Performance Materials
- Trelleborg AB
- Lanxess
- Saint-Gobain Performance Plastics
- 3M
- Dow
Recent Developments
- In October 2025, Lanxess announced new polymer additives, colorants, and heat-stable inorganic pigments at K 2025. These products target plastics coloring and performance modification, supporting higher-value filled and reinforced plastic formulations.
- In February 2025, Rogers Corporation Rogers launched new thermoset laminate materials (RO4830™ Plus) targeted at automotive millimeter-wave radar sensor PCBs part of their broader advanced-materials pipeline (including elastomeric and foam product introductions) that serve high-performance polymer and filled-material applications in automotive and electronics markets.
- In January 2025, Solvay signed a Memorandum of Understanding with Hankook to collaborate on circular silica solutions for tire manufacturing (effort to scale biosourced / waste-sourced silica feedstock for HDS highly dispersible silica). This builds on Solvay’s earlier bio-circular silica investments (Livorno) and signals expansion of lower-carbon silica feedstock for tire and other polymer filler uses.
Report Coverage
The research report offers an in-depth analysis based on Type, Form, Application and Geography. It details leading market players, providing an overview of their business, product offerings, investments, revenue streams, and key applications. Additionally, the report includes insights into the competitive environment, SWOT analysis, current market trends, as well as the primary drivers and constraints. Furthermore, it discusses various factors that have driven market expansion in recent years. The report also explores market dynamics, regulatory scenarios, and technological advancements that are shaping the industry. It assesses the impact of external factors and global economic changes on market growth. Lastly, it provides strategic recommendations for new entrants and established companies to navigate the complexities of the market.
Future Outlook
- Demand for lightweight plastics will rise, increasing the need for high-performance fillers.
- Automotive producers will expand the use of reinforced compounds for safety and efficiency gains.
- Construction materials will adopt more mineral fillers to improve durability and cost control.
- Packaging firms will use fillers to reduce resin consumption and support sustainability goals.
- Nanofillers will gain stronger adoption as prices fall and dispersion quality improves.
- Recycled mineral fillers will grow as brands move toward lower-impact materials.
- Electronics makers will seek advanced fillers that improve heat resistance and stability.
- Capacity expansion in Asia Pacific will strengthen global supply and lower processing costs.
- Companies will invest more in surface-treated fillers to enhance compatibility with engineering plastics.
- Regulatory pressure will push producers to develop cleaner, safer, and more eco-friendly filler solutions.
Request a Free Sample
Fill in your details and we'll send you a free sample report.
- Sample data tables & charts
- Research methodology
Need a Custom Version of This Report?
Tailor the scope, geography, or segments to your exact requirements.
- Custom geography or segment scope
- Direct access to our analyst team
Frequently Asked Questions
What is the current market size for Plastic Fillers Market, and what is its projected size in 2032?
At what Compound Annual Growth Rate is Plastic Fillers Market projected to grow between 2024 and 2032?
Which Plastic Fillers Market segment held the largest share in 2024?
What are the primary factors fueling the growth of Plastic Fillers Market?
Who are the leading companies in Plastic Fillers Market?
Table of Content
Chapter 1. Report Introduction
- 1.1 Report Description & Purpose
- 1.1.1 Report Title & Market Definition
- 1.1.2 Unique Selling Propositions (USP) & Key Differentiators
- 1.1.3 Value Proposition for Stakeholders
- 1.2 Research Objectives
- 1.2.1 Market Sizing Objectives (Volume & Revenue)
- 1.2.2 Segmentation Objectives
- 1.2.3 Competitive Intelligence Objectives
- 1.2.4 Forecast & Scenario Objectives
- 1.3 Report Scope
- 1.3.1 Plastic Fillers Scope – Types & Subtypes Covered
- 1.3.2 Geographic Scope – Regions & Countries Covered
- 1.3.3 Historical Period, Base Year & Forecast Period (2024; forecast to 2032)
- 1.3.4 Inclusions & Exclusions
- 1.4 HS Code & Classification Framework
- 1.5 Currency, Units & Pricing Basis
- 1.6 Target Stakeholders
- 1.7 Limitations & Assumptions
Chapter 2. Executive Summary
- 2.1 Global Plastic Fillers Market Snapshot
- 2.1.1 Market Size – Historical (2024) & Forecast (2024-2032) (2024: USD 28210.35 million → 2032: USD 45991.18 million)
- 2.1.2 Volume & Revenue – Global Totals
- 2.1.3 Key Market Highlights – Top Five Facts
- 2.2 Plastic Fillers Market Segmentation Snapshot
- 2.2.1 Market Split by Region – 2024 vs. 2032
- 2.3 Competitive Snapshot
- 2.3.1 Top 10 Players by Revenue Share – 2024
- 2.3.2 Top 10 Players by Volume Share – 2024
- 2.3.3 Recent Strategic Developments (18-Month Summary)
- 2.4 Key Investment Highlights & Strategic Conclusions
Chapter 3. Plastic Fillers Market Dynamics & Industry Analysis
- 3.1 Market Overview & Context
- 3.1.1 Plastic Fillers Market Position in the Broader Automotive Value Chain
- 3.1.2 OEM vs. Replacement Market Dynamics
- 3.1.3 Market Maturity & Development Stage by Region
- 3.2 Plastic Fillers Market Drivers
- 3.3 Plastic Fillers Market Restraints & Challenges
- 3.4 Plastic Fillers Market Opportunities
- 3.5 Porter's Five Forces Analysis
- 3.5.1 Threat of New Entrants
- 3.5.2 Bargaining Power of Suppliers
- 3.5.3 Bargaining Power of Buyers
- 3.5.4 Threat of Substitutes
- 3.5.5 Competitive Rivalry – Intensity Assessment
- 3.6 Plastic Fillers Value Chain Analysis
- 3.6.1 Upstream – Raw Material/Input Suppliers
- 3.6.1.1 Raw Material/Input 1
- 3.6.1.2 Raw Material/Input 2
- 3.6.1.3 Raw Material/Input 3
- 3.6.2 Midstream – Production/Manufacturing/Service Delivery
- 3.6.2.1 Production/Process Overview
- 3.6.2.2 Key Facility Locations & Capacity by Manufacturer
- 3.6.3 Downstream – Distribution & End Consumer
- 3.6.3.1 Primary Channel – B2B/OEM
- 3.6.3.2 Secondary Channels – Dealer, Retail, Online, Direct
- 3.6.4 Value Chain Profitability Analysis
- 3.6.1 Upstream – Raw Material/Input Suppliers
- 3.7 PESTEL Analysis
- 3.7.1 Political Factors
- 3.7.2 Economic Factors
- 3.7.3 Social Factors
- 3.7.4 Technological Factors
- 3.7.5 Environmental Factors
- 3.7.6 Legal Factors
- 3.8 Plastic Fillers Supply Chain Analysis
- 3.8.1 Raw Material/Input Supply Risk Assessment
- 3.8.2 Manufacturing Concentration Risk (Geographic Exposure)
- 3.8.3 Trade Disruption Impact Analysis
- 3.9 Regulatory & Policy Landscape
Note: The regulatory and policy landscape section covers regulations based on their applicability to the market, Plastic Fillers category, geography, and scope of the study. Only regulatory frameworks with a material impact on operations, compliance, trade, sustainability, or market access are analyzed in detail.
Chapter 4. Key Investment Pockets & Opportunity Analysis
- 4.1 Plastic Fillers Market Attractiveness Analysis
- 4.1.1 By Region – Investment Attractiveness Matrix (Volume × CAGR)
- 4.2 Absolute Revenue Growth Opportunity
- 4.2.1 By Region – Absolute USD Growth Through 2032
- 4.3 Incremental Volume Opportunity
- 4.3.1 By Region – Incremental Volume Through 2032
- 4.3.2 Segment – Incremental Volume
- 4.4 Emerging Submarket Opportunity Deep Dive (Subject to Applicability)
- 4.5 Emerging Market Opportunity Scorecards
- 4.5.1 United States
- 4.5.2 Europe
- 4.5.3 Asia
- 4.5.4 Middle East & Africa
Note: Emerging Market Opportunity Scorecards will be included based on relevance and strategic importance. Regions listed are indicative and may vary depending on data availability and market dynamics.
Chapter 5. Plastic Fillers Import-Export Analysis & Trade Flows
- 5.1 Global Trade Overview
- 5.1.1 Global Export Value by Country (2024)
- 5.1.2 Global Export Volume by Country (2024)
- 5.1.3 Global Import Value by Country (2024)
- 5.1.4 Global Import Volume by Country (2024)
- 5.1.5 Net Trade Balance by Country (2024)
- 5.2 Export Analysis – Segment
- 5.2.1 Type 1 (HS Code)
- 5.2.2 Type 2 (HS Code)
- 5.2.3 Type 3 (HS Code)
- 5.2.4 Type 4 (HS Code)
- 5.2.5 Type 5 (HS Code)
- 5.3 Import Analysis – Segment
- 5.3.1 Type 1 (HS Code)
- 5.3.2 Type 2 (HS Code)
- 5.3.3 Type 3 (HS Code)
- 5.3.4 Type 4 (HS Code)
- 5.3.5 Type 5 (HS Code)
- 5.4 Average Unit Trade Prices
- 5.4.1 Average Export Price – Segment & Country
- 5.4.2 Average Import Price – Segment & Source Country
- 5.4.3 Price Trends (2024)
- 5.5 Key Trade Route Analysis
- 5.5.1 Trade Route 1
- 5.5.2 Trade Route 2
- 5.5.3 Trade Route 3
- 5.5.4 Trade Route 4
- 5.5.5 Trade Route 5
- 5.6 Trade Policy Impact Assessment
- 5.6.1 US Anti-Dumping & Section 301 Tariffs
- 5.6.2 EU Customs Union Impact
- 5.6.3 Major Free Trade Agreements
- 5.6.4 USMCA Rules of Origin
Note: Trade policy analysis will be included only where relevant to the Plastic Fillers market.
Chapter 6. Competitive Landscape & Company Benchmarking
- 6.1 Plastic Fillers Market Concentration & Structure
- 6.1.1 Herfindahl-Hirschman Index (HHI) – vs. 2024
- 6.1.2 Tier 1, Tier 2 & Tier 3 Market Structure
- 6.1.3 Global, Regional & Local Player Dynamics
- 6.2 Plastic Fillers Market Share Analysis – 2024
- 6.2.1 Global Revenue Share by Company
- 6.2.2 Global Volume Share by Company
- 6.2.3 Regional Revenue Share
- 6.2.4 Market Share Evolution ( vs. 2024)
- 6.2.5 OEM Segment Share by Company
- 6.2.6 Replacement Segment Share by Company
- 6.3 Production/Delivery Capacity & Facility Analysis
- 6.3.1 Global Installed Capacity
- 6.3.2 Capacity Utilization Rates
- 6.3.3 Production/Output Volume
- 6.3.4 Facility Locations & Capacity Map
- 6.3.5 Planned Capacity Additions
- 6.4 Plastic Fillers Competitive Benchmarking Matrix
- 6.4.1 Revenue, Volume, CAGR & Profitability Comparison
- 6.4.2 Channel Revenue Mix
- 6.4.3 Geographic Revenue Exposure
- 6.4.4 R&D Intensity
- 6.4.5 Sustainability Maturity
- 6.5 Strategic Developments in Plastic Fillers (Last 24 Months)
- 6.5.1 Mergers, Acquisitions & Divestments
- 6.5.2 New Plastic Fillers Launches
- 6.5.3 Facility Expansions
- 6.5.4 Strategic Alliances, Joint Ventures & Partnerships
- 6.5.5 Distribution Expansion & Market Entry
- 6.5.6 Sustainability & ESG Initiatives
- 6.6 Competitive Strategy Mapping
- 6.6.1 Leader, Challenger, Follower & Niche Classification
- 6.6.2 Pricing Strategy Comparison
- 6.6.3 Channel Strategy Matrix
Note: Strategic developments are included based on their materiality and the availability of reliable information.
Chapter 7. Global Plastic Fillers Market – By Distribution Channel
- 7.1 Segment Overview
- 7.1.1 Volume & Revenue Split by Channel (2024 & 2032)
- 7.1.2 Channel Mix Evolution (2024-2032)
Chapter 8. Regional Market Analysis – Global Overview
- 8.1 Global Regional Overview
- 8.1.1 Regional Volume Share
- 8.1.2 Regional Revenue Share
- 8.1.3 Regional Volume by Region
- 8.1.4 Regional Revenue by Region
- 8.1.5 Regional Forecast Through 2032
- 8.2 Cross-Regional Segment Analysis
- 8.2.1 By Distribution Channel
- 8.2.2 By Brand/Price Tier
Chapter 9. North America Plastic Fillers Market
- 9.1 United States
- 9.2 Canada
- 9.3 Mexico
Chapter 10. Europe Plastic Fillers Market
- 10.1 Germany
- 10.2 France
- 10.3 Italy
- 10.4 United Kingdom
- 10.5 Spain
- 10.6 Poland
- 10.7 Russia
- 10.8 Netherlands
- 10.9 Belgium
- 10.10 Sweden
- 10.11 Denmark
- 10.12 Norway
- 10.13 Rest of Europe
Chapter 11. Asia Pacific Plastic Fillers Market
- 11.1 China
- 11.2 India
- 11.3 Japan
- 11.4 South Korea
- 11.5 Thailand
- 11.6 Indonesia
- 11.7 Vietnam
- 11.8 Malaysia
- 11.9 Australia
- 11.10 Rest of Asia Pacific
Chapter 12. Latin America Plastic Fillers Market
- 12.1 Brazil
- 12.2 Argentina
- 12.3 Colombia
- 12.4 Chile
- 12.5 Rest of Latin America
Chapter 13. Middle East Plastic Fillers Market
- 13.1 Saudi Arabia
- 13.2 United Arab Emirates
- 13.3 Turkey
- 13.4 Israel
- 13.5 Iran
- 13.6 Rest of the Middle East
Chapter 14. Africa Plastic Fillers Market
- 14.1 South Africa
- 14.2 Egypt
- 14.3 Nigeria
- 14.4 Morocco
- 14.5 Rest of Africa
Chapter 15. Plastic Fillers Company Profiles
- 15.1 [Company 01]
- 15.1.1 Company Overview
- 15.1.2 Key Management Personnel
- 15.1.3 Products & Services Portfolio
- 15.1.4 Financial Performance
- 15.1.5 Key Market Focus & Geographic Presence
- 15.1.6 Recent Developments & Strategic Initiatives
Note: The company profile list is preliminary and may change based on research findings, market developments, data availability, and client requirements.
Chapter 16. Appendices
- Appendix A – List of Abbreviations & Acronyms
- Appendix B – Industry Classification Code Reference – Full Series
- Appendix C – Production & Capacity Data Tables
- Appendix D – End-Use & Demand Base Tables
- Appendix E – Consumption & Replacement Rate Assumptions
- Appendix F – ASP Reference Tables
- Appendix G – Manufacturing & Facility Database
- Appendix H – Import-Export Data Tables
- Appendix I – Regulatory Summary Tables
- Appendix J – Primary Research Participant List (Anonymized)
- Appendix K – Primary Research Questionnaire Framework
- Appendix L – Data Sources & Bibliography
- Appendix M – Market Size Divergence & Source Comparison
Chapter 17. Research Methodology
- 17.1 Research Framework & Philosophy
- 17.2 Secondary Research – Sources, Hierarchy & Data Extraction
- 17.3 Data Modeling – Bottom-Up & Top-Down Market Sizing
- 17.4 Primary Research – Stakeholder Framework, LOI & Sample Sizes
- 17.5 Forecast Methodology – Regression, Scenario & Sensitivity Analysis
- 17.6 Quality Control – Four-Layer Validation Framework
- 17.7 Limitations & Standard Assumptions
- 17.8 Disclaimer
