Market Overview
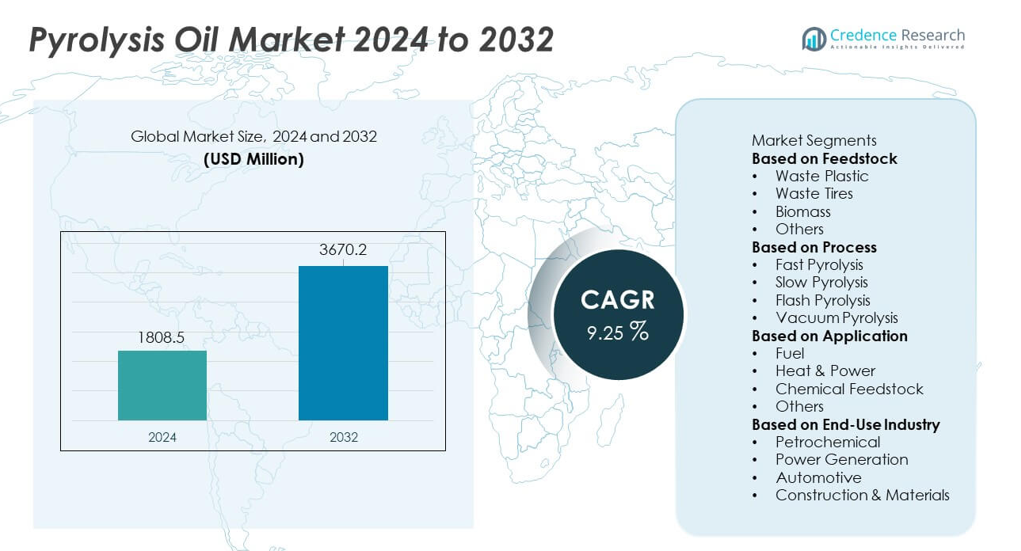
Pyrolysis Oil market size reached USD 1,808.5 million in 2024 and is expected to grow to USD 3,670.2 million by 2032, reflecting a CAGR of 9.25% during the forecast period.
| REPORT ATTRIBUTE |
DETAILS |
| Historical Period |
2020-2023 |
| Base Year |
2024 |
| Forecast Period |
2025-2032 |
| Pyrolysis Oil Market Size 2024 |
USD 1,808.5 million |
| Pyrolysis Oil Market, CAGR |
9.25% |
| Pyrolysis Oil Market Size 2032 |
USD 3,670.2 million |
The Pyrolysis Oil market includes key players such as Agilyx Corporation, Plastic Energy, Nexus Circular, Pyrolyx Group, Alterra Energy, ENVIRChem Technologies, GIDARA Energy, Quantafuel ASA, Klean Industries, and Vadxx Energy, all of whom focus on scaling chemical recycling and upgrading technologies to support circular fuel and feedstock production. These companies expand capacity, secure long-term waste supply agreements, and collaborate with petrochemical firms to enhance refinery integration. North America leads the market with a 38% share, supported by strong investment in waste-to-fuel projects, while Europe follows with a 32% share, driven by strict recycling mandates and advanced chemical recovery infrastructure.
Market Insights
- The Pyrolysis Oil market reached USD 1,808.5 million in 2024 and will grow at a 9.25% CAGR through 2032, supported by rising demand for cleaner industrial fuels.
- Strong market drivers include the expansion of chemical recycling, where the Waste Plastic segment leads with a 46% share, supported by large feedstock availability and circular economy policies.
- Key trends highlight the rapid adoption of upgraded and drop-in fuel applications, while fast pyrolysis dominates the process segment with a 52% share due to higher liquid yields and better efficiency.
- Competitive activity increases as players scale capacity and form partnerships with waste-management and petrochemical companies, though the market faces restraints from high capital costs and variable oil quality.
- Regionally, North America leads with 38%, followed by Europe at 32%, while Asia Pacific holds 24%, driven by rising industrial fuel demand and strong investment in waste-to-fuel projects.
Access crucial information at unmatched prices!
Request your sample report today & start making informed decisions powered by Credence Research Inc.!
Download Sample
Market Segmentation Analysis:
By Feedstock
Waste Plastic leads this segment with a 46% share, driven by rising plastic waste volumes and strong adoption of chemical recycling technologies that convert mixed polymers into high-value pyrolysis oil. Industries prefer this feedstock due to higher oil yield and consistent quality. Waste Tires follow with demand supported by tire-derived fuel recovery and circular rubber initiatives. Biomass contributes to renewable fuel production in regions promoting bio-based alternatives. Other feedstocks gain traction where strict waste-management rules push diversified recycling streams. The segment expands as recyclers invest in cleaner preprocessing systems and automated sorting technologies.
- For instance, the Agilyx/AmSty joint venture facility (Regenyx) in Oregon processed approximately 3,000 to 4,400 metric tons of polystyrene waste in total over its entire five-year operational history before closing in April 2024 due to financial losses.
By Process
Fast Pyrolysis dominates the process segment with a 52% share, supported by its ability to deliver higher liquid yields and stable output suitable for refinery integration. Industrial operators choose this process due to faster reaction times and better thermal efficiency. Slow Pyrolysis grows in applications focused on producing char and gaseous byproducts. Flash Pyrolysis advances through research-driven setups that require rapid heating rates. Vacuum Pyrolysis remains limited to specialized recovery systems. The segment gains momentum as companies invest in high-performance reactors, continuous production lines, and energy-efficient heat transfer technologies.
- For instance, GIDARA Energy’s Amsterdam facility is planned to convert approximately 175,000 tons of non-recyclable waste feedstock yearly using commercially proven High-Temperature Winkler (HTW®) gasification technology.
By Application
Fuel remains the largest application segment with a 58% share, driven by strong demand from industrial boilers, furnaces, and decentralized power systems seeking low-emission alternatives. Companies prefer pyrolysis oil due to lower sulfur content and cleaner combustion. Heat & Power grows as utilities explore renewable liquid fuels for hybrid and off-grid systems. Chemical Feedstock usage rises as refiners upgrade pyrolysis oil into aromatics and synthetic intermediates. Other applications progress in niche markets. The segment expands as industries aim to reduce fossil fuel dependence and align operations with decarbonization and sustainability goals.
Key Growth Drivers
Growing Adoption of Chemical Recycling Technologies
Chemical recycling expands as industries convert complex waste streams into high-quality pyrolysis oil through advanced depolymerization and catalytic upgrading systems. Companies improve yield, reduce impurities, and enhance compatibility with downstream refinery processes. Governments support this progress through policies that reduce landfill use and promote circular resource recovery. Manufacturers invest in integrated facilities that combine sorting, preprocessing, and continuous pyrolysis to boost output reliability. This driver accelerates market growth as industries prioritize waste valorization and sustainable low-carbon fuel alternatives across global markets.
- For instance, Plastic Energy operates two commercial plants in Spain that have been processing approximately 5,000 tons of plastic waste each year since 2015 and 2017 using its TAC recycling technology.
Rising Demand for Low-Emission Industrial Fuels
Industries increasingly use pyrolysis oil as a cleaner substitute for heavy fuel oils due to strict emission-control rules. The lower sulfur content and reduced particulate generation support its deployment in boilers, furnaces, and off-grid systems. Companies adopt pyrolysis oil to advance decarbonization without modifying existing combustion infrastructure. Renewable fuel mandates across many economies further encourage adoption. Interest in hybrid power systems, where pyrolysis oil manages peak load demand, strengthens market momentum. This growth driver positions pyrolysis oil as a practical transition fuel within cleaner industrial energy frameworks.
- For instance, companies in the chemical recycling industry are involved in the production and purification of pyrolysis oil for industrial applications. One company, APChemi, launched its PUREMAX™ Pyrolysis Oil Purification Plant in August 2024 to produce a high-quality purified pyrolysis oil, PUROIL™, which seamlessly blends with crude oil or naphtha for the production of circular plastics in existing refineries.
Expansion of Integrated Waste-to-Energy Projects
Waste-to-energy initiatives gain momentum as cities and industries address rising waste volumes through fuel recovery systems. Developers deploy continuous pyrolysis reactors, sorting units, and refining systems to produce stable-grade oil for local industries. Public-private partnerships support project development through funding incentives and long-term supply agreements. Decentralized conversion units also gain traction in remote locations lacking centralized waste management. This driver grows stronger as governments adopt policies focused on circular infrastructure and sustainable resource utilization, positioning pyrolysis oil as a key output from modern waste-to-energy systems.
Key Trends & Opportunities
Growth of Upgraded and Drop-In Fuel Applications
Upgraded pyrolysis oil gains attention as refiners adopt hydrotreating and catalytic upgrading systems to create drop-in fuels compatible with existing engines and industrial equipment. Enhanced stability, reduced oxygen content, and higher energy density expand the range of end-use applications. Transportation, maritime, and heavy-duty machinery segments explore these fuels to meet carbon-reduction goals. Research collaborations improve refining pathways and support commercial scalability. This trend boosts the market by enabling pyrolysis oil to transition from a niche industrial fuel to a viable alternative within mainstream energy systems.
- For instance, Shell partnered with Pryme to process 40,000 tons of advanced pyrolysis oil per year at the Rotterdam facility using its hydroprocessing units.
Opportunity in Circular Plastics and Tire Recycling Initiatives
Circular economy targets accelerate investment in plastic and tire recycling, where pyrolysis oil plays a vital role in converting mixed or hard-to-recycle materials into valuable fuel and feedstock. Chemical manufacturers incorporate pyrolysis oil into cracker units to produce virgin-grade polymers, supporting closed-loop production. Tire recyclers adopt advanced reactors that generate cleaner oil fractions and higher-value carbon black. Regulatory pressure on waste disposal strengthens adoption. This opportunity expands as global brands commit to recycled-content targets and sustainable material recovery strategies.
- For instance, Bridgestone’s new pilot demonstration recycling plant at its Seki Plant in Japan is set to begin operations in September 2027 and will process approximately 7,500 tonnes of end-of-life tires annually using precise pyrolysis.
Key Challenges
Quality Variability and Upgrading Limitations
Pyrolysis oil faces challenges from inconsistent composition, viscosity, and oxygen content, which affect compatibility with refining and combustion systems. These variations create performance risks for industries that demand stable-grade fuels. Upgrading systems help improve quality but require significant investment and technical expertise. Storage stability issues also limit large-scale distribution potential. Differences in feedstock types and reactor designs make standardization difficult. This challenge persists until the industry adopts tighter product specifications and more advanced upgrading technologies.
High Capital Costs and Limited Infrastructure Support
Commercial pyrolysis plants require major investment in reactors, pollution-control equipment, preprocessing units, and upgrading facilities. Many regions lack structured waste-collection systems and reliable feedstock supply networks, slowing project development. Smaller companies struggle to secure financing without long-term feedstock or fuel-offtake contracts. Regulatory processes, permitting delays, and compliance requirements add complexity. Limited distribution infrastructure for pyrolysis oil further restricts market expansion. This challenge affects developing regions the most, where infrastructure gaps hinder large-scale waste-to-fuel deployment.
Regional Analysis
North America
North America leads the Pyrolysis Oil market with a 38% share, driven by strong investment in chemical recycling and advanced waste-to-fuel technologies. The region benefits from strict landfill regulations and corporate sustainability commitments that support large-scale pyrolysis plants. Energy-intensive industries adopt pyrolysis oil as a cleaner fuel for boilers and industrial systems. The United States advances refinery integration projects that upgrade pyrolysis oil into higher-value fuels and chemical feedstock. Canada supports growth through federal waste-reduction programs and incentives for circular economy projects. These factors strengthen regional dominance and encourage continuous technology upgrades.
Europe
Europe holds a 32% share, supported by strict waste-management laws and ambitious circular economy targets. Countries adopt pyrolysis technologies to address rising plastic waste and reduce reliance on fossil-based chemicals. Refiners integrate pyrolysis oil into cracker units to produce recycled polymers. The region benefits from strong policy support for low-carbon fuels, particularly in industrial and maritime sectors. Germany, the Netherlands, and the Nordic countries lead project deployment with advanced pilot plants and commercial facilities. High focus on decarbonization and extended producer responsibility rules further drive investment in modern pyrolysis systems across the region.
Asia Pacific
Asia Pacific accounts for a 24% share, driven by rapid industrialization and high plastic waste generation. Countries invest in pyrolysis plants to manage growing municipal waste streams and produce alternative fuels. China and Japan lead technology adoption with advanced reactors and upgraded refining pathways. India expands deployment through public-private partnerships aimed at reducing landfill pressure. Strong demand for industrial fuels and chemical feedstock boosts market growth across manufacturing hubs. Increasing environmental regulations and rising sustainability awareness also support long-term expansion. The region emerges as a key growth center due to large feedstock availability.
Latin America
Latin America holds a 4% share, supported by early-stage adoption of waste-to-fuel systems and rising interest in circular resource recovery. Countries deploy pyrolysis projects to address urban waste challenges and support industrial fuel needs. Brazil and Mexico lead with pilot plants focused on plastic and tire recycling. Government incentives for renewable fuels and emission reduction assist gradual market growth. Limited large-scale infrastructure remains a challenge, but growing private investment improves deployment rates. Expanding industrial demand for cleaner fuels strengthens the region’s future potential as technology adoption increases.
Middle East & Africa
The Middle East & Africa region holds a 2% share, driven by early efforts to diversify energy sources and improve waste-management systems. Countries explore pyrolysis technologies to convert plastic and tire waste into usable fuel for industrial applications. The United Arab Emirates and South Africa lead adoption with focused recycling initiatives. Energy producers test pyrolysis oil as a supplemental fuel to reduce emissions in industrial sites. Infrastructure gaps slow rapid expansion, yet rising sustainability programs create long-term potential. Growing interest in advanced recycling technologies supports gradual market development across the region.
Market Segmentations:
By Feedstock
- Waste Plastic
- Waste Tires
- Biomass
- Others
By Process
- Fast Pyrolysis
- Slow Pyrolysis
- Flash Pyrolysis
- Vacuum Pyrolysis
By Application
- Fuel
- Heat & Power
- Chemical Feedstock
- Others
By End-Use Industry
- Petrochemical
- Power Generation
- Automotive
- Construction & Materials
By Geography
- North America
- Europe
- Germany
- France
- U.K.
- Italy
- Spain
- Rest of Europe
- Asia Pacific
- China
- Japan
- India
- South Korea
- South-east Asia
- Rest of Asia Pacific
- Latin America
- Brazil
- Argentina
- Rest of Latin America
- Middle East & Africa
- GCC Countries
- South Africa
- Rest of the Middle East and Africa
Competitive Landscape
The competitive landscape features major companies such as Agilyx Corporation, Plastic Energy, Nexus Circular, Pyrolyx Group, Alterra Energy, ENVIRChem Technologies, GIDARA Energy, Quantafuel ASA, Klean Industries, and Vadxx Energy. These companies strengthen the market through capacity expansions, advanced reactor designs, and investments in high-yield chemical recycling systems. Many players focus on upgrading technologies that improve oil purity and stability, enabling better integration with refineries and chemical plants. Strategic partnerships with waste-management firms secure consistent feedstock supply, while collaborations with petrochemical companies support large-scale commercialization. Several competitors develop modular pyrolysis units to reduce installation costs and serve decentralized locations. Growing project pipelines across North America, Europe, and Asia Pacific highlight strong industry momentum as companies seek to scale operations, enhance process efficiency, and meet rising demand for circular, low-carbon fuel solutions within the global energy and materials sectors.
Shape Your Report to Specific Countries or Regions & Enjoy 30% Off!
Key Player Analysis
Recent Developments
- In September 2025, Greenfield Global (UK) launched a new entity aimed at expanding its distribution network for high-purity alcohols and specialty solvents in Europe.
- In August 2025, a joint venture plant with SABIC in Geleen, the Netherlands, produced its first batch of recycled oil (TACOIL) from hard-to-recycle plastic waste.
Report Coverage
The research report offers an in-depth analysis based on Feedstock, Process, Application, End-Use Industry and Geography. It details leading market players, providing an overview of their business, product offerings, investments, revenue streams, and key applications. Additionally, the report includes insights into the competitive environment, SWOT analysis, current market trends, as well as the primary drivers and constraints. Furthermore, it discusses various factors that have driven market expansion in recent years. The report also explores market dynamics, regulatory scenarios, and technological advancements that are shaping the industry. It assesses the impact of external factors and global economic changes on market growth. Lastly, it provides strategic recommendations for new entrants and established companies to navigate the complexities of the market.
Future Outlook
- Demand for upgraded and refined pyrolysis oil will rise as industries shift toward low-carbon fuels.
- Chemical recycling capacity will expand as global brands increase commitments to circular plastic goals.
- Advanced reactor systems will improve oil yield and consistency, supporting wider industrial adoption.
- Integration with refinery and petrochemical units will strengthen as upgrading technologies mature.
- Partnerships between waste-management firms and energy producers will accelerate project development.
- Decentralized and modular pyrolysis units will gain traction in regions with limited infrastructure.
- Regulatory pressure on plastic and tire waste will drive large-scale investment in pyrolysis projects.
- Transportation and maritime sectors will explore drop-in fuels produced from upgraded pyrolysis oil.
- Countries will adopt stronger sustainability policies that support long-term growth in waste-to-fuel systems.
- Advancements in feedstock preprocessing and impurity reduction will enhance product quality and market stability.


