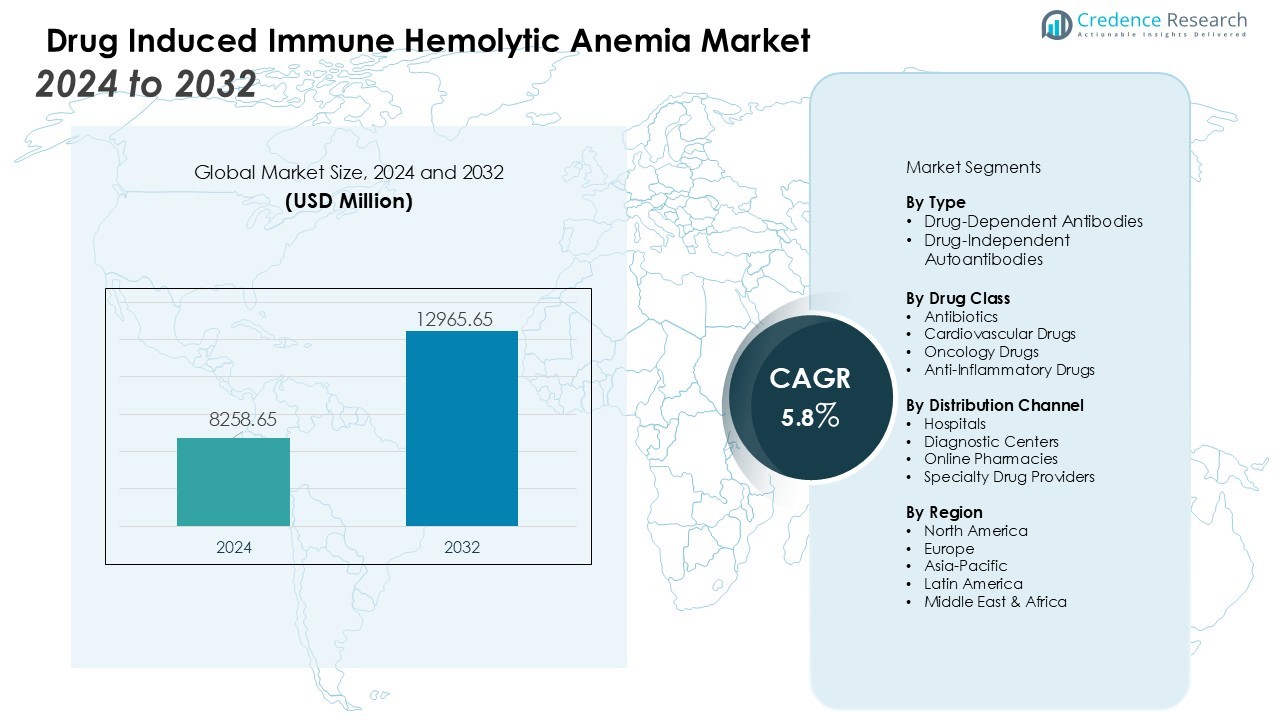
Home » Healthcare » Pharmaceuticals » Drug-Induced Immune Hemolytic Anemia Market

Drug-Induced Immune Hemolytic Anemia Market By Drug Type (Cephalosporins, Quinidine, Levodopa, Methyldopa, Penicillin and its derivatives, Methyldopa, Nitrofurantoin, Phenazopyridine (pyridium), Levofloxacin, Dapsone) By End User (Clinical Laboratories, Hospitals)-Growth, Future Prospects & Competitive Analysis, 2016 – 2030

Price: $4999

Published: | Report ID: 18209 | Report Format : PDF

Key Highlights of the Report

The global drug-induced immune hemolytic anemia market is segmented by drug type, end user, and region. The levodopa drug type is the most popular, while cephalosporins and methyldopa are the two primary drug type segments. Clinical Laboratories are the most common end user, with Europe leading the market growth.

The global drug-induced immune hemolytic anemia market has several drivers, including growing use of various drugs and medications across the healthcare industry, drug development & innovation. Additionally, the aging population worldwide is a significant demographic factor driving the growth of the drug-induced immune hemolytic anemia. However, the market also faces significant challenges, the complex nature of immune hemolytic reactions & absence of standardized diagnostic criteria for drug-induced immune hemolytic anemia, which can impact consumer spending.

Nonetheless, the global drug-induced immune hemolytic anemia market offers significant growth opportunities, including development of advanced diagnostic technologies in the European region. Moreover, strengthening pharmacovigilance systems and enhancing adverse event monitoring can significantly benefit the global drug-induced immune hemolytic anemia industry.

Market Overview

The global Drug-induced immune hemolytic anemia market has witnessed steady growth in recent years and is expected to continue growing at a CAGR of 5.90% between 2023 and 2030. The market was valued at USD 7.1 billion in 2022 and is expected to reach USD 10.60 billion in 2030.

Design Element 2

Access crucial information at unmatched prices!

Request your free sample report today & start making informed decisions powered by Credence Research!

Download Free Sample
CTA Design Element 3

What Are the Main Drivers Of The Global Drug-induced immune hemolytic anemia Market?

Several factors, including the growing use of various drugs and medications across the healthcare industry & drug development and innovation drive the global Drug-induced immune hemolytic anemia market.

What Are the Major Challenges Faced by The Global Drug-induced immune hemolytic anemia Market?

The global Drug-induced immune hemolytic anemia market also faces several challenges, including the complex nature of immune hemolytic reactions & absence of standardized diagnostic criteria for drug-induced immune hemolytic anemia.

What Are the Growth Opportunities in The Global Drug-induced immune hemolytic anemia Market?

The global Drug-induced immune hemolytic anemia market offers significant growth opportunities, including the development of advanced diagnostic technologies presents and education & training programs strive towards safer medication practices and improved patient outcomes.

Executive Summary

Overview of the Global Drug-induced immune hemolytic anemia Market

The global Drug-induced immune hemolytic anemia market has been steadily growing in recent years due to the widespread use of various medications across different therapeutic areas. Continuous advancements in drug development, and innovation led to the introduction of new medications into the market. The market is characterized by a wide range of equipment, designs, and sizes, catering to diverse consumer preferences.

Market Definition

The global drug-induced immune hemolytic anemia market includes diagnostic tests, treatment modalities, and therapeutic interventions for immune-mediated hemolytic anemia caused by drug-induced immunological responses. Drug-induced immunological hemolytic anemia occurs when certain drugs cause an immune response that results in the loss of red blood cells. It includes several healthcare sectors, such as pharmaceuticals, diagnostics, and research, with an emphasis on the discovery, commercialization, and use of medications, diagnostic tools, and treatment techniques for drug-induced immune hemolytic anemia.

Market Insights

  • The global demand for Drug-induced immune hemolytic anemia was valued at USD 7.1 Billion in 2022 and is expected to reach USD 10.60 Billion in 2030, growing at a CAGR of 5.90% between 2023 and 2030.
  • levodopa drug type is the leading segment and held around half of share in terms of value in 2022, while the cephalosporins segment is likely to exhibit the fastest CAGR during the forecast period.
  • The Clinical Laboratories is expected to post the highest CAGR during the forecast period & leading the market share with more than 25% share in 2022.
  • Europe is fueling the growth of the Drug-induced immune hemolytic anemia industry with nearly two-fifth share in 2022, while North America and Asia-pacific collectively account for just nearly under 55% share in 2022. Asia-pacific held over 22% share in 2022.
  • The growing use of various drugs and medications across the healthcare industry & drug development and innovation are the major drivers of the market. At the same time, the lack of awareness and underdiagnosis of the condition is the main restraints.
  • The huge growth potential in the European region and the development of advanced diagnostic technologies present education and training programs focused on drug-induced immune hemolytic anemia play a pivotal role in improving patient care & outcomes as the major opportunities in the market.

Segmentation by Drug Type

  • Levodopa drug type is the leading segment and held around half a share in value in 2022.
  • The cephalosporins and methyldopa will likely exhibit the fastest CAGR during the forecast period.

Segmentation by End User

  • The Clinical Laboratories segment governs the demand for Drug-induced immune hemolytic anemia in the world, holding a massive share, and is also expected to grow at a rapid CAGR.
  • The hospital segment contributes the rest to the demand for Drug-induced immune hemolytic anemia.

Segmentation by Region

  • Europe was fueling the growth of the Drug-induced immune hemolytic anemia industry with a nearly two-fifths share in 2022.
  • North America and Asia-pacific collectively account for nearly under 55% share in 2022, with Asia-pacific holding over 22% share in the same year.
  • The rest of the world, including Latin America, The Middle East, and Africa, contributes the remainder to the demand for Drug-induced immune hemolytic anemia.

The increasing demand for drug-induced immune hemolytic anemia can be attributed to the widespread use of various medications across different therapeutic areas, continuous advancements in drug development & innovation. However, the market is restrained by the complexity and risks associated with venous stenting procedures.

Germany is well-known for its sophisticated healthcare system and infrastructure, which includes cutting-edge medical facilities, specialized laboratories, and a strong emphasis on patient care. It allows for the accurate diagnosis, treatment, and management of a wide range of medical disorders, including drug-induced immunological hemolytic anemia. Specialized laboratories with improved diagnostic technology are critical in finding and validating cases of drug-induced immune hemolytic anemia. Its laboratories are able to perform direct antiglobulin tests (DAT), antibody screening, and other hematological studies required to diagnose immune-mediated hemolytic anemia.

The US has a strong presence in pharmaceutical research and development institutions. The existence of academic institutions, research centers, and pharmaceutical businesses encourages innovation and accelerates the growth of the sector detecting immune-mediated hemolytic anemia. Ongoing research efforts aid in the identification of new drugs related to the diagnosis of immune-mediated hemolytic anemia, as well as the development of improved diagnostic tools and treatment alternatives.

Overall, the increasing demand for Drug-induced immune hemolytic anemia can be attributed to the growing use of various drugs and medications across the healthcare industry & drug development and innovation.

While the drug-induced immune hemolytic anemia market is growing, it faces challenges such as the complex nature of immune hemolytic reactions & absence of standardized diagnostic criteria for drug-induced immune hemolytic anemia.

Drug-induced immune hemolytic anemia Market

Increasing Prescription of Medications

The increasing usage of numerous treatments and medications in the healthcare business is a major contributor to drug-induced immunological hemolytic anemia. The potential risk of developing drug-induced immunological hemolytic anemia rises as more people are prescribed various medications for various medical illnesses.

Another reason promoting the prevalence of drug-induced immune hemolytic anemia is the world’s aging population. Older people have a larger burden of chronic diseases and, as a result, are more likely to be prescribed many medications. This population’s increasing drug exposure raises the chance of developing drug-induced immunological hemolytic anemia.

Drug Development and Innovation

The introduction of new drugs to the market is facilitated by improvements in drug development and innovation. Despite the possibility that these medications will improve treatment outcomes, they also run the risk of having the adverse consequence of immunological hemolytic anemia. Drug-induced immune hemolytic anemia is more common due to the ongoing development of innovative medications.

Additionally, a person’s susceptibility to drug-induced immune hemolytic anemia is significantly influenced by genetic variables. Some people may be more susceptible to having immunological reactions against particular medications due to certain genetic differences. Our understanding of this disorder is improved, and the genetic factor that contributes to its occurrence is highlighted by the discovery of genetic markers linked to drug-induced immune hemolytic anemia risk.

Lack of Awareness and Underdiagnosis

The underdiagnosis and lack of knowledge of drug-induced immunological hemolytic anemia can have major consequences for those who are affected. The advancement of anemia, worsening symptoms, and potential complications, including organ damage or life-threatening situations necessitating emergency treatments, can all occur as a result of delayed diagnosis and delayed commencement of the proper treatment. Misdiagnosis can also result in pointless tests or treatments that target unrelated disorders, which is stressful for the patient and raises healthcare expenditures.

Additionally, incorporating thorough instruction and training about drug-induced immune hemolytic anemia into medical curricula and CME programs helps raise awareness among medical professionals. The understanding and detection of drug-induced immune hemolytic anemia can be improved by case studies, interactive seminars, and information dissemination through professional medical organizations.

Advancements in Diagnostic Technologies

Significant potential for the drug-induced immune hemolytic anemia business has emerged with the development of cutting-edge diagnostic technology. Healthcare practitioners can more accurately identify and characterize drug-induced immune reactions, improving early identification and intervention, by using improved laboratory techniques, such as high-throughput screening methods and molecular testing. By enabling the speedy and precise processing of a huge number of samples, high-throughput screening techniques have completely changed the diagnostics industry. These technologies, including enzyme-linked immunosorbent assays (ELISA), flow cytometry, and multiplex immunoassays, are able to identify and quantify particular antibodies or immunological markers connected to drug-induced immune hemolytic anemia.

Competitive Landscape

Key Players

The global Drug-induced immune hemolytic anemia market is highly competitive, with the presence of several key players. Some of the major players in the market and their market share are as follows:

  • ARUP Laboratories
  • Cyprotex
  • Creative Biolabs
  • Machaon diagnostics
  • F. Hoffmann-La Roche Ltd.
  • Baxter International Inc.
  • Pfizer Inc
  • Zydus Cadila
  • Amneal Pharmaceuticals Inc
  • Incycte Corp

These companies focus on product innovation, expanding their applications, mergers, and acquisitions to stay ahead in the market. The major players in the global Drug-induced immune hemolytic anemia market are constantly striving to stay ahead by introducing new products and innovations.

In 2022, The U.S. Food and Drug Administration (FDA) announced the approval of Enjaymo (sutimlimab-jome). It decreases red blood cell transfusion requirement due to hemolysis in adults with cold agglutinin disease (CAD). Enjaymo is the first as well as only approved treatment for people with CAD and functions by inhibiting the destruction of red blood cells (hemolysis).

Shape Your Report to Specific Countries or Regions & Enjoy 30% Off!

Summary of Key Findings

  • Growing use of various drugs and medications across the healthcare industry & drug development and innovation driving market growth
  • Market segmented by Drug Type, End User, and region.
  • levodopa drug type is the most popular, with cephalosporins and methyldopa as primary user segments.
  • Clinical Laboratories are the most common end-user.
  • Europe is leading market growth; the market is highly competitive with key players including Creative Biolabs, Baxter International Inc., Pfizer Inc, Amneal Pharmaceuticals Inc and others.

Future Outlook

  • Positive outlook for the global drug-induced immune hemolytic anemia market with significant growth potential in the Europe region
  • Growing use of various drugs and medications across the healthcare industry drive growth
  • Challenges like the complex nature of immune hemolytic reactions & absence of standardized diagnostic criteria for drug-induced immune hemolytic anemia. Key players to focus on product innovation, expanding market reach, and maintaining competitive pricing to stay ahead in the market.

Segmentation

  • By Drug Type
    • Cephalosporins
    • Quinidine
    • Levodopa
    • Methyldopa
    • Penicillin and its derivatives
    • Methyldopa
    • Nitrofurantoin
    • Phenazopyridine (pyridium)
    • Levofloxacin
    • Dapsone
  • By End User
    • Clinical Laboratories
    • Hospitals
  • By Region
  • North America
    • The US.
    • Canada
    • Mexico
  • Europe
    • Germany
    • France
    • The U.K.
    • Italy
    • Spain
    • Rest of Europe
  • Asia Pacific
    • China
    • Japan
    • India
    • South Korea
    • South-east Asia
    • Rest of Asia Pacific
  • Latin America
    • Brazil
    • Argentina
    • Rest of Latin America
  • Middle East & Africa
    • GCC Countries
    • South Africa
    • Rest of the Middle East and Africa

1. Preface
1.1. Report Description
1.1.1. Purpose of the Report
1.1.2. Target Audience
1.1.3. USP and Key Offerings
1.2. Research Scope
1.3. Research Methodology
1.3.1. Phase I – Secondary Research
1.3.2. Phase II – Data Modelling
1.3.2.1. Company Share Analysis Model
1.3.2.2. Revenue Based Modelling
1.3.3. Phase III – Primary Research
1.3.4. Research Limitations
1.3.5. Assumptions
1.4. Market Introduction
1.5. Market Research Scope

2. Executive Summary
2.1. Market Snapshot: Global Drug-Induced Immune Hemolytic Anemia Market
2.2. Global Drug-Induced Immune Hemolytic Anemia Market, By Drug Type
2.3. Global Drug-Induced Immune Hemolytic Anemia Market, By End User
2.4. Global Drug-Induced Immune Hemolytic Anemia Market, By Region

3. Market Dynamics & Factors Analysis
3.1. Introduction
3.1.1. Global Drug-Induced Immune Hemolytic Anemia Market Value, 2017-2030, (US$ Bn)
3.1.2. Y-o-Y Growth Trend Analysis
3.2. Market Dynamics
3.2.1. Market Drivers
3.2.1.1. Driver 1
3.2.1.2. Driver 2
3.2.1.3. Driver 3
3.2.2. Market Restraints
3.2.2.1. Restraint 1
3.2.2.2. Restraint 2
3.2.3. Market Opportunities
3.2.3.1. Opportunity 1
3.2.3.2. Opportunity 2
3.2.4. Major Industry Challenges
3.2.4.1. Challenge 1
3.2.4.2. Challenge 2
3.3. Growth and Development Patterns
3.4. Investment Feasibility Analysis
3.5. Market Opportunity Analysis
3.5.1. Drug Type
3.5.2. End User
3.5.3. Geography

4. Premium Insights
4.1. STAR (Situation, Task, Action, Results) Analysis
4.2. Porter’s Five Forces Analysis
4.2.1. Threat of New Entrants
4.2.2. Bargaining Power of Buyers/Consumers
4.2.3. Bargaining Power of Suppliers
4.2.4. Threat of Substitute Types
4.2.5. Intensity of Competitive Rivalry
4.3. Key Market Trends
4.3.1. Demand Side Trends
4.3.2. Supply Side Trends
4.4. Value Chain Analysis
4.5. Technology Analysis
4.6. Analysis and Recommendations
4.7. Marketing Strategy Analysis
4.7.1. Direct Marketing
4.7.2. Indirect Marketing
4.7.3. Marketing Channel Development Trend

5. Market Positioning of Key Players, 2022
5.1. Company market share of key players, 2022
5.2. Competitive Benchmarking
5.3. Market Positioning of Key Vendors
5.4. Geographical Presence Analysis
5.5. Major Strategies Adopted by Key Players
5.5.1. Key Strategies Analysis
5.5.2. Mergers and Acquisitions
5.5.3. Partnerships
5.5.4. Product Launch
5.5.5. Geographical Expansion
5.5.6. Others

6. Economic Impact Analysis
6.1. Recession Impact
6.1.1. North America
6.1.2. Europe
6.1.3. Asia Pacific
6.1.4. Latin America
6.1.5. Middle East and Africa
6.2. Ukraine-Russia War Impact
6.2.1. North America
6.2.2. Europe
6.2.3. Asia Pacific
6.2.4. Latin America
6.2.5. Middle East and Africa
6.3. COVID-19 Impact Analysis
6.3.1. North America
6.3.2. Europe
6.3.3. Asia Pacific
6.3.4. Latin America
6.3.5. Middle East and Africa

7. Global Drug-Induced Immune Hemolytic Anemia Market, By Drug Type
7.1. Global Drug-Induced Immune Hemolytic Anemia Market Overview, by Drug Type
7.1.1. Global Drug-Induced Immune Hemolytic Anemia Market Revenue Share, By Drug Type, 2022 Vs 2030 (in %)
7.2. Cephalosporins
7.2.1. Global Drug-Induced Immune Hemolytic Anemia Market, By Region, 2017-2030 (US$ Bn)
7.3. Quinidine
7.3.1. Global Drug-Induced Immune Hemolytic Anemia Market, By Region, 2017-2030 (US$ Bn)
7.4. Levodopa
7.4.1. Global Drug-Induced Immune Hemolytic Anemia Market, By Region, 2017-2030 (US$ Bn)
7.5. Methyldopa
7.5.1. Global Drug-Induced Immune Hemolytic Anemia Market, By Region, 2017-2030 (US$ Bn)
7.6. Penicillin and its derivatives
7.6.1. Global Drug-Induced Immune Hemolytic Anemia Market, By Region, 2017-2030 (US$ Bn)
7.7. Nitrofurantoin
7.7.1. Global Drug-Induced Immune Hemolytic Anemia Market, By Region, 2017-2030 (US$ Bn)
7.8. Phenazopyridine (pyridium)
7.8.1. Global Drug-Induced Immune Hemolytic Anemia Market, By Region, 2017-2030 (US$ Bn)
7.9. Levofloxacin
7.9.1. Global Drug-Induced Immune Hemolytic Anemia Market, By Region, 2017-2030 (US$ Bn)
7.10. Dapsone
7.10.1. Global Drug-Induced Immune Hemolytic Anemia Market, By Region, 2017-2030 (US$ Bn)

8. Global Drug-Induced Immune Hemolytic Anemia Market, By End User
8.1. Global Drug-Induced Immune Hemolytic Anemia Market Overview, by End User
8.1.1. Global Drug-Induced Immune Hemolytic Anemia Market, By End User, 2022 vs 2030 (in %)
8.2. Clinical Laboratories
8.2.1. Global Drug-Induced Immune Hemolytic Anemia Market, By Region, 2017-2030 (US$ Bn)
8.3. Hospitals
8.3.1. Global Drug-Induced Immune Hemolytic Anemia Market, By Region, 2017-2030 (US$ Bn)

9. Global Drug-Induced Immune Hemolytic Anemia Market, By Region
9.1. Global Drug-Induced Immune Hemolytic Anemia Market Overview, by Region
9.1.1. Global Drug-Induced Immune Hemolytic Anemia Market, By Region, 2022 vs 2030 (in%)
9.2. Drug Type
9.2.1. Global Drug-Induced Immune Hemolytic Anemia Market, By Drug Type, 2017-2030 (US$ Bn)
9.3. End User
9.3.1. Global Drug-Induced Immune Hemolytic Anemia Market, By End User, 2017-2030 (US$ Bn)

10. North America Drug-Induced Immune Hemolytic Anemia Market Analysis
10.1. North America Drug-Induced Immune Hemolytic Anemia Market, by Drug Type, 2017-2030(US$ Bn)
10.1.1. Overview
10.1.2. SRC Analysis
10.2. North America Drug-Induced Immune Hemolytic Anemia Market, by End User, 2017-2030(US$ Bn)
10.2.1. Overview
10.2.2. SRC Analysis
10.3. North America Drug-Induced Immune Hemolytic Anemia Market, by Country, 2017-2030 (US$ Bn)
10.3.1. North America Drug-Induced Immune Hemolytic Anemia Market, by Country, 2022 Vs 2030 (in%)
10.3.2. U.S.
10.3.2.1. U.S. Drug-Induced Immune Hemolytic Anemia Market Estimates and Forecast, 2017-2030 (US$ Bn)
10.3.2.2. U.S. Drug-Induced Immune Hemolytic Anemia, By Drug Type, 2017-2030 (US$ Bn)
10.3.2.3. U.S. Drug-Induced Immune Hemolytic Anemia, By End User, 2017-2030 (US$ Bn)
10.3.3. Canada
10.3.3.1. Canada Drug-Induced Immune Hemolytic Anemia Market Estimates and Forecast, 2017-2030 (US$ Bn)
10.3.3.2. Canada Drug-Induced Immune Hemolytic Anemia, By Drug Type, 2017-2030 (US$ Bn)
10.3.3.3. Canada Drug-Induced Immune Hemolytic Anemia, By End User, 2017-2030 (US$ Bn)
10.3.4. Mexico
10.3.4.1. Mexico Drug-Induced Immune Hemolytic Anemia Market Estimates and Forecast, 2017-2030 (US$ Bn)
10.3.4.2. Mexico Drug-Induced Immune Hemolytic Anemia, By Drug Type, 2017-2030 (US$ Bn)
10.3.4.3. Mexico Drug-Induced Immune Hemolytic Anemia, By End User, 2017-2030 (US$ Bn)

11. Europe Drug-Induced Immune Hemolytic Anemia Market Analysis
11.1. Europe Drug-Induced Immune Hemolytic Anemia Market, by Drug Type, 2017-2030(US$ Bn)
11.1.1. Overview
11.1.2. SRC Analysis
11.2. Europe Drug-Induced Immune Hemolytic Anemia Market, by End User, 2017-2030(US$ Bn)
11.2.1. Overview
11.2.2. SRC Analysis
11.3. Europe Drug-Induced Immune Hemolytic Anemia Market, by Country, 2017-2030 (US$ Bn)
11.3.1. Europe Drug-Induced Immune Hemolytic Anemia Market, by Country, 2022 Vs 2030 (in%)
11.3.2. Germany
11.3.2.1. Germany Drug-Induced Immune Hemolytic Anemia Market Estimates and Forecast, 2017-2030 (US$ Bn)
11.3.2.2. Germany Drug-Induced Immune Hemolytic Anemia, By Drug Type, 2017-2030 (US$ Bn)
11.3.2.3. Germany Drug-Induced Immune Hemolytic Anemia, By End User, 2017-2030 (US$ Bn)
11.3.3. France
11.3.3.1. France Drug-Induced Immune Hemolytic Anemia Market Estimates and Forecast, 2017-2030 (US$ Bn)
11.3.3.2. France Drug-Induced Immune Hemolytic Anemia, By Drug Type, 2017-2030 (US$ Bn)
11.3.3.3. France Drug-Induced Immune Hemolytic Anemia, By End User, 2017-2030 (US$ Bn)
11.3.4. UK
11.3.4.1. UK Drug-Induced Immune Hemolytic Anemia Market Estimates and Forecast, 2017-2030 (US$ Bn)
11.3.4.2. UK Drug-Induced Immune Hemolytic Anemia, By Drug Type, 2017-2030 (US$ Bn)
11.3.4.3. UK Drug-Induced Immune Hemolytic Anemia, By End User, 2017-2030 (US$ Bn)
11.3.5. Italy
11.3.5.1. Italy Drug-Induced Immune Hemolytic Anemia Market Estimates and Forecast, 2017-2030 (US$ Bn)
11.3.5.2. Italy Drug-Induced Immune Hemolytic Anemia, By Drug Type, 2017-2030 (US$ Bn)
11.3.5.3. Italy Drug-Induced Immune Hemolytic Anemia, By End User, 2017-2030 (US$ Bn)
11.3.6. Spain
11.3.6.1. Spain Drug-Induced Immune Hemolytic Anemia Market Estimates and Forecast, 2017-2030 (US$ Bn)
11.3.6.2. Spain Drug-Induced Immune Hemolytic Anemia, By Drug Type, 2017-2030 (US$ Bn)
11.3.6.3. Spain Drug-Induced Immune Hemolytic Anemia, By End User, 2017-2030 (US$ Bn)
11.3.7. Rest of Europe
11.3.7.1. Rest of Europe Drug-Induced Immune Hemolytic Anemia Market Estimates and Forecast, 2017-2030 (US$ Bn)
11.3.7.2. Rest of Europe Drug-Induced Immune Hemolytic Anemia, By Drug Type, 2017-2030 (US$ Bn)
11.3.7.3. Rest of Europe Drug-Induced Immune Hemolytic Anemia, By End User, 2017-2030 (US$ Bn)

12. Asia Pacific Drug-Induced Immune Hemolytic Anemia Market Analysis
12.1. Asia Pacific Drug-Induced Immune Hemolytic Anemia Market, by Drug Type, 2017-2030(US$ Bn)
12.1.1. Overview
12.1.2. SRC Analysis
12.2. Asia Pacific Drug-Induced Immune Hemolytic Anemia Market, by End User, 2017-2030(US$ Bn)
12.2.1. Overview
12.2.2. SRC Analysis
12.3. Asia Pacific Drug-Induced Immune Hemolytic Anemia Market, by Country, 2017-2030 (US$ Bn)
12.3.1. Asia Pacific Drug-Induced Immune Hemolytic Anemia Market, by Country, 2022 Vs 2030 (in%)
12.3.2. China
12.3.2.1. China Drug-Induced Immune Hemolytic Anemia Market Estimates and Forecast, 2017-2030 (US$ Bn)
12.3.2.2. China Drug-Induced Immune Hemolytic Anemia, By Drug Type, 2017-2030 (US$ Bn)
12.3.2.3. China Drug-Induced Immune Hemolytic Anemia, By End User, 2017-2030 (US$ Bn)
12.3.3. Japan
12.3.3.1. Japan Drug-Induced Immune Hemolytic Anemia Market Estimates and Forecast, 2017-2030 (US$ Bn)
12.3.3.2. Japan Drug-Induced Immune Hemolytic Anemia, By Drug Type, 2017-2030 (US$ Bn)
12.3.3.3. Japan Drug-Induced Immune Hemolytic Anemia, By End User, 2017-2030 (US$ Bn)
12.3.4. India
12.3.4.1. India Drug-Induced Immune Hemolytic Anemia Market Estimates and Forecast, 2017-2030 (US$ Bn)
12.3.4.2. India Drug-Induced Immune Hemolytic Anemia, By Drug Type, 2017-2030 (US$ Bn)
12.3.4.3. India Drug-Induced Immune Hemolytic Anemia, By End User, 2017-2030 (US$ Bn)
12.3.5. South Korea
12.3.5.1. South Korea Drug-Induced Immune Hemolytic Anemia Market Estimates and Forecast, 2017-2030 (US$ Bn)
12.3.5.2. South Korea Drug-Induced Immune Hemolytic Anemia, By Drug Type, 2017-2030 (US$ Bn)
12.3.5.3. South Korea Drug-Induced Immune Hemolytic Anemia, By End User, 2017-2030 (US$ Bn)
12.3.6. South-East Asia
12.3.6.1. South-East Asia Drug-Induced Immune Hemolytic Anemia Market Estimates and Forecast, 2017-2030 (US$ Bn)
12.3.6.2. South-East Asia Drug-Induced Immune Hemolytic Anemia, By Drug Type, 2017-2030 (US$ Bn)
12.3.6.3. South-East Asia Drug-Induced Immune Hemolytic Anemia, By End User, 2017-2030 (US$ Bn)
12.3.7. Rest of Asia Pacific
12.3.7.1. Rest of Asia Pacific Drug-Induced Immune Hemolytic Anemia Market Estimates and Forecast, 2017-2030 (US$ Bn)
12.3.7.2. Rest of Asia Pacific Drug-Induced Immune Hemolytic Anemia, By Drug Type, 2017-2030 (US$ Bn)
12.3.7.3. Rest of Asia Pacific Drug-Induced Immune Hemolytic Anemia, By End User, 2017-2030 (US$ Bn)

13. Latin America Drug-Induced Immune Hemolytic Anemia Market Analysis
13.1. Latin America Drug-Induced Immune Hemolytic Anemia Market, by Drug Type, 2017-2030(US$ Bn)
13.1.1. Overview
13.1.2. SRC Analysis
13.2. Latin America Drug-Induced Immune Hemolytic Anemia Market, by End User, 2017-2030(US$ Bn)
13.2.1. Overview
13.2.2. SRC Analysis
13.3. Latin America Drug-Induced Immune Hemolytic Anemia Market, by Country, 2017-2030 (US$ Bn)
13.3.1. Latin America Drug-Induced Immune Hemolytic Anemia Market, by Country, 2022 Vs 2030 (in%)
13.3.2. Brazil
13.3.2.1. Brazil Drug-Induced Immune Hemolytic Anemia Market Estimates and Forecast, 2017-2030 (US$ Bn)
13.3.2.2. Brazil Drug-Induced Immune Hemolytic Anemia, By Drug Type, 2017-2030 (US$ Bn)
13.3.2.3. Brazil Drug-Induced Immune Hemolytic Anemia, By End User, 2017-2030 (US$ Bn)
13.3.3. Argentina
13.3.3.1. Argentina Drug-Induced Immune Hemolytic Anemia Market Estimates and Forecast, 2017-2030 (US$ Bn)
13.3.3.2. Argentina Drug-Induced Immune Hemolytic Anemia, By Drug Type, 2017-2030 (US$ Bn)
13.3.3.3. Argentina Drug-Induced Immune Hemolytic Anemia, By End User, 2017-2030 (US$ Bn)
13.3.4. Rest of Latin America
13.3.4.1. Rest of Latin America Drug-Induced Immune Hemolytic Anemia Market Estimates and Forecast, 2017-2030 (US$ Bn)
13.3.4.2. Rest of Latin America Drug-Induced Immune Hemolytic Anemia, By Drug Type, 2017-2030 (US$ Bn)
13.3.4.3. Rest of Latin America Drug-Induced Immune Hemolytic Anemia, By End User, 2017-2030 (US$ Bn)

14. Middle East and Africa Drug-Induced Immune Hemolytic Anemia Market Analysis
14.1. Middle East and Africa Drug-Induced Immune Hemolytic Anemia Market, by Drug Type, 2017-2030(US$ Bn)
14.1.1. Overview
14.1.2. SRC Analysis
14.2. Middle East and Africa Drug-Induced Immune Hemolytic Anemia Market, by End User, 2017-2030(US$ Bn)
14.2.1. Overview
14.2.2. SRC Analysis
14.3. Middle East and Africa Drug-Induced Immune Hemolytic Anemia Market, by Country, 2017-2030 (US$ Bn)
14.3.1. Middle East and Africa Drug-Induced Immune Hemolytic Anemia Market, by Country, 2022 Vs 2030 (in%)
14.3.2. GCC Countries
14.3.2.1. GCC Countries Drug-Induced Immune Hemolytic Anemia Market Estimates and Forecast, 2017-2030 (US$ Bn)
14.3.2.2. GCC Countries Drug-Induced Immune Hemolytic Anemia, By Drug Type, 2017-2030 (US$ Bn)
14.3.2.3. GCC Countries Drug-Induced Immune Hemolytic Anemia, By End User, 2017-2030 (US$ Bn)
14.3.3. South Africa
14.3.3.1. South Africa Drug-Induced Immune Hemolytic Anemia Market Estimates and Forecast, 2017-2030 (US$ Bn)
14.3.3.2. South Africa Drug-Induced Immune Hemolytic Anemia, By Drug Type, 2017-2030 (US$ Bn)
14.3.3.3. South Africa Drug-Induced Immune Hemolytic Anemia, By End User, 2017-2030 (US$ Bn)
14.3.4. Rest of Middle East and Africa
14.3.4.1. Rest of Middle East and Africa Drug-Induced Immune Hemolytic Anemia Market Estimates and Forecast, 2017-2030 (US$ Bn)
14.3.4.2. Rest of Middle East and Africa Drug-Induced Immune Hemolytic Anemia, By Drug Type, 2017-2030 (US$ Bn)
14.3.4.3. Rest of Middle East and Africa Drug-Induced Immune Hemolytic Anemia, By End User, 2017-2030 (US$ Bn)

15. Company Profiles
15.1. ARUP Laboratories
15.1.1. Company Overview
15.1.2. Products/Services Portfolio
15.1.3. Geographical Presence
15.1.4. Financial Summary
15.1.4.1. Market Revenue and Net Profit (2019-2022)
15.1.4.2. Business Segment Revenue Analysis
15.1.4.3. Geographical Revenue Analysis
15.2. Cyprotex
15.3. Creative Biolabs
15.4. machaon diagnostics
15.5. F. Hoffmann-La Roche Ltd.
15.6. Baxter International Inc.
15.7. Pfizer Inc
15.8. Zydus Cadila
15.9. Amneal Pharmaceuticals Inc
15.10. Incycte Corp

List of Figures
FIG. 1 Global Drug-Induced Immune Hemolytic Anemia Market: Research Methodology
FIG. 2 Market Size Estimation – Top Down & Bottom up Approach
FIG. 3 Global Drug-Induced Immune Hemolytic Anemia Market Segmentation
FIG. 4 Global Drug-Induced Immune Hemolytic Anemia Market, by Drug Type, 2022 (US$ Bn)
FIG. 5 Global Drug-Induced Immune Hemolytic Anemia Market, by End User, 2022 (US$ Bn)
FIG. 6 Global Drug-Induced Immune Hemolytic Anemia Market, by Geography, 2022 (US$ Bn)
FIG. 7 Attractive Investment Proposition, by Drug Type, 2022
FIG. 8 Attractive Investment Proposition, by End User, 2022
FIG. 9 Attractive Investment Proposition, by Geography, 2022
FIG. 10 Global Market Share Analysis of Key Drug-Induced Immune Hemolytic Anemia Market Manufacturers, 2022
FIG. 11 Global Market Positioning of Key Drug-Induced Immune Hemolytic Anemia Market Manufacturers, 2022
FIG. 12 Global Drug-Induced Immune Hemolytic Anemia Market Value Contribution, By Drug Type, 2022 & 2030 (Value %)
FIG. 13 Global Drug-Induced Immune Hemolytic Anemia Market, by Cephalosporins, Value, 2017-2030 (US$ Bn)
FIG. 14 Global Drug-Induced Immune Hemolytic Anemia Market, by Quinidine, Value, 2017-2030 (US$ Bn)
FIG. 15 Global Drug-Induced Immune Hemolytic Anemia Market, by Levodopa, Value, 2017-2030 (US$ Bn)
FIG. 16 Global Drug-Induced Immune Hemolytic Anemia Market, by Methyldopa, Value, 2017-2030 (US$ Bn)
FIG. 17 Global Drug-Induced Immune Hemolytic Anemia Market, by Penicillin and its derivatives, Value, 2017-2030 (US$ Bn)
FIG. 18 Global Drug-Induced Immune Hemolytic Anemia Market, by Nitrofurantoin, Value, 2017-2030 (US$ Bn)
FIG. 19 Global Drug-Induced Immune Hemolytic Anemia Market, by Phenazopyridine (pyridium), Value, 2017-2030 (US$ Bn)
FIG. 20 Global Drug-Induced Immune Hemolytic Anemia Market, by Levofloxacin, Value, 2017-2030 (US$ Bn)
FIG. 21 Global Drug-Induced Immune Hemolytic Anemia Market, by Dapsone, Value, 2017-2030 (US$ Bn)
FIG. 22 Global Drug-Induced Immune Hemolytic Anemia Market Value Contribution, By End User, 2022 & 2030 (Value %)
FIG. 23 Global Drug-Induced Immune Hemolytic Anemia Market, by Clinical Laboratories, Value, 2017-2030 (US$ Bn)
FIG. 24 Global Drug-Induced Immune Hemolytic Anemia Market, by Hospitals, 2017-2030 (US$ Bn)
FIG. 25 North America Drug-Induced Immune Hemolytic Anemia Market, 2017-2030 (US$ Bn)
FIG. 26 U.S. Drug-Induced Immune Hemolytic Anemia Market, 2017-2030 (US$ Bn)
FIG. 27 Canada Drug-Induced Immune Hemolytic Anemia Market, 2017-2030 (US$ Bn)
FIG. 28 Europe Drug-Induced Immune Hemolytic Anemia Market, 2017-2030 (US$ Bn)
FIG. 29 Germany Drug-Induced Immune Hemolytic Anemia Market, 2017-2030 (US$ Bn)
FIG. 30 France Drug-Induced Immune Hemolytic Anemia Market, 2017-2030 (US$ Bn)
FIG. 31 U.K. Drug-Induced Immune Hemolytic Anemia Market, 2017-2030 (US$ Bn)
FIG. 32 Italy Drug-Induced Immune Hemolytic Anemia Market, 2017-2030 (US$ Bn)
FIG. 33 Spain Drug-Induced Immune Hemolytic Anemia Market, 2017-2030 (US$ Bn)
FIG. 34 Rest of Europe Drug-Induced Immune Hemolytic Anemia Market, 2017-2030 (US$ Bn)
FIG. 35 Asia Pacific Drug-Induced Immune Hemolytic Anemia Market, 2017-2030 (US$ Bn)
FIG. 36 China Drug-Induced Immune Hemolytic Anemia Market, 2017-2030 (US$ Bn)
FIG. 37 Japan Drug-Induced Immune Hemolytic Anemia Market, 2017-2030 (US$ Bn)
FIG. 38 India Drug-Induced Immune Hemolytic Anemia Market, 2017-2030 (US$ Bn)
FIG. 39 South Korea Drug-Induced Immune Hemolytic Anemia Market, 2017-2030 (US$ Bn)
FIG. 40 South-East Asia Drug-Induced Immune Hemolytic Anemia Market, 2017-2030 (US$ Bn)
FIG. 41 Rest of Asia Pacific Drug-Induced Immune Hemolytic Anemia Market, 2017-2030 (US$ Bn)
FIG. 42 Latin America Drug-Induced Immune Hemolytic Anemia Market, 2017-2030 (US$ Bn)
FIG. 43 Brazil Drug-Induced Immune Hemolytic Anemia Market, 2017-2030 (US$ Bn)
FIG. 44 Mexico Drug-Induced Immune Hemolytic Anemia Market, 2017-2030 (US$ Bn)
FIG. 45 Rest of Latin America Drug-Induced Immune Hemolytic Anemia Market, 2017-2030 (US$ Bn)
FIG. 46 Middle East & Africa Drug-Induced Immune Hemolytic Anemia Market, 2017-2030 (US$ Bn)
FIG. 47 GCC Countries Drug-Induced Immune Hemolytic Anemia Market, 2017-2030 (US$ Bn)
FIG. 48 South Africa Drug-Induced Immune Hemolytic Anemia Market, 2017-2030 (US$ Bn)
FIG. 49 Rest of Middle East and Africa Drug-Induced Immune Hemolytic Anemia Market, 2017-2030 (US$ Bn)

List of Tables
TABLE 1 Market Snapshot: Global Drug-Induced Immune Hemolytic Anemia Market
TABLE 2 Global Drug-Induced Immune Hemolytic Anemia Market: Market Drivers Impact Analysis
TABLE 3 Global Drug-Induced Immune Hemolytic Anemia Market: Market Restraints Impact Analysis
TABLE 4 Global Drug-Induced Immune Hemolytic Anemia Market, by Competitive Benchmarking, 2022
TABLE 5 Global Drug-Induced Immune Hemolytic Anemia Market, by Geographical Presence Analysis, 2022
TABLE 6 Global Drug-Induced Immune Hemolytic Anemia Market, by Key Strategies Analysis, 2022
TABLE 7 Global Drug-Induced Immune Hemolytic Anemia Market, by Cephalosporins, By Region, 2017-2022 (US$ Bn)
TABLE 8 Global Drug-Induced Immune Hemolytic Anemia Market, by Cephalosporins, By Region, 2023-2030 (US$ Bn)
TABLE 9 Global Drug-Induced Immune Hemolytic Anemia Market, by Quinidine, By Region, 2017-2022 (US$ Bn)
TABLE 10 Global Drug-Induced Immune Hemolytic Anemia Market, by Quinidine, By Region, 2023-2030 (US$ Bn)
TABLE 11 Global Drug-Induced Immune Hemolytic Anemia Market, by Levodopa, By Region, 2017-2022 (US$ Bn)
TABLE 12 Global Drug-Induced Immune Hemolytic Anemia Market, by Levodopa, By Region, 2023-2030 (US$ Bn)
TABLE 13 Global Drug-Induced Immune Hemolytic Anemia Market, by Methyldopa, By Region, 2017-2022 (US$ Bn)
TABLE 14 Global Drug-Induced Immune Hemolytic Anemia Market, by Methyldopa, By Region, 2023-2030 (US$ Bn)
TABLE 15 Global Drug-Induced Immune Hemolytic Anemia Market, by Penicillin and its derivatives, By Region, 2017-2022 (US$ Bn)
TABLE 16 Global Drug-Induced Immune Hemolytic Anemia Market, by Penicillin and its derivatives, By Region, 2023-2030 (US$ Bn)
TABLE 17 Global Drug-Induced Immune Hemolytic Anemia Market, by Nitrofurantoin, By Region, 2017-2022 (US$ Bn)
TABLE 18 Global Drug-Induced Immune Hemolytic Anemia Market, by Nitrofurantoin, By Region, 2023-2030 (US$ Bn)
TABLE 19 Global Drug-Induced Immune Hemolytic Anemia Market, by Phenazopyridine (pyridium), By Region, 2017-2022 (US$ Bn)
TABLE 20 Global Drug-Induced Immune Hemolytic Anemia Market, by Phenazopyridine (pyridium), By Region, 2023-2030 (US$ Bn)
TABLE 21 Global Drug-Induced Immune Hemolytic Anemia Market, by Levofloxacin, By Region, 2017-2022 (US$ Bn)
TABLE 22 Global Drug-Induced Immune Hemolytic Anemia Market, by Levofloxacin, By Region, 2023-2030 (US$ Bn)
TABLE 23 Global Drug-Induced Immune Hemolytic Anemia Market, by Dapsone, By Region, 2017-2022 (US$ Bn)
TABLE 24 Global Drug-Induced Immune Hemolytic Anemia Market, by Dapsone, By Region, 2023-2030 (US$ Bn)
TABLE 25 Global Drug-Induced Immune Hemolytic Anemia Market, by Clinical Laboratories, By Region, 2017-2022 (US$ Bn)
TABLE 26 Global Drug-Induced Immune Hemolytic Anemia Market, by Clinical Laboratories, By Region, 2023-2030 (US$ Bn)
TABLE 27 Global Drug-Induced Immune Hemolytic Anemia Market, by Hospitals, By Region, 2017-2022 (US$ Bn)
TABLE 28 Global Drug-Induced Immune Hemolytic Anemia Market, by Hospitals, By Region, 2023-2030 (US$ Bn)
TABLE 29 Global Drug-Induced Immune Hemolytic Anemia Market, by Drug Type, 2017-2022 (US$ Bn)
TABLE 30 Global Drug-Induced Immune Hemolytic Anemia Market, by Drug Type, 2023-2030 (US$ Bn)
TABLE 31 Global Drug-Induced Immune Hemolytic Anemia Market, by End User, 2017-2022 (US$ Bn)
TABLE 32 Global Drug-Induced Immune Hemolytic Anemia Market, by End User, 2023-2030 (US$ Bn)
TABLE 33 Global Drug-Induced Immune Hemolytic Anemia Market, by Region, 2017-2022 (US$ Bn)
TABLE 34 Global Drug-Induced Immune Hemolytic Anemia Market, by Region, 2023-2030 (US$ Bn)
TABLE 35 North America Drug-Induced Immune Hemolytic Anemia Market, by Drug Type, 2017-2022 (US$ Bn)
TABLE 36 North America Drug-Induced Immune Hemolytic Anemia Market, by Drug Type, 2023-2030 (US$ Bn)
TABLE 37 North America Drug-Induced Immune Hemolytic Anemia Market, by End User, 2017-2022 (US$ Bn)
TABLE 38 North America Drug-Induced Immune Hemolytic Anemia Market, by End User, 2023-2030 (US$ Bn)
TABLE 39 North America Drug-Induced Immune Hemolytic Anemia Market, by Country, 2017-2022 (US$ Bn)
TABLE 40 North America Drug-Induced Immune Hemolytic Anemia Market, by Country, 2023-2030 (US$ Bn)
TABLE 41 United States Drug-Induced Immune Hemolytic Anemia Market, by Drug Type, 2017-2022 (US$ Bn)
TABLE 42 United States Drug-Induced Immune Hemolytic Anemia Market, by Drug Type, 2023-2030 (US$ Bn)
TABLE 43 United States Drug-Induced Immune Hemolytic Anemia Market, by End User, 2017-2022 (US$ Bn)
TABLE 44 United States Drug-Induced Immune Hemolytic Anemia Market, by End User, 2023-2030 (US$ Bn)
TABLE 45 Canada Drug-Induced Immune Hemolytic Anemia Market, by Drug Type, 2017-2022 (US$ Bn)
TABLE 46 Canada Drug-Induced Immune Hemolytic Anemia Market, by Drug Type, 2023-2030 (US$ Bn)
TABLE 47 Canada Drug-Induced Immune Hemolytic Anemia Market, by End User, 2017-2022 (US$ Bn)
TABLE 48 Canada Drug-Induced Immune Hemolytic Anemia Market, by End User, 2023-2030 (US$ Bn)
TABLE 49 Mexico Drug-Induced Immune Hemolytic Anemia Market, by Drug Type, 2017-2022 (US$ Bn)
TABLE 50 Mexico Drug-Induced Immune Hemolytic Anemia Market, by Drug Type, 2023-2030 (US$ Bn)
TABLE 51 Mexico Drug-Induced Immune Hemolytic Anemia Market, by End User, 2017-2022 (US$ Bn)
TABLE 52 Mexico Drug-Induced Immune Hemolytic Anemia Market, by End User, 2023-2030 (US$ Bn)
TABLE 53 Europe Drug-Induced Immune Hemolytic Anemia Market, by Drug Type, 2017-2022 (US$ Bn)
TABLE 54 Europe Drug-Induced Immune Hemolytic Anemia Market, by Drug Type, 2023-2030 (US$ Bn)
TABLE 55 Europe Drug-Induced Immune Hemolytic Anemia Market, by End User, 2017-2022 (US$ Bn)
TABLE 56 Europe Drug-Induced Immune Hemolytic Anemia Market, by End User, 2023-2030 (US$ Bn)
TABLE 57 Europe Drug-Induced Immune Hemolytic Anemia Market, by Country, 2017-2022 (US$ Bn)
TABLE 58 Europe Drug-Induced Immune Hemolytic Anemia Market, by Country, 2023-2030 (US$ Bn)
TABLE 59 Germany Drug-Induced Immune Hemolytic Anemia Market, by Drug Type, 2017-2022 (US$ Bn)
TABLE 60 Germany Drug-Induced Immune Hemolytic Anemia Market, by Drug Type, 2023-2030 (US$ Bn)
TABLE 61 Germany Drug-Induced Immune Hemolytic Anemia Market, by End User, 2017-2022 (US$ Bn)
TABLE 62 Germany Drug-Induced Immune Hemolytic Anemia Market, by End User, 2023-2030 (US$ Bn)
TABLE 63 France Drug-Induced Immune Hemolytic Anemia Market, by Drug Type, 2017-2022 (US$ Bn)
TABLE 64 France Drug-Induced Immune Hemolytic Anemia Market, by Drug Type, 2023-2030 (US$ Bn)
TABLE 65 France Drug-Induced Immune Hemolytic Anemia Market, by End User, 2017-2022 (US$ Bn)
TABLE 66 France Drug-Induced Immune Hemolytic Anemia Market, by End User, 2023-2030 (US$ Bn)
TABLE 67 United Kingdom Drug-Induced Immune Hemolytic Anemia Market, by Drug Type, 2017-2022 (US$ Bn)
TABLE 68 United Kingdom Drug-Induced Immune Hemolytic Anemia Market, by Drug Type, 2023-2030 (US$ Bn)
TABLE 69 United Kingdom Drug-Induced Immune Hemolytic Anemia Market, by End User, 2017-2022 (US$ Bn)
TABLE 70 United Kingdom Drug-Induced Immune Hemolytic Anemia Market, by End User, 2023-2030 (US$ Bn)
TABLE 71 Italy Drug-Induced Immune Hemolytic Anemia Market, by Drug Type, 2017-2022 (US$ Bn)
TABLE 72 Italy Drug-Induced Immune Hemolytic Anemia Market, by Drug Type, 2023-2030 (US$ Bn)
TABLE 73 Italy Drug-Induced Immune Hemolytic Anemia Market, by End User, 2017-2022 (US$ Bn)
TABLE 74 Italy Drug-Induced Immune Hemolytic Anemia Market, by End User, 2023-2030 (US$ Bn)
TABLE 75 Spain Drug-Induced Immune Hemolytic Anemia Market, by Drug Type, 2017-2022 (US$ Bn)
TABLE 76 Spain Drug-Induced Immune Hemolytic Anemia Market, by Drug Type, 2023-2030 (US$ Bn)
TABLE 77 Spain Drug-Induced Immune Hemolytic Anemia Market, by End User, 2017-2022 (US$ Bn)
TABLE 78 Spain Drug-Induced Immune Hemolytic Anemia Market, by End User, 2023-2030 (US$ Bn)
TABLE 79 Rest of Europe Drug-Induced Immune Hemolytic Anemia Market, by Drug Type, 2017-2022 (US$ Bn)
TABLE 80 Rest of Europe Drug-Induced Immune Hemolytic Anemia Market, by Drug Type, 2023-2030 (US$ Bn)
TABLE 81 Rest of Europe Drug-Induced Immune Hemolytic Anemia Market, by End User, 2017-2022 (US$ Bn)
TABLE 82 Rest of Europe Drug-Induced Immune Hemolytic Anemia Market, by End User, 2023-2030 (US$ Bn)
TABLE 83 Asia Pacific Drug-Induced Immune Hemolytic Anemia Market, by Drug Type, 2017-2022 (US$ Bn)
TABLE 84 Asia Pacific Drug-Induced Immune Hemolytic Anemia Market, by Drug Type, 2023-2030 (US$ Bn)
TABLE 85 Asia Pacific Drug-Induced Immune Hemolytic Anemia Market, by End User, 2017-2022 (US$ Bn)
TABLE 86 Asia Pacific Drug-Induced Immune Hemolytic Anemia Market, by End User, 2023-2030 (US$ Bn)
TABLE 87 Asia Pacific Drug-Induced Immune Hemolytic Anemia Market, by Country, 2017-2022 (US$ Bn)
TABLE 88 Asia Pacific Drug-Induced Immune Hemolytic Anemia Market, by Country, 2023-2030 (US$ Bn)
TABLE 89 China Drug-Induced Immune Hemolytic Anemia Market, by Drug Type, 2017-2022 (US$ Bn)
TABLE 90 China Drug-Induced Immune Hemolytic Anemia Market, by Drug Type, 2023-2030 (US$ Bn)
TABLE 91 China Drug-Induced Immune Hemolytic Anemia Market, by End User, 2017-2022 (US$ Bn)
TABLE 92 China Drug-Induced Immune Hemolytic Anemia Market, by End User, 2023-2030 (US$ Bn)
TABLE 93 Japan Drug-Induced Immune Hemolytic Anemia Market, by Drug Type, 2017-2022 (US$ Bn)
TABLE 94 Japan Drug-Induced Immune Hemolytic Anemia Market, by Drug Type, 2023-2030 (US$ Bn)
TABLE 95 Japan Drug-Induced Immune Hemolytic Anemia Market, by End User, 2017-2022 (US$ Bn)
TABLE 96 Japan Drug-Induced Immune Hemolytic Anemia Market, by End User, 2023-2030 (US$ Bn)
TABLE 97 India Drug-Induced Immune Hemolytic Anemia Market, by Drug Type, 2017-2022 (US$ Bn)
TABLE 98 India Drug-Induced Immune Hemolytic Anemia Market, by Drug Type, 2023-2030 (US$ Bn)
TABLE 99 India Drug-Induced Immune Hemolytic Anemia Market, by End User, 2017-2022 (US$ Bn)
TABLE 100 India Drug-Induced Immune Hemolytic Anemia Market, by End User, 2023-2030 (US$ Bn)
TABLE 101 South Korea Drug-Induced Immune Hemolytic Anemia Market, by Drug Type, 2017-2022 (US$ Bn)
TABLE 102 South Korea Drug-Induced Immune Hemolytic Anemia Market, by Drug Type, 2023-2030 (US$ Bn)
TABLE 103 South Korea Drug-Induced Immune Hemolytic Anemia Market, by End User, 2017-2022 (US$ Bn)
TABLE 104 South Korea Drug-Induced Immune Hemolytic Anemia Market, by End User, 2023-2030 (US$ Bn)
TABLE 105 South-East Asia Drug-Induced Immune Hemolytic Anemia Market, by Drug Type, 2017-2022 (US$ Bn)
TABLE 106 South-East Asia Drug-Induced Immune Hemolytic Anemia Market, by Drug Type, 2023-2030 (US$ Bn)
TABLE 107 South-East Asia Drug-Induced Immune Hemolytic Anemia Market, by End User, 2017-2022 (US$ Bn)
TABLE 108 South-East Asia Drug-Induced Immune Hemolytic Anemia Market, by End User, 2023-2030 (US$ Bn)
TABLE 109 Rest of Asia Pacific Drug-Induced Immune Hemolytic Anemia Market, by Drug Type, 2017-2022 (US$ Bn)
TABLE 110 Rest of Asia Pacific Drug-Induced Immune Hemolytic Anemia Market, by Drug Type, 2023-2030 (US$ Bn)
TABLE 111 Rest of Asia Pacific Drug-Induced Immune Hemolytic Anemia Market, by End User, 2017-2022 (US$ Bn)
TABLE 112 Rest of Asia Pacific Drug-Induced Immune Hemolytic Anemia Market, by End User, 2023-2030 (US$ Bn)
TABLE 113 Latin America Drug-Induced Immune Hemolytic Anemia Market, by Drug Type, 2017-2022 (US$ Bn)
TABLE 114 Latin America Drug-Induced Immune Hemolytic Anemia Market, by Drug Type, 2023-2030 (US$ Bn)
TABLE 115 Latin America Drug-Induced Immune Hemolytic Anemia Market, by End User, 2017-2022 (US$ Bn)
TABLE 116 Latin America Drug-Induced Immune Hemolytic Anemia Market, by End User, 2023-2030 (US$ Bn)
TABLE 117 Latin America Drug-Induced Immune Hemolytic Anemia Market, by Country, 2017-2022 (US$ Bn)
TABLE 118 Latin America Drug-Induced Immune Hemolytic Anemia Market, by Country, 2023-2030 (US$ Bn)
TABLE 119 Brazil Drug-Induced Immune Hemolytic Anemia Market, by Drug Type, 2017-2022 (US$ Bn)
TABLE 120 Brazil Drug-Induced Immune Hemolytic Anemia Market, by Drug Type, 2023-2030 (US$ Bn)
TABLE 121 Brazil Drug-Induced Immune Hemolytic Anemia Market, by End User, 2017-2022 (US$ Bn)
TABLE 122 Brazil Drug-Induced Immune Hemolytic Anemia Market, by End User, 2023-2030 (US$ Bn)
TABLE 123 Argentina Drug-Induced Immune Hemolytic Anemia Market, by Drug Type, 2017-2022 (US$ Bn)
TABLE 124 Argentina Drug-Induced Immune Hemolytic Anemia Market, by Drug Type, 2023-2030 (US$ Bn)
TABLE 125 Argentina Drug-Induced Immune Hemolytic Anemia Market, by End User, 2017-2022 (US$ Bn)
TABLE 126 Argentina Drug-Induced Immune Hemolytic Anemia Market, by End User, 2023-2030 (US$ Bn)
TABLE 127 Rest of Latin America Drug-Induced Immune Hemolytic Anemia Market, by Drug Type, 2017-2022 (US$ Bn)
TABLE 128 Rest of Latin America Drug-Induced Immune Hemolytic Anemia Market, by Drug Type, 2023-2030 (US$ Bn)
TABLE 129 Rest of Latin America Drug-Induced Immune Hemolytic Anemia Market, by End User, 2017-2022 (US$ Bn)
TABLE 130 Rest of Latin America Drug-Induced Immune Hemolytic Anemia Market, by End User, 2023-2030 (US$ Bn)
TABLE 131 Middle East and Africa Drug-Induced Immune Hemolytic Anemia Market, by Drug Type, 2017-2022 (US$ Bn)
TABLE 132 Middle East and Africa Drug-Induced Immune Hemolytic Anemia Market, by Drug Type, 2023-2030 (US$ Bn)
TABLE 133 Middle East and Africa Drug-Induced Immune Hemolytic Anemia Market, by End User, 2017-2022 (US$ Bn)
TABLE 134 Middle East and Africa Drug-Induced Immune Hemolytic Anemia Market, by End User, 2023-2030 (US$ Bn)
TABLE 135 Middle East and Africa Drug-Induced Immune Hemolytic Anemia Market, by Country, 2017-2022 (US$ Bn)
TABLE 136 Middle East and Africa Drug-Induced Immune Hemolytic Anemia Market, by Country, 2023-2030 (US$ Bn)
TABLE 137 GCC Countries Drug-Induced Immune Hemolytic Anemia Market, by Drug Type, 2017-2022 (US$ Bn)
TABLE 138 GCC Countries Drug-Induced Immune Hemolytic Anemia Market, by Drug Type, 2023-2030 (US$ Bn)
TABLE 139 GCC Countries Drug-Induced Immune Hemolytic Anemia Market, by End User, 2017-2022 (US$ Bn)
TABLE 140 GCC Countries Drug-Induced Immune Hemolytic Anemia Market, by End User, 2023-2030 (US$ Bn)
TABLE 141 South Africa Drug-Induced Immune Hemolytic Anemia Market, by Drug Type, 2017-2022 (US$ Bn)
TABLE 142 South Africa Drug-Induced Immune Hemolytic Anemia Market, by Drug Type, 2023-2030 (US$ Bn)
TABLE 143 South Africa Drug-Induced Immune Hemolytic Anemia Market, by End User, 2017-2022 (US$ Bn)
TABLE 144 South Africa Drug-Induced Immune Hemolytic Anemia Market, by End User, 2023-2030 (US$ Bn)
TABLE 145 Rest of Middle East and Africa Drug-Induced Immune Hemolytic Anemia Market, by Drug Type, 2017-2022 (US$ Bn)
TABLE 146 Rest of Middle East and Africa Drug-Induced Immune Hemolytic Anemia Market, by Drug Type, 2023-2030 (US$ Bn)
TABLE 147 Rest of Middle East and Africa Drug-Induced Immune Hemolytic Anemia Market, by End User, 2017-2022 (US$ Bn)
TABLE 148 Rest of Middle East and Africa Drug-Induced Immune Hemolytic Anemia Market, by End User, 2023-2030 (US$ Bn)

Frequently Asked Questions

What is the current size of the global Drug-induced immune hemolytic anemia market?

The global Drug-induced immune hemolytic anemia market was valued at USD 7.1 Billion in 2022.

What is the expected growth rate of the Drug-induced immune hemolytic anemia market between 2023 and 2030?

The Drug-induced immune hemolytic anemia market is expected to grow at a CAGR of 5.90% between 2023 and 2030, reaching USD 10.60547365 Billion in 2030.

Which Drug type segment is leading the market share in terms of drug Type?

levodopa is the leading segment by drug type, holding around half of share in value in 2022.

Which End User segment governs the demand for Drug-induced immune hemolytic anemia in the world?

The Clinical Laboratories segment governs the demand for Drug-induced immune hemolytic anemia worldwide, holding a massive share of nearly 25% in 2022.

Which segment is expected to post the highest CAGR during the forecast period?

The cephalosporins and methyldopa segment is expected to post the highest CAGR during the forecast period.

Which region is fueling the growth of the Drug-induced immune hemolytic anemia industry?

Europe is fueling the growth of the Drug-induced immune hemolytic anemia industry, with nearly two-fifth share in 2022.

Who are the major players in the global Drug-induced immune hemolytic anemia market?

The top players include ARUP Laboratories, Cyprotex, Creative Biolabs, machaon diagnostics, F. Hoffmann-La Roche Ltd., Baxter International Inc., Pfizer Inc, Zydus Cadila, Amneal Pharmaceuticals Inc.

What is the major market driver of the Drug-induced immune hemolytic anemia industry?

Growing use of various drugs and medications across the healthcare industry & drug development and innovation are the major market drivers.

What are the major market restraints of the Drug-induced immune hemolytic anemia industry?

The major market restraints are the lack of awareness and underdiagnosis of the condition.

What are the major market opportunities of the Drug-induced immune hemolytic anemia industry?

The development of advanced diagnostic technologies presents and education & training program outcomes are the major opportunities in the drug-induced immune hemolytic anemia industry.

Rotator Cuff Injury Treatment Market

Published:
Report ID: 36567

Aspergillosis Treatment Market

Published:
Report ID: 2106

Middle East And Africa Female Hygiene Products Market

Published:
Report ID: 8484

Therapeutic Monoclonal Antibodies Market

Published:
Report ID: 11175

Prostate Cancer Market

Published:
Report ID: 36273

Antineoplastic Agents Market

Published:
Report ID: 36065

US Retail Pharmacy Market

Published:
Report ID: 32801

OTC Vitamins Dietary Supplements Market

Published:
Report ID: 35994

Liposomes Market

Published:
Report ID: 35888

UK Iron Supplement Market

Published:
Report ID: 35709

U.S. Iron Supplement Market

Published:
Report ID: 35688

Malignant Ascites Market

Published:
Report ID: 11184

Purchase Options

$2999
Delivery Format: Excel.
$4999
Designed for the individual purchaser.
$6999
Users located at a single corporate site or regional office.
$7999
Allowed for unlimited sharing globally within one company.
Smallform of Sample request

Have a question?

User Profile

Don’t settle for less – trust Mitul to help you find the best solution.

Report delivery within 24 to 48 hours

– Other Info –

What people say?-

User Review

I am very impressed with the information in this report. The author clearly did their research when they came up with this product and it has already given me a lot of ideas.

Jana Schmidt
CEDAR CX Technologies

– Connect with us –

Phone

+91 6232 49 3207


support

24/7 Research Support


sales@credenceresearch.com

– Research Methodology –

Going beyond the basics: advanced techniques in research methodology

– Trusted By –

Pepshi, LG, Nestle
Motorola, Honeywell, Johnson and johnson
LG Chem, SIEMENS, Pfizer
Unilever, Samsonite, QIAGEN