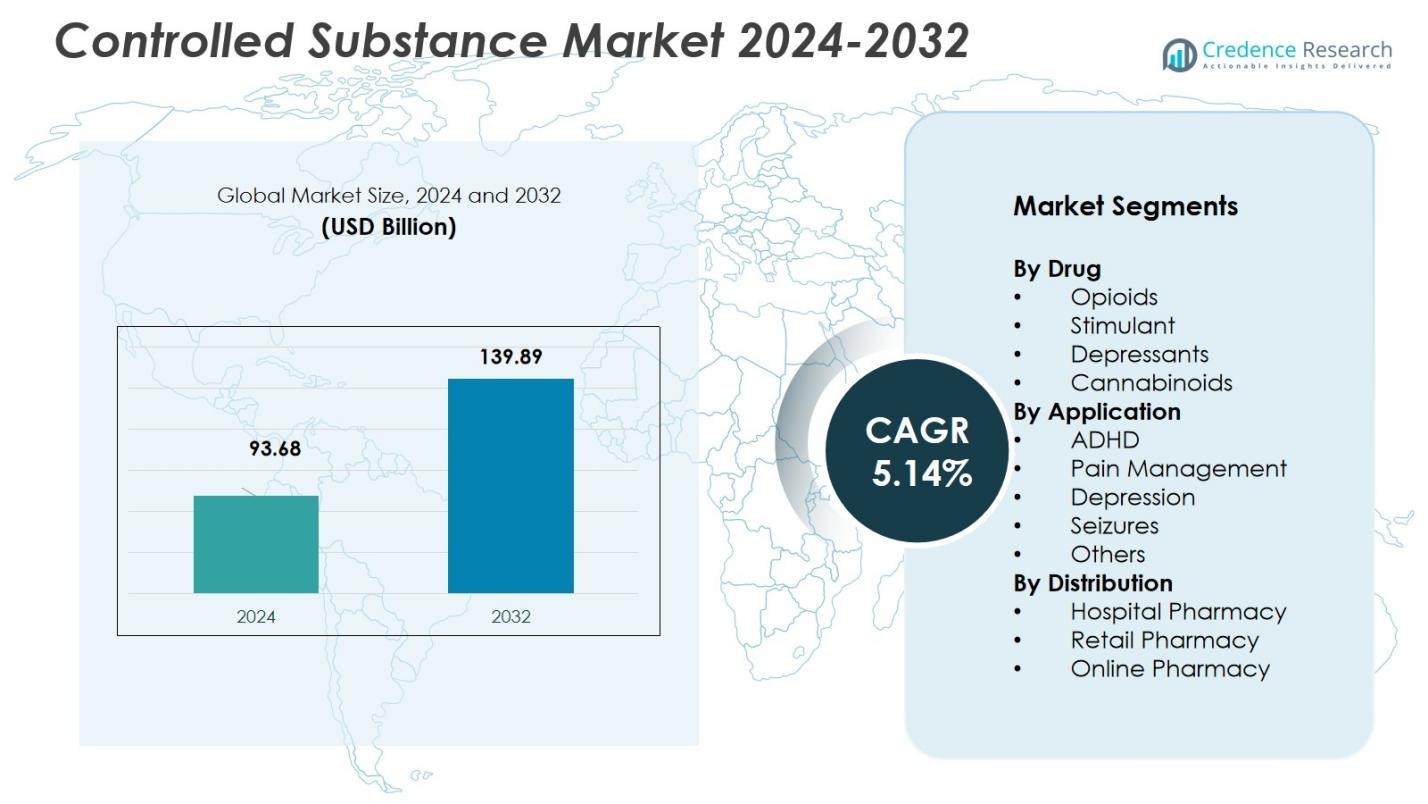
Home » Healthcare » Pharmaceuticals » Controlled Substance Market

Controlled Substance Market By Scheduling or Classification (Schedule I Controlled Substances, Schedule II Controlled Substances, Schedule III Controlled Substances, Schedule IV Controlled Substances, Schedule V Controlled Substances, Unscheduled Substances) By Therapeutic Use (Pain Management, Psychiatric Medications, Substance Abuse Treatment, Anesthesia, Other Therapeutic Uses)-Growth, Future Prospects & Competitive Analysis, 2016 – 2030

Price: $4999

Published: | Report ID: 22409 | Report Format : PDF

Executive Summary

Market Definition

The controlled substance market encompasses the global industry involved in the production, distribution, and utilization of pharmaceutical compounds and medications classified as controlled substances. These substances are subject to strict government regulations due to their potential for addiction, abuse, and misuse, leading to their categorization into different schedules or classifications. The market serves various therapeutic applications, including pain management, addiction treatment, and treatment for various medical conditions. It operates under stringent regulatory oversight to ensure the responsible and safe use of these substances.

controlled substance market (1)

Market Overview

The global controlled substance market has witnessed rapid growth in recent years and is anticipated to grow at a CAGR of 7.5% between 2023 and 2030. The market was valued at USD 66845.9 million in 2022 and is expected to reach USD 119218.2 million in 2030.

Drugs that fall under the category of controlled substances typically have their production, distribution, and possession under government control due to the possibility that they could lead to addiction or substance misuse. Controlled substances are often distributed through prescriptions issued by medical practitioners for the treatment of a variety of physical and mental health problems.

The increasing usage of controlled drugs to treat a variety of medical ailments, as well as their increasing application in drug research and drug formulation operations, is likely to drive market expansion over the projection period. The growing number of persons choosing medical marijuana over prescription medications for the treatment of both physical and mental concerns is expected to increase controlled substance exports over the next ten years. Moreover, increased investments in clinical research & development are expected to assist market development in the upcoming years.

Design Element 2

Access crucial information at unmatched prices!

Request your free sample report today & start making informed decisions powered by Credence Research!

Download Free Sample
CTA Design Element 3

Market Insights

  • The global demand for controlled substances was valued at USD 66845.9 Million in 2022 and is expected to reach USD 119218.2 Million in 2030, growing at a CAGR of 7.5% between 2023 and 2030.
  • The schedule III-controlled substances segment is the market leader by scheduling or classification, accounting for more than 30% of total value in 2022, while the schedule IV-controlled substances segment is anticipated to grow rapidly over the projection period.
  • The retail pharmacies distribution channel category is expected to expand quickly in the forecast period, while the hospital pharmacies segment has the greatest market share in 2022.
  • Pain management therapeutic use dominates the global need for controlled substances, accounting for more than 32% in 2022 and is predicted to expand at a high CAGR.
  • The chronic pain category dominated the market with 40% of the total revenue share by indication. In contrast, the substance use disorder category will expand fastest in the projected time frame.
  • The adults category dominated the market with 66% of the total revenue share by the patient demographics segment.
  • North America is driving the expansion of the controlled substance industry, accounting for more than one-third of the market in 2022, while Asia Pacific and Europe account for just under 54% of the market in 2022. In 2022, Europe held more than 20% of the market.
  • Telemedicine and digital health solutions are gaining importance for remote prescription and monitoring of controlled substances, especially in the wake of the COVID-19 pandemic.
  • The market is experiencing a shift towards precision medicine, where genetic information is used to tailor controlled substance prescriptions to individual patients, optimizing treatment outcomes and reducing risks.
  • The market faces challenges related to counterfeit and illegally manufactured controlled substances, which pose significant risks to public health.
  • The ongoing research on the potential therapeutic benefits of certain controlled substances, such as psychedelics (e.g., psilocybin and MDMA), has led to increased interest in their regulated and supervised use in medical settings.

Segmentation Analysis:

Segmentation by Scheduling or Classification

  • The schedule IV-controlled substances segment is anticipated to showcase a robust CAGR in the forecasted period. This growth can be attributed to the pharmaceutical industry’s continued efforts to develop controlled substances with lower abuse potential and reduced side effects, aligning with evolving regulatory requirements.
  • Presently, the schedule III-controlled substances segment dominates the market landscape, capturing a significant market share of over 30% in 2022. This segment’s prominence can be attributed to its established use in various medical applications, including pain management and treatment of certain medical conditions.

Segmentation by Therapeutic Use

  • The substance abuse treatment segment is expected to post the highest CAGR in the anticipated period. The rising global awareness of substance abuse issues and the expansion of addiction treatment programs drive the demand for controlled substances within this segment.
  • Leading the market share with a commanding presence of over 32% in 2022, the pain management segment encompasses a diverse range of applications within the controlled substance market. It addresses the needs of a vast patient population suffering from chronic pain conditions, post-surgical pain, and pain related to chronic diseases such as neuropathy and cancer.

Segmentation by Distribution Channel

  • Hospital pharmacies, as a dominant distribution channel category, are expected to maintain their prominence, driven by their ability to ensure the secure and regulated dispensing of controlled substances. In 2022, hospital pharmacies accounted for more than 35% of the global demand for controlled substances, and this figure is projected to grow at a robust CAGR.
  • The retail pharmacies segment caters to the remaining demand for controlled substances, offering accessibility to patients for prescribed medications. It plays a key role in ensuring patient’s convenience and access to controlled substances, serving as a major link between healthcare providers and patients.

Segmentation by Patient Demographics

  • Emerging as the leader in controlled substance consumption, the adults category dominated the market with a substantial 66% share in 2022. This dominance is driven by the higher prevalence of chronic pain and related medical conditions among the adult population, necessitating prolonged pain management.
  • During the forecast period, the pediatric segment is anticipated to witness rapid growth. This growth underscores the need for specialized formulations tailored to pediatric patients, ensuring safe and effective controlled substance administration while considering unique pediatric pharmacokinetics and dosing requirements.

Segmentation by Indication

  • The substance use disorder segment is set to exhibit the highest CAGR over the projection period, reflecting the growing recognition of addiction as a global healthcare concern. This segment’s growth is driven by increased efforts to address substance abuse issues and provide comprehensive addiction treatment options.
  • Currently, the chronic pain segment commands a leading market share, contributing to over 40% of the market in 2022. This dominance is attributable to the escalating prevalence of chronic pain conditions worldwide, necessitating the ongoing use of controlled substances for pain management.

Segmentation by Region

  • North America emerges as a remarkably profitable region for industry players in the controlled substance market, holding over one-third share in 2022. The highly advanced regional healthcare infrastructure, aging population, and robust pharmaceutical industry contribute to its market dominance.
  • Asia Pacific and Europe collectively account for just under 54% share in 2022, with Europe securing over 20% of the market share in the same year. Europe’s strong market presence is underpinned by its well-regulated healthcare systems and evolving patient demographics.
  • The rest of the world, including regions such as Latin America, the Middle East, and Africa, represents a growing demand for controlled substances as healthcare infrastructure continues to develop, presenting promising opportunities for market expansion.

controlled substance market region (1)

The escalating prevalence of chronic diseases, growth in the geriatric population, rising healthcare expenditure, increased demand for pain management drugs, an upsurge in prescription drug abuse, developments in drug delivery technologies, and product development for new therapeutic applications are the major factors driving the global controlled substance market’s growth.

In 2022, North America is expected to be the largest regional controlled substance market. North America, particularly the United States, is home to a substantial pharmaceutical industry. Many of the world’s largest pharmaceutical companies, with extensive experience in manufacturing and distributing controlled substances, are headquartered in North America. The region has a significant aging population, leading to a high demand for pain management solutions. Chronic pain conditions are prevalent, driving the need for controlled substances for pain relief. Many states in the U.S. have also legalized medical marijuana, creating a substantial market for cannabis-based pharmaceuticals and medical marijuana products.

Over the projection period, Asia Pacific is expected to be the fastest-growing region in the global controlled substance market due to several key factors. Increasing healthcare expenditure in regional countries, driven by economic growth and expanding middle-class populations, is boosting the demand for pharmaceuticals, including controlled substances. Asia Pacific is witnessing a shift in disease profiles, with a higher incidence of chronic diseases such as cancer and diabetes. Managing pain and symptoms associated with these conditions often involves the use of controlled substances. Increasing regional awareness about pain management options and the rising availability of controlled substance-based treatments are further driving patient and physician demand.

Key Highlights of the Report

The global controlled substance market is segmented by scheduling or classification, therapeutic use, distribution channel, patient demographics, indication, and region. Schedule IV-controlled substances are anticipated to demonstrate the highest growth, driven by advancements in pharmaceutical formulations designed to mitigate abuse potential. Meanwhile, schedule III-controlled substances currently dominate the market, reflecting their established role in various medical applications, particularly in pain management. Pain management remains the largest therapeutic use segment, addressing a wide range of conditions and contributing significantly to market share. Distribution channels play a crucial role in facilitating controlled substance access. Hospital pharmacies take the lead, ensuring secure and regulated dispensing, while retail pharmacies serve as a convenient channel for patients to access these medications. Indication-wise, chronic pain maintains its prominence as the primary indication, addressing a broad spectrum of patient needs.

The rising prevalence of chronic health diseases, expanding awareness about the benefits of controlled substances, increasing demand for alternative medicine, and increased acceptance of electronic prescriptions for controlled substances are all expected to contribute to market expansion in the long run. The rising geriatric and pediatric population globally is one of the main factors driving market expansion, owing mostly to non-adherence to medication regimens, which is widespread among these age groups. Geriatric people have impaired physical, mental, and biological functioning, which affects their medication usage. Furthermore, their bodies are unable to endure excessive doses and strong adverse effects of medications. As a result, the need for controlled-release medication delivery systems is predicted to rise in tandem with the patient population.

With the bulk of the market revenue share, North America is the dominant regional market on a worldwide scale. Government programmes that support the development of controlled-release medication delivery and increased R&D spending are anticipated to drive market expansion in the area. On the other hand, Asia Pacific is expected to have the greatest CAGR during the predicted period. The region has gained global prominence as the pharmaceutical sector has grown. The rapid expansion of the Indian and Chinese pharmaceutical industries is having a beneficial impact on the regional market. Another important aspect driving product acceptance in Japan is the country’s high senior population.

What Are The Main Drivers Of The Global Controlled Substance Market?

The main drivers of the global controlled substance market include the rising prevalence of chronic pain and related medical conditions, a growing aging population with increased healthcare needs, and the continuous development of pharmaceutical innovations for pain management. Moreover, the increasing regulatory focus on addressing substance abuse and diversion through stricter monitoring and prescription guidelines fuels the demand for compliance solutions and alternative pain relief therapies. Emerging markets with expanding healthcare infrastructure and evolving patient demographics are also contributing to market growth, along with ongoing research into the therapeutic potential of controlled substances in various medical applications.

What Are The Major Challenges Faced By The Global Controlled Substance Market?

The global controlled substance market faces significant challenges, primarily stemming from the need to strike a delicate balance between ensuring access to essential medications and preventing misuse, diversion, and abuse. Key challenges include the opioid epidemic and the associated regulatory crackdown, leading to stricter prescribing guidelines and increased scrutiny. The market grapples with drug diversion through illegal online pharmacies and illicit distribution networks, requiring ongoing efforts to strengthen monitoring and enforcement. Counterfeit controlled substances pose risks to patient safety and market integrity. Regulatory complexities and varying compliance requirements across regions can be burdensome for industry participants. Besides, ethical considerations surrounding the responsible use of controlled substances and public stigma associated with certain compounds present ongoing challenges for the industry.

What Are The Growth Opportunities In The Global Controlled Substance Market?

The global controlled substance market presents several growth opportunities, including the development of novel, non-opioid pain management solutions to address the opioid crisis and the increasing demand for alternative therapies. The expansion of medical marijuana legalization and the emergence of cannabis-based pharmaceuticals offer avenues for market growth. Furthermore, the integration of telemedicine and digital health solutions for controlled substance prescribing and monitoring has gained momentum, particularly in the context of the COVID-19 pandemic, creating new opportunities for technology companies and healthcare providers. In addition, the ongoing exploration of controlled substances like psychedelics in medical applications and the adoption of advanced technologies such as blockchain for supply chain transparency offer promising directions for market expansion.

Market Drivers

Several factors drive the global controlled substance market. The following are the key drivers of the global controlled substance market:

Rising Prevalence of Chronic Pain and Related Medical Conditions

One of the primary drivers of the controlled substance market growth is the escalating prevalence of chronic pain and related medical conditions worldwide. The world’s population is aging, with a substantial increase in the elderly demographic, leading to a heightened occurrence of age-related ailments such as osteoarthritis and chronic back pain, which demand sustained pain management solutions. According to the United Nations, the worldwide elderly population will reach 2.1 billion by 2050. Moreover, the surge in chronic diseases like cancer, diabetes, and cardiovascular disorders worldwide has intensified the need for controlled substance-based pain relief, as these conditions frequently entail persistent pain as a symptom or side effect of treatments. The WHO estimates that 71% of all fatalities worldwide are caused by non-communicable diseases, underscoring the need for effective drugs and promoting the pharmaceutical industry’s expansion.

Market Restraints

The global controlled substance market faces challenges that may hinder its growth. These include the following:

Stringent Regulatory Frameworks and Compliance Burdens

A key restraint in the global controlled substance market is the intricate and stringent regulatory frameworks governing the production, distribution, and use of controlled substances. Government agencies, such as the US Drug Enforcement Administration (DEA), impose strict regulations to prevent misuse, diversion, and abuse of these substances. These regulations require manufacturers, distributors, healthcare providers, and pharmacies to adhere to complex and often changing compliance requirements, including precise record-keeping, security measures, and reporting obligations. Businesses working in this area may find the cost of compliance to be administratively and financially onerous given that non-compliance can result in serious legal repercussions and reputational harm. Moreover, regulatory changes and varying requirements across different regions and countries further compound the challenge of navigating the global controlled substance market, hindering market growth and expansion.

Opportunities

The global controlled substance market offers significant growth opportunities. These include the following:

Emerging R&D of Non-Opioid Alternatives and Novel Formulations

The ongoing research & development of non-opioid alternatives for pain management and innovative controlled substance formulations represent a major growth opportunity for the global market. In response to the opioid epidemic and concerns about addiction and overdose, there is a strong focus on discovering and commercializing non-opioid pain relief options. Pharmaceutical companies are heavily investing in novel medications that target pain pathways differently, reducing the risk of addiction and side effects associated with traditional opioids. Moreover, the development of controlled-release formulations, transdermal patches, and other drug-delivery technologies aims to enhance the safety and effectiveness of controlled substances. These innovations not only address the critical public health issue of opioid misuse but also offer a competitive edge for companies in the controlled substance market by meeting the growing demand for safer and more productive pain management solutions.

Competitive Landscape

controlled substance market competitive (1) (1)

Key Players

The competitive landscape of the global controlled substance market is characterized by a mix of established pharmaceutical giants, innovative technology firms, and emerging players in addiction treatment and precision medicine. The following are some of the top market players and their market shares:

  • Johnson & Johnson
  • Pfizer
  • Sanofi
  • Merck & Co.
  • Gilead Sciences
  • Amgen
  • Novartis
  • AbbVie
  • GlaxoSmithKline
  • AstraZeneca
  • Bristol-Myers Squibb
  • Eli Lilly
  • Teva Pharmaceutical
  • Bayer
  • Novo Nordisk
  • Allergan
  • Takeda Pharmaceutical
  • Boehringer Ingelheim
  • Aspen Pharmacare
  • Astellas Pharma
  • Others

These leading market companies invest significantly in R&D to create innovative formulations, delivery systems, and non-opioid alternatives for pain management, enhancing their competitive edge. These established pharmaceutical companies dominate the global market due to their expertise in manufacturing and distributing controlled substances. They often have diversified portfolios that include both controlled and non-controlled medications. Firms specializing in telemedicine and digital health are increasingly important, providing solutions for remote prescribing and monitoring of controlled substances with the potential to disrupt traditional healthcare models.

In December 2022, AbbVie, a leading biotech business in the United States, announced that it had acquired FDA approval for Cariprazine (Vraylar) as an adjunctive therapy for severe depressive disorders in adults.

In June 2022, Bicycle Health, a virtual opioid addiction treatment firm, raised USD 50 million in a series B fundraising round headed by InterAlpen Partners toward virtual opioid use disorder therapy.

Summary of Key Findings

  • The growing preference of physicians for controlled release systems due to benefits such as high therapeutic efficacy, improved patient compliance, and lower treatment costs is one of the primary factors supporting the controlled substance market growth.
  • Market segmented by scheduling or classification, therapeutic use, distribution channel, patient demographics, indication, and region.
  • Hospital pharmacies dominate the distribution landscape, ensuring secure and regulated dispensing of controlled substances, while retail pharmacies offer accessibility to patients.
  • Chronic pain and substance use disorder are prominent indications, with substance use disorder expected to exhibit substantial growth.
  • Patient-centric approaches are gaining prominence, emphasizing personalized treatment plans and precise dosing based on genetic and pharmacogenomic profiles, enhancing treatment outcomes.
  • Pharmaceuticals and pain management solutions dominate the market, with a focus on developing safer, non-opioid alternatives.

Shape Your Report to Specific Countries or Regions & Enjoy 30% Off!

Future Outlook

  • Advancements in nanotechnology and drug formulation are driving innovation in controlled substance delivery, making it possible to administer medications with greater precision and reduced side effects.
  • Governments are implementing initiatives to combat opioid misuse and addiction, propelling the development of abuse-deterrent formulations and stricter prescribing guidelines.
  • The global controlled substance market is expected to continue its growth trajectory, driven by the rising demand for pain management and addiction treatment solutions.
  • Rising R&D activities will intensify to discover and commercialize non-opioid alternatives for pain relief, addressing concerns about opioid addiction and overdose.

Segmentation

  • By Scheduling or Classification
    • Schedule I Controlled Substances
    • Schedule II Controlled Substances
    • Schedule III Controlled Substances
    • Schedule IV Controlled Substances
    • Schedule V Controlled Substances
    • Unscheduled Substances
  • By Therapeutic Use
    • Pain Management
    • Psychiatric Medications
    • Substance Abuse Treatment
    • Anesthesia
    • Other Therapeutic Uses
  • By Distribution Channel
    • Retail Pharmacies
    • Hospital Pharmacies
    • Specialty Clinics
    • Online Pharmacies
  • By Patient Demographics
    • Adults
    • Pediatric
  • By Indication
    • Chronic Pain
    • Acute Pain
    • Substance Use Disorder
    • Mental Health Disorders
  • By Region
    • North America
      • The U.S.
      • Canada
      • Mexico
    • Europe
      • Germany
      • France
      • The U.K.
      • Italy
      • Spain
      • Rest of Europe
    • Asia Pacific
      • China
      • Japan
      • India
      • South Korea
      • South-east Asia
      • Rest of Asia Pacific
    • Latin America
      • Brazil
      • Argentina
      • Rest of Latin America
    • Middle East & Africa
      • GCC Countries
      • South Africa
      • Rest of the Middle East and Africa

Adjacent Markets

In the controlled substance market, several adjacent markets have high revenue growth opportunities. The key adjacent markets for the controlled substance market –

controlled substance market adjacent (1)

1. Preface

1.1. Report Description

1.1.1. Purpose of the Report

1.1.2. Target Audience

1.1.3. USP and Key Offerings

1.2. Research Scope

1.3. Market Introduction


2. Executive Summary

2.1. Market Snapshot: Global Controlled Substance Market

2.1.1. Global Controlled Substance Market, By Scheduling or Classification

2.1.2. Global Controlled Substance Market, By Therapeutic Use

2.1.3. Global Controlled Substance Market, By Distribution Channel

2.1.4. Global Controlled Substance Market, By Patient Demographics

2.1.5. Global Controlled Substance Market, By Indication

2.1.6. Global Controlled Substance Market, By Region

2.2. Insights from Primary Respondents


3. Market Dynamics & Factors Analysis

3.1. Introduction

3.1.1. Global Controlled Substance Market Value, 2017-2030, (US$ Mn)

3.1.2. Y-o-Y Growth Trend Analysis

3.2. Market Dynamics

3.2.1. Controlled Substance Market Drivers

3.2.2. Controlled Substance Market Restraints

3.2.3. Controlled Substance Market Opportunities

3.2.4. Major Controlled Substance Industry Challenges

3.3. Growth and Development Patterns

3.4. Investment Feasibility Analysis

3.5. Market Opportunity Analysis

3.5.1. Scheduling or Classification

3.5.2. Therapeutic Use

3.5.3. Distribution Channel

3.5.4. Patient Demographics

3.5.5. Indication

3.5.6. Geography


4. Market Competitive Landscape Analysis

4.1. Company Market Share Analysis, 2022

4.1.1. Global Controlled Substance Market: Company Market Share, Value 2022

4.1.2. Global Controlled Substance Market: Top 6 Company Market Share, Value 2022

4.1.3. Global Controlled Substance Market: Top 3 Company Market Share, Value 2022

4.2. Global Controlled Substance Market: Company Revenue Share Analysis, 2022

4.3. Company Assessment Metrics, 2022

4.3.1. Stars

4.3.2. Emerging Leaders

4.3.3. Pervasive Players

4.3.4. Participants

4.4. Startups/SMEs Assessment Metrics, 2022

4.4.1. Progressive Companies

4.4.2. Responsive Companies

4.4.3. Dynamic Companies

4.4.4. Starting Blocks

4.5. Strategic Development

4.5.1. Acquisition and Mergers

4.5.2. New Product Launch

4.5.3. Regional Expansion

4.5.4. Partnerships

4.6. Key Player Product Matrix

4.7. Potential for New Players in the Global Controlled Substance Market


5. Premium Insights

5.1. STAR (Situation, Task, Action, Results) Analysis

5.2. Porter’s Five Forces Analysis

5.2.1. Threat of New Entrants

5.2.2. Bargaining Power of Buyers/Consumers

5.2.3. Bargaining Power of Suppliers

5.2.4. Threat of Substitute Types

5.2.5. Intensity of Competitive Rivalry

5.3. PESTEL Analysis

5.3.1. Political Factors

5.3.2. Economic Factors

5.3.3. Social Factors

5.3.4. Technological Factors

5.3.5. Environmental Factors

5.3.6. Legal Factors

5.4. Key Market Trends

5.4.1. Demand Side Trends

5.4.2. Supply Side Trends

5.5. Value Chain Analysis

5.6. Technology Analysis

5.6.1. Research and development in the global market

5.6.2. Patent Analysis

5.6.3. Emerging technologies and their potential disruption to the market

5.7. Consumer Behaviour Analysis

5.7.1. Consumer Preferences and Expectations

5.7.2. Factors Influencing Consumer Buying Decisions

5.7.2.1. North America

5.7.2.2. Europe

5.7.2.3. Asia Pacific

5.7.2.4. Latin America

5.7.2.5. Middle East and Africa

5.7.3. Consumer Pain Points

5.8. Analysis and Recommendations

5.9. Adjacent Market Analysis


6. Market Positioning of Key Players, 2022

6.1. Company market share of key players, 2022

6.2. Competitive Benchmarking

6.3. Market Positioning of Key Vendors

6.4. Geographical Presence Analysis

6.5. Major Strategies Adopted by Key Players

6.5.1. Key Strategies Analysis

6.5.2. Mergers and Acquisitions

6.5.3. Partnerships

6.5.4. Product Launch

6.5.5. Geographical Expansion

6.5.6. Others


7. Impact Analysis of COVID-19 and Russia – Ukraine War on Controlled Substance Market

7.1. Ukraine-Russia War Impact

7.1.1. Uncertainty and Economic Instability

7.1.2. Supply chain disruptions

7.1.3. Regional market shifts

7.1.4. Shift in government priorities

7.2. COVID-19 Impact Analysis

7.2.1. Supply Chain Disruptions

7.2.2. Demand Fluctuations

7.2.3. Shift in Product Mix

7.2.4. Reduced Industrial Activity

7.2.5. Regional Impact Analysis

7.2.5.1. North America

7.2.5.2. Europe

7.2.5.3. Asia Pacific

7.2.5.4. Latin America

7.2.5.5. Middle East and Africa


8. Global Controlled Substance Market, By Scheduling or Classification

8.1. Global Controlled Substance Market Overview, by Scheduling or Classification

8.1.1. Global Controlled Substance Market Revenue Share, By Scheduling or Classification, 2022 Vs 2030 (in %)

8.2. Schedule I Controlled Substances

8.2.1. Global Controlled Substance Market, By Schedule I Controlled Substances, By Region, 2017-2030 (US$ Mn)

8.2.2. Market Dynamics for Schedule I Controlled Substances

8.2.2.1. Drivers

8.2.2.2. Restraints

8.2.2.3. Opportunities

8.2.2.4. Trends

8.3. Schedule II Controlled Substances

8.3.1. Global Controlled Substance Market, By Schedule II Controlled Substances, By Region, 2017-2030 (US$ Mn)

8.3.2. Market Dynamics for Schedule II Controlled Substances

8.3.2.1. Drivers

8.3.2.2. Restraints

8.3.2.3. Opportunities

8.3.2.4. Trends

8.4. Schedule III Controlled Substances

8.4.1. Global Controlled Substance Market, By Schedule III Controlled Substances, By Region, 2017-2030 (US$ Mn)

8.4.2. Market Dynamics for Schedule III Controlled Substances

8.4.2.1. Drivers

8.4.2.2. Restraints

8.4.2.3. Opportunities

8.4.2.4. Trends

8.5. Schedule IV Controlled Substances

8.5.1. Global Controlled Substance Market, By Schedule IV Controlled Substances, By Region, 2017-2030 (US$ Mn)

8.5.2. Market Dynamics for Schedule IV Controlled Substances

8.5.2.1. Drivers

8.5.2.2. Restraints

8.5.2.3. Opportunities

8.5.2.4. Trends

8.6. Schedule V Controlled Substances

8.6.1. Global Controlled Substance Market, By Schedule V Controlled Substances, By Region, 2017-2030 (US$ Mn)

8.6.2. Market Dynamics for Schedule V Controlled Substances

8.6.2.1. Drivers

8.6.2.2. Restraints

8.6.2.3. Opportunities

8.6.2.4. Trends

8.7. Unscheduled Substances

8.7.1. Global Controlled Substance Market, By Unscheduled Substances, By Region, 2017-2030 (US$ Mn)

8.7.2. Market Dynamics for Unscheduled Substances

8.7.2.1. Drivers

8.7.2.2. Restraints

8.7.2.3. Opportunities

8.7.2.4. Trends


9. Global Controlled Substance Market, By Therapeutic Use

9.1. Global Controlled Substance Market Overview, by Therapeutic Use

9.1.1. Global Controlled Substance Market Revenue Share, By Therapeutic Use, 2022 Vs 2030 (in %)

9.2. Pain Management

9.2.1. Global Controlled Substance Market, By Pain Management, By Region, 2017-2030 (US$ Mn)

9.2.2. Market Dynamics for Pain Management

9.2.2.1. Drivers

9.2.2.2. Restraints

9.2.2.3. Opportunities

9.2.2.4. Trends

9.3. Psychiatric Medications

9.3.1. Global Controlled Substance Market, By Psychiatric Medications, By Region, 2017-2030 (US$ Mn)

9.3.2. Market Dynamics for Psychiatric Medications

9.3.2.1. Drivers

9.3.2.2. Restraints

9.3.2.3. Opportunities

9.3.2.4. Trends

9.4. Substance Abuse Treatment

9.4.1. Global Controlled Substance Market, By Substance Abuse Treatment, By Region, 2017-2030 (US$ Mn)

9.4.2. Market Dynamics for Substance Abuse Treatment

9.4.2.1. Drivers

9.4.2.2. Restraints

9.4.2.3. Opportunities

9.4.2.4. Trends

9.5. Anesthesia

9.5.1. Global Controlled Substance Market, By Anesthesia, By Region, 2017-2030 (US$ Mn)

9.5.2. Market Dynamics for Anesthesia

9.5.2.1. Drivers

9.5.2.2. Restraints

9.5.2.3. Opportunities

9.5.2.4. Trends

9.6. Other Therapeutic Uses

9.6.1. Global Controlled Substance Market, By Other Therapeutic Uses, By Region, 2017-2030 (US$ Mn)

9.6.2. Market Dynamics for Other Therapeutic Uses

9.6.2.1. Drivers

9.6.2.2. Restraints

9.6.2.3. Opportunities

9.6.2.4. Trends


10. Global Controlled Substance Market, By Distribution Channel

10.1. Global Controlled Substance Market Overview, by Distribution Channel

10.1.1. Global Controlled Substance Market Revenue Share, By Distribution Channel, 2022 Vs 2030 (in %)

10.2. Retail Pharmacies

10.2.1. Global Controlled Substance Market, By Retail Pharmacies, By Region, 2017-2030 (US$ Mn)

10.2.2. Market Dynamics for Retail Pharmacies

10.2.2.1. Drivers

10.2.2.2. Restraints

10.2.2.3. Opportunities

10.2.2.4. Trends

10.3. Hospital Pharmacies

10.3.1. Global Controlled Substance Market, By Hospital Pharmacies, By Region, 2017-2030 (US$ Mn)

10.3.2. Market Dynamics for Hospital Pharmacies

10.3.2.1. Drivers

10.3.2.2. Restraints

10.3.2.3. Opportunities

10.3.2.4. Trends

10.4. Specialty Clinics

10.4.1. Global Controlled Substance Market, By Specialty Clinics, By Region, 2017-2030 (US$ Mn)

10.4.2. Market Dynamics for Specialty Clinics

10.4.2.1. Drivers

10.4.2.2. Restraints

10.4.2.3. Opportunities

10.4.2.4. Trends

10.5. Online Pharmacies

10.5.1. Global Controlled Substance Market, By Online Pharmacies, By Region, 2017-2030 (US$ Mn)

10.5.2. Market Dynamics for Online Pharmacies

10.5.2.1. Drivers

10.5.2.2. Restraints

10.5.2.3. Opportunities

10.5.2.4. Trends


11. Global Controlled Substance Market, By Patient Demographics

11.1. Global Controlled Substance Market Overview, by Patient Demographics

11.1.1. Global Controlled Substance Market Revenue Share, By Patient Demographics, 2022 Vs 2030 (in %)

11.2. Adults

11.2.1. Global Controlled Substance Market, By Adults, By Region, 2017-2030 (US$ Mn)

11.2.2. Market Dynamics for Adults

11.2.2.1. Drivers

11.2.2.2. Restraints

11.2.2.3. Opportunities

11.2.2.4. Trends

11.3. Pediatric

11.3.1. Global Controlled Substance Market, By Pediatric, By Region, 2017-2030 (US$ Mn)

11.3.2. Market Dynamics for Pediatric

11.3.2.1. Drivers

11.3.2.2. Restraints

11.3.2.3. Opportunities

11.3.2.4. Trends


12. Global Controlled Substance Market, By Indication

12.1. Global Controlled Substance Market Overview, by Indication

12.1.1. Global Controlled Substance Market Revenue Share, By Indication, 2022 Vs 2030 (in %)

12.2. Chronic Pain

12.2.1. Global Controlled Substance Market, By Chronic Pain, By Region, 2017-2030 (US$ Mn)

12.2.2. Market Dynamics for Chronic Pain

12.2.2.1. Drivers

12.2.2.2. Restraints

12.2.2.3. Opportunities

12.2.2.4. Trends

12.3. Acute Pain

12.3.1. Global Controlled Substance Market, By Acute Pain, By Region, 2017-2030 (US$ Mn)

12.3.2. Market Dynamics for Acute Pain

12.3.2.1. Drivers

12.3.2.2. Restraints

12.3.2.3. Opportunities

12.3.2.4. Trends

12.4. Substance Use Disorder

12.4.1. Global Controlled Substance Market, By Substance Use Disorder, By Region, 2017-2030 (US$ Mn)

12.4.2. Market Dynamics for Substance Use Disorder

12.4.2.1. Drivers

12.4.2.2. Restraints

12.4.2.3. Opportunities

12.4.2.4. Trends

12.5. Mental Health Disorders

12.5.1. Global Controlled Substance Market, By Mental Health Disorders, By Region, 2017-2030 (US$ Mn)

12.5.2. Market Dynamics for Mental Health Disorders

12.5.2.1. Drivers

12.5.2.2. Restraints

12.5.2.3. Opportunities

12.5.2.4. Trends


13. Global Controlled Substance Market, By Region

13.1. Global Controlled Substance Market Overview, by Region

13.1.1. Global Controlled Substance Market, By Region, 2022 vs 2030 (in%)

13.2. Scheduling or Classification

13.2.1. Global Controlled Substance Market, By Scheduling or Classification, 2017-2030 (US$ Mn)

13.3. Therapeutic Use

13.3.1. Global Controlled Substance Market, By Therapeutic Use, 2017-2030 (US$ Mn)

13.4. Distribution Channel

13.4.1. Global Controlled Substance Market, By Distribution Channel, 2017-2030 (US$ Mn)

13.5. Patient Demographics

13.5.1. Global Controlled Substance Market, By Patient Demographics, 2017-2030 (US$ Mn)

13.6. Indication

13.6.1. Global Controlled Substance Market, By Indication, 2017-2030 (US$ Mn)


14. North America Controlled Substance Market Analysis

14.1. Overview

14.1.1. Market Dynamics for North America

14.1.1.1. Drivers

14.1.1.2. Restraints

14.1.1.3. Opportunities

14.1.1.4. Trends

14.2. North America Controlled Substance Market, by Scheduling or Classification, 2017-2030(US$ Mn)

14.2.1. Overview

14.2.2. SRC Analysis

14.3. North America Controlled Substance Market, by Therapeutic Use, 2017-2030(US$ Mn)

14.3.1. Overview

14.3.2. SRC Analysis

14.4. North America Controlled Substance Market, by Distribution Channel, 2017-2030(US$ Mn)

14.4.1. Overview

14.4.2. SRC Analysis

14.5. North America Controlled Substance Market, by Patient Demographics, 2017-2030(US$ Mn)

14.5.1. Overview

14.5.2. SRC Analysis

14.6. North America Controlled Substance Market, by Indication, 2017-2030(US$ Mn)

14.6.1. Overview

14.6.2. SRC Analysis

14.7. North America Controlled Substance Market, by Country, 2017-2030 (US$ Mn)

14.7.1. North America Controlled Substance Market, by Country, 2022 Vs 2030 (in%)

14.7.2. U.S.

14.7.3. Canada

14.7.4. Mexico


15. Europe Controlled Substance Market Analysis

15.1. Overview

15.1.1. Market Dynamics for North America

15.1.1.1. Drivers

15.1.1.2. Restraints

15.1.1.3. Opportunities

15.1.1.4. Trends

15.2. Europe Controlled Substance Market, by Scheduling or Classification, 2017-2030(US$ Mn)

15.2.1. Overview

15.2.2. SRC Analysis

15.3. Europe Controlled Substance Market, by Therapeutic Use, 2017-2030(US$ Mn)

15.3.1. Overview

15.3.2. SRC Analysis

15.4. Europe Controlled Substance Market, by Distribution Channel, 2017-2030(US$ Mn)

15.4.1. Overview

15.4.2. SRC Analysis

15.5. Europe Controlled Substance Market, by Patient Demographics, 2017-2030(US$ Mn)

15.5.1. Overview

15.5.2. SRC Analysis

15.6. Europe Controlled Substance Market, by Indication, 2017-2030(US$ Mn)

15.6.1. Overview

15.6.2. SRC Analysis

15.7. Europe Controlled Substance Market, by Country, 2017-2030 (US$ Mn)

15.7.1. Europe Controlled Substance Market, by Country, 2022 Vs 2030 (in%)

15.7.2. UK

15.7.3. France

15.7.4. Germany

15.7.5. Italy

15.7.6. Spain

15.7.7. Benelux

15.7.8. Russia

15.7.9. Rest of Europe


16. Asia Pacific Controlled Substance Market Analysis

16.1. Overview

16.1.1. Market Dynamics for North America

16.1.1.1. Drivers

16.1.1.2. Restraints

16.1.1.3. Opportunities

16.1.1.4. Trends

16.2. Asia Pacific Controlled Substance Market, by Scheduling or Classification, 2017-2030(US$ Mn)

16.2.1. Overview

16.2.2. SRC Analysis

16.3. Asia Pacific Controlled Substance Market, by Therapeutic Use, 2017-2030(US$ Mn)

16.3.1. Overview

16.3.2. SRC Analysis

16.4. Asia Pacific Controlled Substance Market, by Distribution Channel, 2017-2030(US$ Mn)

16.4.1. Overview

16.4.2. SRC Analysis

16.5. Asia Pacific Controlled Substance Market, by Patient Demographics, 2017-2030(US$ Mn)

16.5.1. Overview

16.5.2. SRC Analysis

16.6. Asia Pacific Controlled Substance Market, by Indication, 2017-2030(US$ Mn)

16.6.1. Overview

16.6.2. SRC Analysis

16.7. Asia Pacific Controlled Substance Market, by Country, 2017-2030 (US$ Mn)

16.7.1. Asia Pacific Controlled Substance Market, by Country, 2022 Vs 2030 (in%)

16.7.2. China

16.7.3. Japan

16.7.4. India

16.7.5. South Korea

16.7.6. South East Asia

16.7.7. Rest of Asia Pacific


17. Latin America Controlled Substance Market Analysis

17.1. Overview

17.1.1. Market Dynamics for North America

17.1.1.1. Drivers

17.1.1.2. Restraints

17.1.1.3. Opportunities

17.1.1.4. Trends

17.2. Latin America Controlled Substance Market, by Scheduling or Classification, 2017-2030(US$ Mn)

17.2.1. Overview

17.2.2. SRC Analysis

17.3. Latin America Controlled Substance Market, by Therapeutic Use, 2017-2030(US$ Mn)

17.3.1. Overview

17.3.2. SRC Analysis

17.4. Latin America Controlled Substance Market, by Distribution Channel, 2017-2030(US$ Mn)

17.4.1. Overview

17.4.2. SRC Analysis

17.5. Latin America Controlled Substance Market, by Patient Demographics, 2017-2030(US$ Mn)

17.5.1. Overview

17.5.2. SRC Analysis

17.6. Latin America Controlled Substance Market, by Indication, 2017-2030(US$ Mn)

17.6.1. Overview

17.6.2. SRC Analysis

17.7. Latin America Controlled Substance Market, by Country, 2017-2030 (US$ Mn)

17.7.1. Latin America Controlled Substance Market, by Country, 2022 Vs 2030 (in%)

17.7.2. Brazil

17.7.3. Argentina

17.7.4. Rest of Latin America


18. Middle East Controlled Substance Market Analysis

18.1. Overview

18.1.1. Market Dynamics for North America

18.1.1.1. Drivers

18.1.1.2. Restraints

18.1.1.3. Opportunities

18.1.1.4. Trends

18.2. Middle East Controlled Substance Market, by Scheduling or Classification, 2017-2030(US$ Mn)

18.2.1. Overview

18.2.2. SRC Analysis

18.3. Middle East Controlled Substance Market, by Therapeutic Use, 2017-2030(US$ Mn)

18.3.1. Overview

18.3.2. SRC Analysis

18.4. Middle East Controlled Substance Market, by Distribution Channel, 2017-2030(US$ Mn)

18.4.1. Overview

18.4.2. SRC Analysis

18.5. Middle East Controlled Substance Market, by Patient Demographics, 2017-2030(US$ Mn)

18.5.1. Overview

18.5.2. SRC Analysis

18.6. Middle East Controlled Substance Market, by Indication, 2017-2030(US$ Mn)

18.6.1. Overview

18.6.2. SRC Analysis

18.7. Middle East Controlled Substance Market, by Country, 2017-2030 (US$ Mn)

18.7.1. Middle East Controlled Substance Market, by Country, 2022 Vs 2030 (in%)

18.7.2. UAE

18.7.3. Saudi Arabia

18.7.4. Rest of Middle East


19. Africa Controlled Substance Market Analysis

19.1. Overview

19.1.1. Market Dynamics for North America

19.1.1.1. Drivers

19.1.1.2. Restraints

19.1.1.3. Opportunities

19.1.1.4. Trends

19.2. Africa Controlled Substance Market, by Scheduling or Classification, 2017-2030(US$ Mn)

19.2.1. Overview

19.2.2. SRC Analysis

19.3. Africa Controlled Substance Market, by Therapeutic Use, 2017-2030(US$ Mn)

19.3.1. Overview

19.3.2. SRC Analysis

19.4. Africa Controlled Substance Market, by Distribution Channel, 2017-2030(US$ Mn)

19.4.1. Overview

19.4.2. SRC Analysis

19.5. Africa Controlled Substance Market, by Patient Demographics, 2017-2030(US$ Mn)

19.5.1. Overview

19.5.2. SRC Analysis

19.6. Africa Controlled Substance Market, by Indication, 2017-2030(US$ Mn)

19.6.1. Overview

19.6.2. SRC Analysis

19.7. Africa Controlled Substance Market, by Country, 2017-2030 (US$ Mn)

19.7.1. Middle East Controlled Substance Market, by Country, 2022 Vs 2030 (in%)

19.7.2. South Africa

19.7.3. Egypt

19.7.4. Rest of Africa


20. Company Profiles

20.1. Johnson & Johnson

20.1.1. Company Overview

20.1.2. Products/Services Portfolio

20.1.3. Geographical Presence

20.1.4. SWOT Analysis

20.1.5. Financial Summary

20.1.5.1. Market Revenue and Net Profit (2019-2022)

20.1.5.2. Business Segment Revenue Analysis

20.1.5.3. Geographical Revenue Analysis

20.2. Pfizer

20.3. Sanofi

20.4. Merck & Co.

20.5. Gilead Sciences

20.6. Amgen

20.7. Novartis

20.8. AbbVie

20.9. GlaxoSmithKline

20.10. AstraZeneca

20.11. Bristol-Myers Squibb

20.12. Eli Lilly

20.13. Teva Pharmaceutical

20.14. Bayer

20.15. Novo Nordisk

20.16. Allergan

20.17. Takeda Pharmaceutical

20.18. Boehringer Ingelheim

20.19. Aspen Pharmacare

20.20. Astellas Pharma

20.21. Others

21. Research Methodology

21.1. Research Methodology

21.2. Phase I – Secondary Research

21.3. Phase II – Data Modelling

21.3.1. Company Share Analysis Model

21.3.2. Revenue Based Modelling

21.4. Phase III – Primary Research

21.5. Research Limitations

21.5.1. Assumptions


List of Figures

FIG. 1 Global Controlled Substance Market: Research Methodology

FIG. 2 Market Size Estimation – Top Down & Bottom Up Approach

FIG. 3 Global Controlled Substance Market Segmentation

FIG. 4 Global Controlled Substance Market, by Scheduling or Classification, 2022 (US$ Mn)

FIG. 5 Global Controlled Substance Market, by Therapeutic Use, 2022 (US$ Mn)

FIG. 6 Global Controlled Substance Market, by Distribution Channel, 2022 (US$ Mn)

FIG. 7 Global Controlled Substance Market, by Patient Demographics, 2022 (US$ Mn)

FIG. 8 Global Controlled Substance Market, by Indication, 2022 (US$ Mn)

FIG. 9 Global Controlled Substance Market, by Geography, 2022 (US$ Mn)

FIG. 10 Attractive Investment Proposition, by Scheduling or Classification, 2022

FIG. 11 Attractive Investment Proposition, by Therapeutic Use, 2022

FIG. 12 Attractive Investment Proposition, by Distribution Channel, 2022

FIG. 13 Attractive Investment Proposition, by Patient Demographics, 2022

FIG. 14 Attractive Investment Proposition, by Indication, 2022

FIG. 15 Attractive Investment Proposition, by Geography, 2022

FIG. 16 Global Market Share Analysis of Key Controlled Substance Market Manufacturers, 2022

FIG. 17 Global Market Positioning of Key Controlled Substance Market Manufacturers, 2022

FIG. 18 Global Controlled Substance Market Value Contribution, By Scheduling or Classification, 2022 & 2030 (Value %)

FIG. 19 Global Controlled Substance Market, by Schedule I Controlled Substances, Value, 2017-2030 (US$ Mn)

FIG. 20 Global Controlled Substance Market, by Schedule II Controlled Substances, Value, 2017-2030 (US$ Mn)

FIG. 21 Global Controlled Substance Market, by Schedule III Controlled Substances, Value, 2017-2030 (US$ Mn)

FIG. 22 Global Controlled Substance Market, by Schedule IV Controlled Substances, Value, 2017-2030 (US$ Mn)

FIG. 23 Global Controlled Substance Market, by Schedule V Controlled Substances, Value, 2017-2030 (US$ Mn)

FIG. 24 Global Controlled Substance Market, by Unscheduled Substances, Value, 2017-2030 (US$ Mn)

FIG. 25 Global Controlled Substance Market Value Contribution, By Therapeutic Use, 2022 & 2030 (Value %)

FIG. 26 Global Controlled Substance Market, by Pain Management, Value, 2017-2030 (US$ Mn)

FIG. 27 Global Controlled Substance Market, by Psychiatric Medications, Value, 2017-2030 (US$ Mn)

FIG. 28 Global Controlled Substance Market, by Substance Abuse Treatment, Value, 2017-2030 (US$ Mn)

FIG. 29 Global Controlled Substance Market, by Anesthesia, Value, 2017-2030 (US$ Mn)

FIG. 30 Global Controlled Substance Market, by Other Therapeutic Uses, Value, 2017-2030 (US$ Mn)

FIG. 31 Global Controlled Substance Market Value Contribution, By Distribution Channel, 2022 & 2030 (Value %)

FIG. 32 Global Controlled Substance Market, by Retail Pharmacies, Value, 2017-2030 (US$ Mn)

FIG. 33 Global Controlled Substance Market, by Hospital Pharmacies, Value, 2017-2030 (US$ Mn)

FIG. 34 Global Controlled Substance Market, by Specialty Clinics, Value, 2017-2030 (US$ Mn)

FIG. 35 Global Controlled Substance Market, by Online Pharmacies, Value, 2017-2030 (US$ Mn)

FIG. 36 Global Controlled Substance Market Value Contribution, By Patient Demographics, 2022 & 2030 (Value %)

FIG. 37 Global Controlled Substance Market, by Adults, Value, 2017-2030 (US$ Mn)

FIG. 38 Global Controlled Substance Market, by Pediatric, Value, 2017-2030 (US$ Mn)

FIG. 39 Global Controlled Substance Market Value Contribution, By Indication, 2022 & 2030 (Value %)

FIG. 40 Global Controlled Substance Market, by Chronic Pain, Value, 2017-2030 (US$ Mn)

FIG. 41 Global Controlled Substance Market, by Acute Pain, Value, 2017-2030 (US$ Mn)

FIG. 42 Global Controlled Substance Market, by Substance Use Disorder, Value, 2017-2030 (US$ Mn)

FIG. 43 Global Controlled Substance Market, by Mental Health Disorders, Value, 2017-2030 (US$ Mn)

FIG. 44 North America Controlled Substance Market, 2017-2030 (US$ Mn)

FIG. 45 U.S. Controlled Substance Market, 2017-2030 (US$ Mn)

FIG. 46 Canada Controlled Substance Market, 2017-2030 (US$ Mn)

FIG. 47 Mexico Controlled Substance Market, 2017-2030 (US$ Mn)

FIG. 48 Europe Controlled Substance Market, 2017-2030 (US$ Mn)

FIG. 49 Germany Controlled Substance Market, 2017-2030 (US$ Mn)

FIG. 50 France Controlled Substance Market, 2017-2030 (US$ Mn)

FIG. 51 U.K. Controlled Substance Market, 2017-2030 (US$ Mn)

FIG. 52 Italy Controlled Substance Market, 2017-2030 (US$ Mn)

FIG. 53 Spain Controlled Substance Market, 2017-2030 (US$ Mn)

FIG. 54 Benelux Controlled Substance Market, 2017-2030 (US$ Mn)

FIG. 55 Russia Controlled Substance Market, 2017-2030 (US$ Mn)

FIG. 56 Rest of Europe Controlled Substance Market, 2017-2030 (US$ Mn)

FIG. 57 Asia Pacific Controlled Substance Market, 2017-2030 (US$ Mn)

FIG. 58 China Controlled Substance Market, 2017-2030 (US$ Mn)

FIG. 59 Japan Controlled Substance Market, 2017-2030 (US$ Mn)

FIG. 60 India Controlled Substance Market, 2017-2030 (US$ Mn)

FIG. 61 South Korea Controlled Substance Market, 2017-2030 (US$ Mn)

FIG. 62 South-East Asia Controlled Substance Market, 2017-2030 (US$ Mn)

FIG. 63 Rest of Asia Pacific Controlled Substance Market, 2017-2030 (US$ Mn)

FIG. 64 Latin America Controlled Substance Market, 2017-2030 (US$ Mn)

FIG. 65 Brazil Controlled Substance Market, 2017-2030 (US$ Mn)

FIG. 66 Argentina Controlled Substance Market, 2017-2030 (US$ Mn)

FIG. 67 Rest of Latin America Controlled Substance Market, 2017-2030 (US$ Mn)

FIG. 68 Middle East Controlled Substance Market, 2017-2030 (US$ Mn)

FIG. 69 UAE Controlled Substance Market, 2017-2030 (US$ Mn)

FIG. 70 Saudi Arabia Controlled Substance Market, 2017-2030 (US$ Mn)

FIG. 71 Rest of Middle East Controlled Substance Market, 2017-2030 (US$ Mn)

FIG. 72 Africa Controlled Substance Market, 2017-2030 (US$ Mn)

FIG. 73 South Africa Controlled Substance Market, 2017-2030 (US$ Mn)

FIG. 74 Egypt Controlled Substance Market, 2017-2030 (US$ Mn)

FIG. 75 Rest of Africa Controlled Substance Market, 2017-2030 (US$ Mn)


List of Tables

TABLE 1 Market Snapshot: Global Controlled Substance Market

TABLE 2 Global Controlled Substance Market: Market Drivers Impact Analysis

TABLE 3 Global Controlled Substance Market: Market Restraints Impact Analysis

TABLE 4 Global Controlled Substance Market, by Competitive Benchmarking, 2022

TABLE 5 Global Controlled Substance Market, by Geographical Presence Analysis, 2022

TABLE 6 Global Controlled Substance Market, by Key Strategies Analysis, 2022

TABLE 7 Global Controlled Substance Market, by Schedule I Controlled Substances, By Region, 2017-2022 (US$ Mn)

TABLE 8 Global Controlled Substance Market, by Schedule I Controlled Substances, By Region, 2023-2030 (US$ Mn)

TABLE 9 Global Controlled Substance Market, by Schedule II Controlled Substances, By Region, 2017-2022 (US$ Mn)

TABLE 10 Global Controlled Substance Market, by Schedule II Controlled Substances, By Region, 2023-2030 (US$ Mn)

TABLE 11 Global Controlled Substance Market, by Schedule III Controlled Substances, By Region, 2017-2022 (US$ Mn)

TABLE 12 Global Controlled Substance Market, by Schedule III Controlled Substances, By Region, 2023-2030 (US$ Mn)

TABLE 13 Global Controlled Substance Market, by Schedule IV Controlled Substances, By Region, 2017-2022 (US$ Mn)

TABLE 14 Global Controlled Substance Market, by Schedule IV Controlled Substances, By Region, 2023-2030 (US$ Mn)

TABLE 15 Global Controlled Substance Market, by Schedule V Controlled Substances, By Region, 2017-2022 (US$ Mn)

TABLE 16 Global Controlled Substance Market, by Schedule V Controlled Substances, By Region, 2023-2030 (US$ Mn)

TABLE 17 Global Controlled Substance Market, by Unscheduled Substances, By Region, 2017-2022 (US$ Mn)

TABLE 18 Global Controlled Substance Market, by Unscheduled Substances, By Region, 2023-2030 (US$ Mn)

TABLE 19 Global Controlled Substance Market, by Pain Management, By Region, 2017-2022 (US$ Mn)

TABLE 20 Global Controlled Substance Market, by Pain Management, By Region, 2023-2030 (US$ Mn)

TABLE 21 Global Controlled Substance Market, by Psychiatric Medications, By Region, 2017-2022 (US$ Mn)

TABLE 22 Global Controlled Substance Market, by Psychiatric Medications, By Region, 2023-2030 (US$ Mn)

TABLE 23 Global Controlled Substance Market, by Substance Abuse Treatment, By Region, 2017-2022 (US$ Mn)

TABLE 24 Global Controlled Substance Market, by Substance Abuse Treatment, By Region, 2023-2030 (US$ Mn)

TABLE 25 Global Controlled Substance Market, by Anesthesia, By Region, 2017-2022 (US$ Mn)

TABLE 26 Global Controlled Substance Market, by Anesthesia, By Region, 2023-2030 (US$ Mn)

TABLE 27 Global Controlled Substance Market, by Other Therapeutic Uses, By Region, 2017-2022 (US$ Mn)

TABLE 28 Global Controlled Substance Market, by Other Therapeutic Uses, By Region, 2023-2030 (US$ Mn)

TABLE 29 Global Controlled Substance Market, by Retail Pharmacies, By Region, 2017-2022 (US$ Mn)

TABLE 30 Global Controlled Substance Market, by Retail Pharmacies, By Region, 2023-2030 (US$ Mn)

TABLE 31 Global Controlled Substance Market, by Hospital Pharmacies, By Region, 2017-2022 (US$ Mn)

TABLE 32 Global Controlled Substance Market, by Hospital Pharmacies, By Region, 2023-2030 (US$ Mn)

TABLE 33 Global Controlled Substance Market, by Specialty Clinics, By Region, 2017-2022 (US$ Mn)

TABLE 34 Global Controlled Substance Market, by Specialty Clinics, By Region, 2023-2030 (US$ Mn)

TABLE 35 Global Controlled Substance Market, by Online Pharmacies, By Region, 2017-2022 (US$ Mn)

TABLE 36 Global Controlled Substance Market, by Online Pharmacies, By Region, 2023-2030 (US$ Mn)

TABLE 37 Global Controlled Substance Market, by Adults, By Region, 2017-2022 (US$ Mn)

TABLE 38 Global Controlled Substance Market, by Adults, By Region, 2023-2030 (US$ Mn)

TABLE 39 Global Controlled Substance Market, by Pediatric, By Region, 2017-2022 (US$ Mn)

TABLE 40 Global Controlled Substance Market, by Pediatric, By Region, 2023-2030 (US$ Mn)

TABLE 41 Global Controlled Substance Market, by Chronic Pain, By Region, 2017-2022 (US$ Mn)

TABLE 42 Global Controlled Substance Market, by Chronic Pain, By Region, 2023-2030 (US$ Mn)

TABLE 43 Global Controlled Substance Market, by Acute Pain, By Region, 2017-2022 (US$ Mn)

TABLE 44 Global Controlled Substance Market, by Acute Pain, By Region, 2023-2030 (US$ Mn)

TABLE 45 Global Controlled Substance Market, by Substance Use Disorder, By Region, 2017-2022 (US$ Mn)

TABLE 46 Global Controlled Substance Market, by Substance Use Disorder, By Region, 2023-2030 (US$ Mn)

TABLE 47 Global Controlled Substance Market, by Mental Health Disorders, By Region, 2017-2022 (US$ Mn)

TABLE 48 Global Controlled Substance Market, by Mental Health Disorders, By Region, 2023-2030 (US$ Mn)

TABLE 49 Global Controlled Substance Market, by Scheduling or Classification, 2017-2022 (US$ Mn)

TABLE 50 Global Controlled Substance Market, by Scheduling or Classification, 2023-2030 (US$ Mn)

TABLE 51 Global Controlled Substance Market, by Therapeutic Use, 2017-2022 (US$ Mn)

TABLE 52 Global Controlled Substance Market, by Therapeutic Use, 2023-2030 (US$ Mn)

TABLE 53 Global Controlled Substance Market, by Distribution Channel, 2017-2022 (US$ Mn)

TABLE 54 Global Controlled Substance Market, by Distribution Channel, 2023-2030 (US$ Mn)

TABLE 55 Global Controlled Substance Market, by Patient Demographics, 2017-2022 (US$ Mn)

TABLE 56 Global Controlled Substance Market, by Patient Demographics, 2023-2030 (US$ Mn)

TABLE 57 Global Controlled Substance Market, by Indication, 2017-2022 (US$ Mn)

TABLE 58 Global Controlled Substance Market, by Indication, 2023-2030 (US$ Mn)

TABLE 59 Global Controlled Substance Market, by Region, 2017-2022 (US$ Mn)

TABLE 60 Global Controlled Substance Market, by Region, 2023-2030 (US$ Mn)

TABLE 61 North America Controlled Substance Market, by Scheduling or Classification, 2017-2022 (US$ Mn)

TABLE 62 North America Controlled Substance Market, by Scheduling or Classification, 2023-2030 (US$ Mn)

TABLE 63 North America Controlled Substance Market, by Therapeutic Use, 2017-2022 (US$ Mn)

TABLE 64 North America Controlled Substance Market, by Therapeutic Use, 2023-2030 (US$ Mn)

TABLE 65 North America Controlled Substance Market, by Distribution Channel, 2017-2022 (US$ Mn)

TABLE 66 North America Controlled Substance Market, by Distribution Channel, 2023-2030 (US$ Mn)

TABLE 67 North America Controlled Substance Market, by Patient Demographics, 2017-2022 (US$ Mn)

TABLE 68 North America Controlled Substance Market, by Patient Demographics, 2023-2030 (US$ Mn)

TABLE 69 North America Controlled Substance Market, by Indication, 2017-2022 (US$ Mn)

TABLE 70 North America Controlled Substance Market, by Indication, 2023-2030 (US$ Mn)

TABLE 71 North America Controlled Substance Market, by Country, 2017-2022 (US$ Mn)

TABLE 72 North America Controlled Substance Market, by Country, 2023-2030 (US$ Mn)

TABLE 73 United States Controlled Substance Market, by Scheduling or Classification, 2017-2022 (US$ Mn)

TABLE 74 United States Controlled Substance Market, by Scheduling or Classification, 2023-2030 (US$ Mn)

TABLE 75 United States Controlled Substance Market, by Therapeutic Use, 2017-2022 (US$ Mn)

TABLE 76 United States Controlled Substance Market, by Therapeutic Use, 2023-2030 (US$ Mn)

TABLE 77 United States Controlled Substance Market, by Distribution Channel, 2017-2022 (US$ Mn)

TABLE 78 United States Controlled Substance Market, by Distribution Channel, 2023-2030 (US$ Mn)

TABLE 79 United States Controlled Substance Market, by Patient Demographics, 2017-2022 (US$ Mn)

TABLE 80 United States Controlled Substance Market, by Patient Demographics, 2023-2030 (US$ Mn)

TABLE 81 United States Controlled Substance Market, by Indication, 2017-2022 (US$ Mn)

TABLE 82 United States Controlled Substance Market, by Indication, 2023-2030 (US$ Mn)

TABLE 83 Canada Controlled Substance Market, by Scheduling or Classification, 2017-2022 (US$ Mn)

TABLE 84 Canada Controlled Substance Market, by Scheduling or Classification, 2023-2030 (US$ Mn)

TABLE 85 Canada Controlled Substance Market, by Therapeutic Use, 2017-2022 (US$ Mn)

TABLE 86 Canada Controlled Substance Market, by Therapeutic Use, 2023-2030 (US$ Mn)

TABLE 87 Canada Controlled Substance Market, by Distribution Channel, 2017-2022 (US$ Mn)

TABLE 88 Canada Controlled Substance Market, by Distribution Channel, 2023-2030 (US$ Mn)

TABLE 89 Canada Controlled Substance Market, by Patient Demographics, 2017-2022 (US$ Mn)

TABLE 90 Canada Controlled Substance Market, by Patient Demographics, 2023-2030 (US$ Mn)

TABLE 91 Canada Controlled Substance Market, by Indication, 2017-2022 (US$ Mn)

TABLE 92 Canada Controlled Substance Market, by Indication, 2023-2030 (US$ Mn)

TABLE 93 Mexico Controlled Substance Market, by Scheduling or Classification, 2017-2022 (US$ Mn)

TABLE 94 Mexico Controlled Substance Market, by Scheduling or Classification, 2023-2030 (US$ Mn)

TABLE 95 Mexico Controlled Substance Market, by Therapeutic Use, 2017-2022 (US$ Mn)

TABLE 96 Mexico Controlled Substance Market, by Therapeutic Use, 2023-2030 (US$ Mn)

TABLE 97 Mexico Controlled Substance Market, by Distribution Channel, 2017-2022 (US$ Mn)

TABLE 98 Mexico Controlled Substance Market, by Distribution Channel, 2023-2030 (US$ Mn)

TABLE 99 Mexico Controlled Substance Market, by Patient Demographics, 2017-2022 (US$ Mn)

TABLE 100 Mexico Controlled Substance Market, by Patient Demographics, 2023-2030 (US$ Mn)

TABLE 101 Mexico Controlled Substance Market, by Indication, 2017-2022 (US$ Mn)

TABLE 102 Mexico Controlled Substance Market, by Indication, 2023-2030 (US$ Mn)

TABLE 103 Europe Controlled Substance Market, by Scheduling or Classification, 2017-2022 (US$ Mn)

TABLE 104 Europe Controlled Substance Market, by Scheduling or Classification, 2023-2030 (US$ Mn)

TABLE 105 Europe Controlled Substance Market, by Therapeutic Use, 2017-2022 (US$ Mn)

TABLE 106 Europe Controlled Substance Market, by Therapeutic Use, 2023-2030 (US$ Mn)

TABLE 107 Europe Controlled Substance Market, by Distribution Channel, 2017-2022 (US$ Mn)

TABLE 108 Europe Controlled Substance Market, by Distribution Channel, 2023-2030 (US$ Mn)

TABLE 109 Europe Controlled Substance Market, by Patient Demographics, 2017-2022 (US$ Mn)

TABLE 110 Europe Controlled Substance Market, by Patient Demographics, 2023-2030 (US$ Mn)

TABLE 111 Europe Controlled Substance Market, by Indication, 2017-2022 (US$ Mn)

TABLE 112 Europe Controlled Substance Market, by Indication, 2023-2030 (US$ Mn)

TABLE 113 Europe Controlled Substance Market, by Country, 2017-2022 (US$ Mn)

TABLE 114 Europe Controlled Substance Market, by Country, 2023-2030 (US$ Mn)

TABLE 115 Germany Controlled Substance Market, by Scheduling or Classification, 2017-2022 (US$ Mn)

TABLE 116 Germany Controlled Substance Market, by Scheduling or Classification, 2023-2030 (US$ Mn)

TABLE 117 Germany Controlled Substance Market, by Therapeutic Use, 2017-2022 (US$ Mn)

TABLE 118 Germany Controlled Substance Market, by Therapeutic Use, 2023-2030 (US$ Mn)

TABLE 119 Germany Controlled Substance Market, by Distribution Channel, 2017-2022 (US$ Mn)

TABLE 120 Germany Controlled Substance Market, by Distribution Channel, 2023-2030 (US$ Mn)

TABLE 121 Germany Controlled Substance Market, by Patient Demographics, 2017-2022 (US$ Mn)

TABLE 122 Germany Controlled Substance Market, by Patient Demographics, 2023-2030 (US$ Mn)

TABLE 123 Germany Controlled Substance Market, by Indication, 2017-2022 (US$ Mn)

TABLE 124 Germany Controlled Substance Market, by Indication, 2023-2030 (US$ Mn)

TABLE 125 France Controlled Substance Market, by Scheduling or Classification, 2017-2022 (US$ Mn)

TABLE 126 France Controlled Substance Market, by Scheduling or Classification, 2023-2030 (US$ Mn)

TABLE 127 France Controlled Substance Market, by Therapeutic Use, 2017-2022 (US$ Mn)

TABLE 128 France Controlled Substance Market, by Therapeutic Use, 2023-2030 (US$ Mn)

TABLE 129 France Controlled Substance Market, by Distribution Channel, 2017-2022 (US$ Mn)

TABLE 130 France Controlled Substance Market, by Distribution Channel, 2023-2030 (US$ Mn)

TABLE 131 France Controlled Substance Market, by Patient Demographics, 2017-2022 (US$ Mn)

TABLE 132 France Controlled Substance Market, by Patient Demographics, 2023-2030 (US$ Mn)

TABLE 133 France Controlled Substance Market, by Indication, 2017-2022 (US$ Mn)

TABLE 134 France Controlled Substance Market, by Indication, 2023-2030 (US$ Mn)

TABLE 135 United Kingdom Controlled Substance Market, by Scheduling or Classification, 2017-2022 (US$ Mn)

TABLE 136 United Kingdom Controlled Substance Market, by Scheduling or Classification, 2023-2030 (US$ Mn)

TABLE 137 United Kingdom Controlled Substance Market, by Therapeutic Use, 2017-2022 (US$ Mn)

TABLE 138 United Kingdom Controlled Substance Market, by Therapeutic Use, 2023-2030 (US$ Mn)

TABLE 139 United Kingdom Controlled Substance Market, by Distribution Channel, 2017-2022 (US$ Mn)

TABLE 140 United Kingdom Controlled Substance Market, by Distribution Channel, 2023-2030 (US$ Mn)

TABLE 141 United Kingdom Controlled Substance Market, by Patient Demographics, 2017-2022 (US$ Mn)

TABLE 142 United Kingdom Controlled Substance Market, by Patient Demographics, 2023-2030 (US$ Mn)

TABLE 143 United Kingdom Controlled Substance Market, by Indication, 2017-2022 (US$ Mn)

TABLE 144 United Kingdom Controlled Substance Market, by Indication, 2023-2030 (US$ Mn)

TABLE 145 Italy Controlled Substance Market, by Scheduling or Classification, 2017-2022 (US$ Mn)

TABLE 146 Italy Controlled Substance Market, by Scheduling or Classification, 2023-2030 (US$ Mn)

TABLE 147 Italy Controlled Substance Market, by Therapeutic Use, 2017-2022 (US$ Mn)

TABLE 148 Italy Controlled Substance Market, by Therapeutic Use, 2023-2030 (US$ Mn)

TABLE 149 Italy Controlled Substance Market, by Distribution Channel, 2017-2022 (US$ Mn)

TABLE 150 Italy Controlled Substance Market, by Distribution Channel, 2023-2030 (US$ Mn)

TABLE 151 Italy Controlled Substance Market, by Patient Demographics, 2017-2022 (US$ Mn)

TABLE 152 Italy Controlled Substance Market, by Patient Demographics, 2023-2030 (US$ Mn)

TABLE 153 Italy Controlled Substance Market, by Indication, 2017-2022 (US$ Mn)

TABLE 154 Italy Controlled Substance Market, by Indication, 2023-2030 (US$ Mn)

TABLE 155 Spain Controlled Substance Market, by Scheduling or Classification, 2017-2022 (US$ Mn)

TABLE 156 Spain Controlled Substance Market, by Scheduling or Classification, 2023-2030 (US$ Mn)

TABLE 157 Spain Controlled Substance Market, by Therapeutic Use, 2017-2022 (US$ Mn)

TABLE 158 Spain Controlled Substance Market, by Therapeutic Use, 2023-2030 (US$ Mn)

TABLE 159 Spain Controlled Substance Market, by Distribution Channel, 2017-2022 (US$ Mn)

TABLE 160 Spain Controlled Substance Market, by Distribution Channel, 2023-2030 (US$ Mn)

TABLE 161 Spain Controlled Substance Market, by Patient Demographics, 2017-2022 (US$ Mn)

TABLE 162 Spain Controlled Substance Market, by Patient Demographics, 2023-2030 (US$ Mn)

TABLE 163 Spain Controlled Substance Market, by Indication, 2017-2022 (US$ Mn)

TABLE 164 Spain Controlled Substance Market, by Indication, 2023-2030 (US$ Mn)

TABLE 165 Benelux Controlled Substance Market, by Scheduling or Classification, 2017-2022 (US$ Mn)

TABLE 166 Benelux Controlled Substance Market, by Scheduling or Classification, 2023-2030 (US$ Mn)

TABLE 167 Benelux Controlled Substance Market, by Therapeutic Use, 2017-2022 (US$ Mn)

TABLE 168 Benelux Controlled Substance Market, by Therapeutic Use, 2023-2030 (US$ Mn)

TABLE 169 Benelux Controlled Substance Market, by Distribution Channel, 2017-2022 (US$ Mn)

TABLE 170 Benelux Controlled Substance Market, by Distribution Channel, 2023-2030 (US$ Mn)

TABLE 171 Benelux Controlled Substance Market, by Patient Demographics, 2017-2022 (US$ Mn)

TABLE 172 Benelux Controlled Substance Market, by Patient Demographics, 2023-2030 (US$ Mn)

TABLE 173 Benelux Controlled Substance Market, by Indication, 2017-2022 (US$ Mn)

TABLE 174 Benelux Controlled Substance Market, by Indication, 2023-2030 (US$ Mn)

TABLE 175 Russia Controlled Substance Market, by Scheduling or Classification, 2017-2022 (US$ Mn)

TABLE 176 Russia Controlled Substance Market, by Scheduling or Classification, 2023-2030 (US$ Mn)

TABLE 177 Russia Controlled Substance Market, by Therapeutic Use, 2017-2022 (US$ Mn)

TABLE 178 Russia Controlled Substance Market, by Therapeutic Use, 2023-2030 (US$ Mn)

TABLE 179 Russia Controlled Substance Market, by Distribution Channel, 2017-2022 (US$ Mn)

TABLE 180 Russia Controlled Substance Market, by Distribution Channel, 2023-2030 (US$ Mn)

TABLE 181 Russia Controlled Substance Market, by Patient Demographics, 2017-2022 (US$ Mn)

TABLE 182 Russia Controlled Substance Market, by Patient Demographics, 2023-2030 (US$ Mn)

TABLE 183 Russia Controlled Substance Market, by Indication, 2017-2022 (US$ Mn)

TABLE 184 Russia Controlled Substance Market, by Indication, 2023-2030 (US$ Mn)

TABLE 185 Rest of Europe Controlled Substance Market, by Scheduling or Classification, 2017-2022 (US$ Mn)

TABLE 186 Rest of Europe Controlled Substance Market, by Scheduling or Classification, 2023-2030 (US$ Mn)

TABLE 187 Rest of Europe Controlled Substance Market, by Therapeutic Use, 2017-2022 (US$ Mn)

TABLE 188 Rest of Europe Controlled Substance Market, by Therapeutic Use, 2023-2030 (US$ Mn)

TABLE 189 Rest of Europe Controlled Substance Market, by Distribution Channel, 2017-2022 (US$ Mn)

TABLE 190 Rest of Europe Controlled Substance Market, by Distribution Channel, 2023-2030 (US$ Mn)

TABLE 191 Rest of Europe Controlled Substance Market, by Patient Demographics, 2017-2022 (US$ Mn)

TABLE 192 Rest of Europe Controlled Substance Market, by Patient Demographics, 2023-2030 (US$ Mn)

TABLE 193 Rest of Europe Controlled Substance Market, by Indication, 2017-2022 (US$ Mn)

TABLE 194 Rest of Europe Controlled Substance Market, by Indication, 2023-2030 (US$ Mn)

TABLE 195 Asia Pacific Controlled Substance Market, by Scheduling or Classification, 2017-2022 (US$ Mn)

TABLE 196 Asia Pacific Controlled Substance Market, by Scheduling or Classification, 2023-2030 (US$ Mn)

TABLE 197 Asia Pacific Controlled Substance Market, by Therapeutic Use, 2017-2022 (US$ Mn)

TABLE 198 Asia Pacific Controlled Substance Market, by Therapeutic Use, 2023-2030 (US$ Mn)

TABLE 199 Asia Pacific Controlled Substance Market, by Distribution Channel, 2017-2022 (US$ Mn)

TABLE 200 Asia Pacific Controlled Substance Market, by Distribution Channel, 2023-2030 (US$ Mn)

TABLE 201 Asia Pacific Controlled Substance Market, by Patient Demographics, 2017-2022 (US$ Mn)

TABLE 202 Asia Pacific Controlled Substance Market, by Patient Demographics, 2023-2030 (US$ Mn)

TABLE 203 Asia Pacific Controlled Substance Market, by Indication, 2017-2022 (US$ Mn)

TABLE 204 Asia Pacific Controlled Substance Market, by Indication, 2023-2030 (US$ Mn)

TABLE 205 China Controlled Substance Market, by Scheduling or Classification, 2017-2022 (US$ Mn)

TABLE 206 China Controlled Substance Market, by Scheduling or Classification, 2023-2030 (US$ Mn)

TABLE 207 China Controlled Substance Market, by Therapeutic Use, 2017-2022 (US$ Mn)

TABLE 208 China Controlled Substance Market, by Therapeutic Use, 2023-2030 (US$ Mn)

TABLE 209 China Controlled Substance Market, by Distribution Channel, 2017-2022 (US$ Mn)

TABLE 210 China Controlled Substance Market, by Distribution Channel, 2023-2030 (US$ Mn)

TABLE 211 China Controlled Substance Market, by Patient Demographics, 2017-2022 (US$ Mn)

TABLE 212 China Controlled Substance Market, by Patient Demographics, 2023-2030 (US$ Mn)

TABLE 213 China Controlled Substance Market, by Indication, 2017-2022 (US$ Mn)

TABLE 214 China Controlled Substance Market, by Indication, 2023-2030 (US$ Mn)

TABLE 215 Japan Controlled Substance Market, by Scheduling or Classification, 2017-2022 (US$ Mn)

TABLE 216 Japan Controlled Substance Market, by Scheduling or Classification, 2023-2030 (US$ Mn)

TABLE 217 Japan Controlled Substance Market, by Therapeutic Use, 2017-2022 (US$ Mn)

TABLE 218 Japan Controlled Substance Market, by Therapeutic Use, 2023-2030 (US$ Mn)

TABLE 219 Japan Controlled Substance Market, by Distribution Channel, 2017-2022 (US$ Mn)

TABLE 220 Japan Controlled Substance Market, by Distribution Channel, 2023-2030 (US$ Mn)

TABLE 221 Japan Controlled Substance Market, by Patient Demographics, 2017-2022 (US$ Mn)

TABLE 222 Japan Controlled Substance Market, by Patient Demographics, 2023-2030 (US$ Mn)

TABLE 223 Japan Controlled Substance Market, by Indication, 2017-2022 (US$ Mn)

TABLE 224 Japan Controlled Substance Market, by Indication, 2023-2030 (US$ Mn)

TABLE 225 India Controlled Substance Market, by Scheduling or Classification, 2017-2022 (US$ Mn)

TABLE 226 India Controlled Substance Market, by Scheduling or Classification, 2023-2030 (US$ Mn)

TABLE 227 India Controlled Substance Market, by Therapeutic Use, 2017-2022 (US$ Mn)

TABLE 228 India Controlled Substance Market, by Therapeutic Use, 2023-2030 (US$ Mn)

TABLE 229 India Controlled Substance Market, by Distribution Channel, 2017-2022 (US$ Mn)

TABLE 230 India Controlled Substance Market, by Distribution Channel, 2023-2030 (US$ Mn)

TABLE 231 India Controlled Substance Market, by Patient Demographics, 2017-2022 (US$ Mn)

TABLE 232 India Controlled Substance Market, by Patient Demographics, 2023-2030 (US$ Mn)

TABLE 233 India Controlled Substance Market, by Indication, 2017-2022 (US$ Mn)

TABLE 234 India Controlled Substance Market, by Indication, 2023-2030 (US$ Mn)

TABLE 235 South Korea Controlled Substance Market, by Scheduling or Classification, 2017-2022 (US$ Mn)

TABLE 236 South Korea Controlled Substance Market, by Scheduling or Classification, 2023-2030 (US$ Mn)

TABLE 237 South Korea Controlled Substance Market, by Therapeutic Use, 2017-2022 (US$ Mn)

TABLE 238 South Korea Controlled Substance Market, by Therapeutic Use, 2023-2030 (US$ Mn)

TABLE 239 South Korea Controlled Substance Market, by Distribution Channel, 2017-2022 (US$ Mn)

TABLE 240 South Korea Controlled Substance Market, by Distribution Channel, 2023-2030 (US$ Mn)

TABLE 241 South Korea Controlled Substance Market, by Patient Demographics, 2017-2022 (US$ Mn)

TABLE 242 South Korea Controlled Substance Market, by Patient Demographics, 2023-2030 (US$ Mn)

TABLE 243 South Korea Controlled Substance Market, by Indication, 2017-2022 (US$ Mn)

TABLE 244 South Korea Controlled Substance Market, by Indication, 2023-2030 (US$ Mn)

TABLE 245 South-East Asia Controlled Substance Market, by Scheduling or Classification, 2017-2022 (US$ Mn)

TABLE 246 South-East Asia Controlled Substance Market, by Scheduling or Classification, 2023-2030 (US$ Mn)

TABLE 247 South-East Asia Controlled Substance Market, by Therapeutic Use, 2017-2022 (US$ Mn)

TABLE 248 South-East Asia Controlled Substance Market, by Therapeutic Use, 2023-2030 (US$ Mn)

TABLE 249 South-East Asia Controlled Substance Market, by Distribution Channel, 2017-2022 (US$ Mn)

TABLE 250 South-East Asia Controlled Substance Market, by Distribution Channel, 2023-2030 (US$ Mn)

TABLE 251 South-East Asia Controlled Substance Market, by Patient Demographics, 2017-2022 (US$ Mn)

TABLE 252 South-East Asia Controlled Substance Market, by Patient Demographics, 2023-2030 (US$ Mn)

TABLE 253 South-East Asia Controlled Substance Market, by Indication, 2017-2022 (US$ Mn)

TABLE 254 South-East Asia Controlled Substance Market, by Indication, 2023-2030 (US$ Mn)

TABLE 255 Rest of Asia Pacific Controlled Substance Market, by Scheduling or Classification, 2017-2022 (US$ Mn)

TABLE 256 Rest of Asia Pacific Controlled Substance Market, by Scheduling or Classification, 2023-2030 (US$ Mn)

TABLE 257 Rest of Asia Pacific Controlled Substance Market, by Therapeutic Use, 2017-2022 (US$ Mn)

TABLE 258 Rest of Asia Pacific Controlled Substance Market, by Therapeutic Use, 2023-2030 (US$ Mn)

TABLE 259 Rest of Asia Pacific Controlled Substance Market, by Distribution Channel, 2017-2022 (US$ Mn)

TABLE 260 Rest of Asia Pacific Controlled Substance Market, by Distribution Channel, 2023-2030 (US$ Mn)

TABLE 261 Rest of Asia Pacific Controlled Substance Market, by Patient Demographics, 2017-2022 (US$ Mn)

TABLE 262 Rest of Asia Pacific Controlled Substance Market, by Patient Demographics, 2023-2030 (US$ Mn)

TABLE 263 Rest of Asia Pacific Controlled Substance Market, by Indication, 2017-2022 (US$ Mn)

TABLE 264 Rest of Asia Pacific Controlled Substance Market, by Indication, 2023-2030 (US$ Mn)

TABLE 265 Latin America Controlled Substance Market, by Scheduling or Classification, 2017-2022 (US$ Mn)

TABLE 266 Latin America Controlled Substance Market, by Scheduling or Classification, 2023-2030 (US$ Mn)

TABLE 267 Latin America Controlled Substance Market, by Therapeutic Use, 2017-2022 (US$ Mn)

TABLE 268 Latin America Controlled Substance Market, by Therapeutic Use, 2023-2030 (US$ Mn)

TABLE 269 Latin America Controlled Substance Market, by Distribution Channel, 2017-2022 (US$ Mn)

TABLE 270 Latin America Controlled Substance Market, by Distribution Channel, 2023-2030 (US$ Mn)

TABLE 271 Latin America Controlled Substance Market, by Patient Demographics, 2017-2022 (US$ Mn)

TABLE 272 Latin America Controlled Substance Market, by Patient Demographics, 2023-2030 (US$ Mn)

TABLE 273 Latin America Controlled Substance Market, by Indication, 2017-2022 (US$ Mn)

TABLE 274 Latin America Controlled Substance Market, by Indication, 2023-2030 (US$ Mn)

TABLE 275 Brazil Controlled Substance Market, by Scheduling or Classification, 2017-2022 (US$ Mn)

TABLE 276 Brazil Controlled Substance Market, by Scheduling or Classification, 2023-2030 (US$ Mn)

TABLE 277 Brazil Controlled Substance Market, by Therapeutic Use, 2017-2022 (US$ Mn)

TABLE 278 Brazil Controlled Substance Market, by Therapeutic Use, 2023-2030 (US$ Mn)

TABLE 279 Brazil Controlled Substance Market, by Distribution Channel, 2017-2022 (US$ Mn)

TABLE 280 Brazil Controlled Substance Market, by Distribution Channel, 2023-2030 (US$ Mn)

TABLE 281 Brazil Controlled Substance Market, by Patient Demographics, 2017-2022 (US$ Mn)

TABLE 282 Brazil Controlled Substance Market, by Patient Demographics, 2023-2030 (US$ Mn)

TABLE 283 Brazil Controlled Substance Market, by Indication, 2017-2022 (US$ Mn)

TABLE 284 Brazil Controlled Substance Market, by Indication, 2023-2030 (US$ Mn)

TABLE 285 Argentina Controlled Substance Market, by Scheduling or Classification, 2017-2022 (US$ Mn)

TABLE 286 Argentina Controlled Substance Market, by Scheduling or Classification, 2023-2030 (US$ Mn)

TABLE 287 Argentina Controlled Substance Market, by Therapeutic Use, 2017-2022 (US$ Mn)

TABLE 288 Argentina Controlled Substance Market, by Therapeutic Use, 2023-2030 (US$ Mn)

TABLE 289 Argentina Controlled Substance Market, by Distribution Channel, 2017-2022 (US$ Mn)

TABLE 290 Argentina Controlled Substance Market, by Distribution Channel, 2023-2030 (US$ Mn)

TABLE 291 Argentina Controlled Substance Market, by Patient Demographics, 2017-2022 (US$ Mn)

TABLE 292 Argentina Controlled Substance Market, by Patient Demographics, 2023-2030 (US$ Mn)

TABLE 293 Argentina Controlled Substance Market, by Indication, 2017-2022 (US$ Mn)

TABLE 294 Argentina Controlled Substance Market, by Indication, 2023-2030 (US$ Mn)

TABLE 295 Rest of Latin America Controlled Substance Market, by Scheduling or Classification, 2017-2022 (US$ Mn)

TABLE 296 Rest of Latin America Controlled Substance Market, by Scheduling or Classification, 2023-2030 (US$ Mn)

TABLE 297 Rest of Latin America Controlled Substance Market, by Therapeutic Use, 2017-2022 (US$ Mn)

TABLE 298 Rest of Latin America Controlled Substance Market, by Therapeutic Use, 2023-2030 (US$ Mn)

TABLE 299 Rest of Latin America Controlled Substance Market, by Distribution Channel, 2017-2022 (US$ Mn)

TABLE 300 Rest of Latin America Controlled Substance Market, by Distribution Channel, 2023-2030 (US$ Mn)

TABLE 301 Rest of Latin America Controlled Substance Market, by Patient Demographics, 2017-2022 (US$ Mn)

TABLE 302 Rest of Latin America Controlled Substance Market, by Patient Demographics, 2023-2030 (US$ Mn)

TABLE 303 Rest of Latin America Controlled Substance Market, by Indication, 2017-2022 (US$ Mn)

TABLE 304 Rest of Latin America Controlled Substance Market, by Indication, 2023-2030 (US$ Mn)

TABLE 305 Middle East Controlled Substance Market, by Scheduling or Classification, 2017-2022 (US$ Mn)

TABLE 306 Middle East Controlled Substance Market, by Scheduling or Classification, 2023-2030 (US$ Mn)

TABLE 307 Middle East Controlled Substance Market, by Therapeutic Use, 2017-2022 (US$ Mn)

TABLE 308 Middle East Controlled Substance Market, by Therapeutic Use, 2023-2030 (US$ Mn)

TABLE 309 Middle East Controlled Substance Market, by Distribution Channel, 2017-2022 (US$ Mn)

TABLE 310 Middle East Controlled Substance Market, by Distribution Channel, 2023-2030 (US$ Mn)

TABLE 311 Middle East Controlled Substance Market, by Patient Demographics, 2017-2022 (US$ Mn)

TABLE 312 Middle East Controlled Substance Market, by Patient Demographics, 2023-2030 (US$ Mn)

TABLE 313 Middle East Controlled Substance Market, by Indication, 2017-2022 (US$ Mn)

TABLE 314 Middle East Controlled Substance Market, by Indication, 2023-2030 (US$ Mn)

TABLE 315 UAE Controlled Substance Market, by Scheduling or Classification, 2017-2022 (US$ Mn)

TABLE 316 UAE Controlled Substance Market, by Scheduling or Classification, 2023-2030 (US$ Mn)

TABLE 317 UAE Controlled Substance Market, by Therapeutic Use, 2017-2022 (US$ Mn)

TABLE 318 UAE Controlled Substance Market, by Therapeutic Use, 2023-2030 (US$ Mn)

TABLE 319 UAE Controlled Substance Market, by Distribution Channel, 2017-2022 (US$ Mn)

TABLE 320 UAE Controlled Substance Market, by Distribution Channel, 2023-2030 (US$ Mn)

TABLE 321 UAE Controlled Substance Market, by Patient Demographics, 2017-2022 (US$ Mn)

TABLE 322 UAE Controlled Substance Market, by Patient Demographics, 2023-2030 (US$ Mn)

TABLE 323 UAE Controlled Substance Market, by Indication, 2017-2022 (US$ Mn)

TABLE 324 UAE Controlled Substance Market, by Indication, 2023-2030 (US$ Mn)

TABLE 325 Saudi Arabia Controlled Substance Market, by Scheduling or Classification, 2017-2022 (US$ Mn)

TABLE 326 Saudi Arabia Controlled Substance Market, by Scheduling or Classification, 2023-2030 (US$ Mn)

TABLE 327 Saudi Arabia Controlled Substance Market, by Therapeutic Use, 2017-2022 (US$ Mn)

TABLE 328 Saudi Arabia Controlled Substance Market, by Therapeutic Use, 2023-2030 (US$ Mn)

TABLE 329 Saudi Arabia Controlled Substance Market, by Distribution Channel, 2017-2022 (US$ Mn)

TABLE 330 Saudi Arabia Controlled Substance Market, by Distribution Channel, 2023-2030 (US$ Mn)

TABLE 331 Saudi Arabia Controlled Substance Market, by Patient Demographics, 2017-2022 (US$ Mn)

TABLE 332 Saudi Arabia Controlled Substance Market, by Patient Demographics, 2023-2030 (US$ Mn)

TABLE 333 Saudi Arabia Controlled Substance Market, by Indication, 2017-2022 (US$ Mn)

TABLE 334 Saudi Arabia Controlled Substance Market, by Indication, 2023-2030 (US$ Mn)

TABLE 335 Rest of Middle East Controlled Substance Market, by Scheduling or Classification, 2017-2022 (US$ Mn)

TABLE 336 Rest of Middle East Controlled Substance Market, by Scheduling or Classification, 2023-2030 (US$ Mn)

TABLE 337 Rest of Middle East Controlled Substance Market, by Therapeutic Use, 2017-2022 (US$ Mn)

TABLE 338 Rest of Middle East Controlled Substance Market, by Therapeutic Use, 2023-2030 (US$ Mn)

TABLE 339 Rest of Middle East Controlled Substance Market, by Distribution Channel, 2017-2022 (US$ Mn)

TABLE 340 Rest of Middle East Controlled Substance Market, by Distribution Channel, 2023-2030 (US$ Mn)

TABLE 341 Rest of Middle East Controlled Substance Market, by Patient Demographics, 2017-2022 (US$ Mn)

TABLE 342 Rest of Middle East Controlled Substance Market, by Patient Demographics, 2023-2030 (US$ Mn)

TABLE 343 Rest of Middle East Controlled Substance Market, by Indication, 2017-2022 (US$ Mn)

TABLE 344 Rest of Middle East Controlled Substance Market, by Indication, 2023-2030 (US$ Mn)

TABLE 345 Africa Controlled Substance Market, by Scheduling or Classification, 2017-2022 (US$ Mn)

TABLE 346 Africa Controlled Substance Market, by Scheduling or Classification, 2023-2030 (US$ Mn)

TABLE 347 Africa Controlled Substance Market, by Therapeutic Use, 2017-2022 (US$ Mn)

TABLE 348 Africa Controlled Substance Market, by Therapeutic Use, 2023-2030 (US$ Mn)

TABLE 349 Africa Controlled Substance Market, by Distribution Channel, 2017-2022 (US$ Mn)

TABLE 350 Africa Controlled Substance Market, by Distribution Channel, 2023-2030 (US$ Mn)

TABLE 351 Africa Controlled Substance Market, by Patient Demographics, 2017-2022 (US$ Mn)

TABLE 352 Africa Controlled Substance Market, by Patient Demographics, 2023-2030 (US$ Mn)

TABLE 353 Africa Controlled Substance Market, by Indication, 2017-2022 (US$ Mn)

TABLE 354 Africa Controlled Substance Market, by Indication, 2023-2030 (US$ Mn)

TABLE 355 South Africa Controlled Substance Market, by Scheduling or Classification, 2017-2022 (US$ Mn)

TABLE 356 South Africa Controlled Substance Market, by Scheduling or Classification, 2023-2030 (US$ Mn)

TABLE 357 South Africa Controlled Substance Market, by Therapeutic Use, 2017-2022 (US$ Mn)

TABLE 358 South Africa Controlled Substance Market, by Therapeutic Use, 2023-2030 (US$ Mn)

TABLE 359 South Africa Controlled Substance Market, by Distribution Channel, 2017-2022 (US$ Mn)

TABLE 360 South Africa Controlled Substance Market, by Distribution Channel, 2023-2030 (US$ Mn)

TABLE 361 South Africa Controlled Substance Market, by Patient Demographics, 2017-2022 (US$ Mn)

TABLE 362 South Africa Controlled Substance Market, by Patient Demographics, 2023-2030 (US$ Mn)

TABLE 363 South Africa Controlled Substance Market, by Indication, 2017-2022 (US$ Mn)

TABLE 364 South Africa Controlled Substance Market, by Indication, 2023-2030 (US$ Mn)

TABLE 365 Egypt Controlled Substance Market, by Scheduling or Classification, 2017-2022 (US$ Mn)

TABLE 366 Egypt Controlled Substance Market, by Scheduling or Classification, 2023-2030 (US$ Mn)

TABLE 367 Egypt Controlled Substance Market, by Therapeutic Use, 2017-2022 (US$ Mn)

TABLE 368 Egypt Controlled Substance Market, by Therapeutic Use, 2023-2030 (US$ Mn)

TABLE 369 Egypt Controlled Substance Market, by Distribution Channel, 2017-2022 (US$ Mn)

TABLE 370 Egypt Controlled Substance Market, by Distribution Channel, 2023-2030 (US$ Mn)

TABLE 371 Egypt Controlled Substance Market, by Patient Demographics, 2017-2022 (US$ Mn)

TABLE 372 Egypt Controlled Substance Market, by Patient Demographics, 2023-2030 (US$ Mn)

TABLE 373 Egypt Controlled Substance Market, by Indication, 2017-2022 (US$ Mn)

TABLE 374 Egypt Controlled Substance Market, by Indication, 2023-2030 (US$ Mn)

TABLE 375 Rest of Africa Controlled Substance Market, by Scheduling or Classification, 2017-2022 (US$ Mn)

TABLE 376 Rest of Africa Controlled Substance Market, by Scheduling or Classification, 2023-2030 (US$ Mn)

TABLE 377 Rest of Africa Controlled Substance Market, by Therapeutic Use, 2017-2022 (US$ Mn)

TABLE 378 Rest of Africa Controlled Substance Market, by Therapeutic Use, 2023-2030 (US$ Mn)

TABLE 379 Rest of Africa Controlled Substance Market, by Distribution Channel, 2017-2022 (US$ Mn)

TABLE 380 Rest of Africa Controlled Substance Market, by Distribution Channel, 2023-2030 (US$ Mn)

TABLE 381 Rest of Africa Controlled Substance Market, by Patient Demographics, 2017-2022 (US$ Mn)

TABLE 382 Rest of Africa Controlled Substance Market, by Patient Demographics, 2023-2030 (US$ Mn)

TABLE 383 Rest of Africa Controlled Substance Market, by Indication, 2017-2022 (US$ Mn)

TABLE 384 Rest of Africa Controlled Substance Market, by Indication, 2023-2030 (US$ Mn)

Frequently asked questions

What is the current size of the global controlled substance market?

The global controlled substance market was valued at USD 66845.9 Million in 2022.

What is the expected growth rate of the controlled substance market between 2023 and 2030?

The controlled substance market is expected to grow at a CAGR of 7.5% between 2023 and 2030, reaching USD 119218.2 Million in 2030.

Which segment is leading the market share in terms of therapeutic use?

Pain management is the leading segment by therapeutic use, holding over 32% share in value in 2022.

Which distribution channel segment governs the demand for controlled substances in the world?

The hospital pharmacies segment governs the global demand for controlled substances, holding a massive share of over 35% in 2022.

Which indication segment will post the highest CAGR in the forecast period?

The substance use disorder segment will post the highest CAGR over the projection period.

Which region is fueling the growth of the controlled substance industry?

With more than one-third of the market in 2022, North America is driving the expansion of the controlled substance industry.

Who are the major players in the global controlled substance market?

The top players include Johnson & Johnson, Pfizer, Sanofi, Merck & Co., Gilead Sciences, Amgen, Novartis, AbbVie, GlaxoSmithKline, AstraZeneca, Bristol-Myers Squibb, Eli Lilly, Teva Pharmaceutical, Bayer, Novo Nordisk, Allergan, Takeda Pharmaceutical, Boehringer Ingelheim, Aspen Pharmacare, Astellas Pharma, and Others.

What are the major market drivers of the controlled substance industry?

The major market drivers of the controlled substance industry include the rising prevalence of chronic pain and related conditions and ongoing pharmaceutical innovations and research.

What are the major market restraints of the controlled substance industry?

The major market restraints of the controlled substance industry are stringent regulatory frameworks & compliance burdens and the stigmatization and negative public perception surrounding the use of controlled substances.

What are the major market opportunities of the controlled substance industry?

The major market opportunities of the controlled substance industry encompass advancements in telemedicine and digital health solutions and the research and development of non-opioid alternatives and novel formulations for pain management.

Middle East and Africa Veterinary Vaccines Market

Published:
Report ID: 37309

Asia Pacific Stem Cell Therapy Market

Published:
Report ID: 37280

US Active Pharmaceutical Ingredient (API) Market

Published:
Report ID: 37221

Cancer Supportive Care Market

Published:
Report ID: 1901

Middle East and Africa Radiopharmaceuticals Market

Published:
Report ID: 37164

Temperature Controlled Pharma Packaging Solutions Market

Published:
Report ID: 20599

Vietnam Pneumococcal Vaccine Market

Published:
Report ID: 37015

Maternity and Nursing Bras Market

Published:
Report ID: 36899

Gene Therapy Market

Published:
Report ID: 36825

Antioxidant Market

Published:
Report ID: 6987

Drug Screening Market

Published:
Report ID: 36731

Angiogenesis Inhibitors and Stimulators Market

Published:
Report ID: 36682

Purchase Options

$2999
Delivery Format: Excel.
$4999
Designed for the individual purchaser.
$6999
Users located at a single corporate site or regional office.
$7999
Allowed for unlimited sharing globally within one company.
Smallform of Sample request

Have a question?

User Profile

Don’t settle for less – trust Mitul to help you find the best solution.

Report delivery within 24 to 48 hours

– Other Info –

What people say?-

User Review

I am very impressed with the information in this report. The author clearly did their research when they came up with this product and it has already given me a lot of ideas.

Jana Schmidt
CEDAR CX Technologies

– Connect with us –

Phone

+91 6232 49 3207


support

24/7 Research Support


sales@credenceresearch.com

– Research Methodology –

Going beyond the basics: advanced techniques in research methodology

– Trusted By –

Pepshi, LG, Nestle
Motorola, Honeywell, Johnson and johnson
LG Chem, SIEMENS, Pfizer
Unilever, Samsonite, QIAGEN