
Market overview
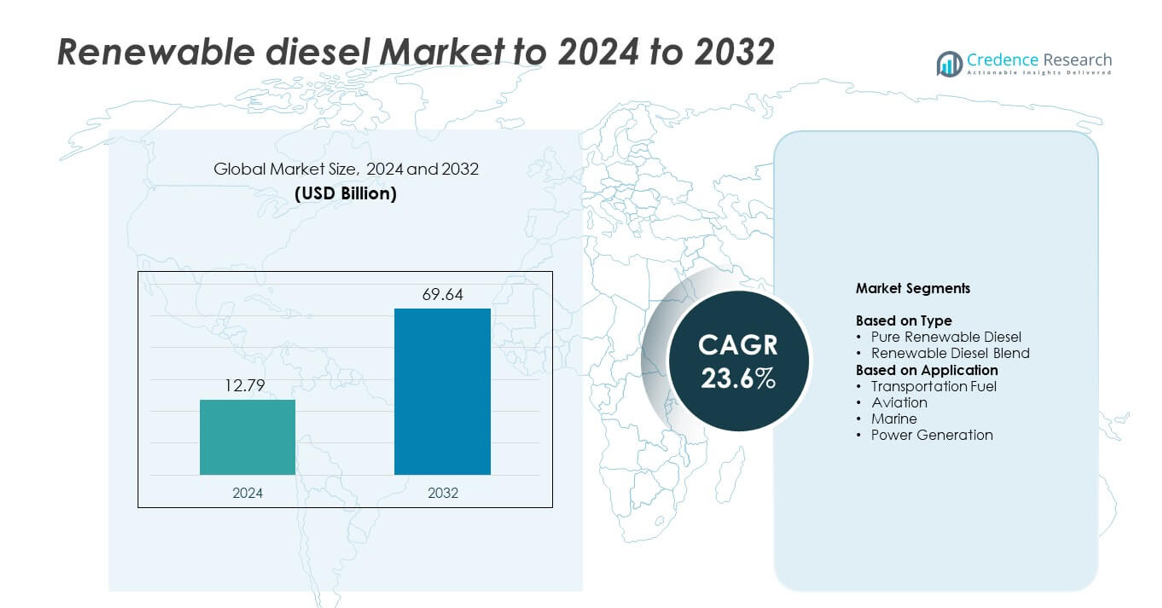
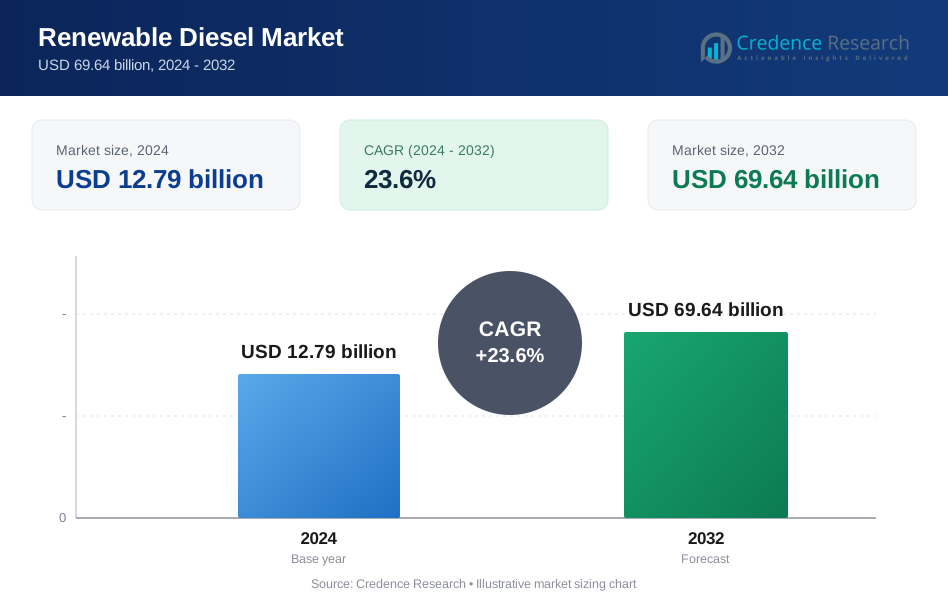
The renewable diesel market size was valued at USD 12.79 billion in 2024 and is anticipated to reach USD 69.64 billion by 2032, growing at a CAGR of 23.6% during the forecast period.
| REPORT ATTRIBUTE | DETAILS |
|---|---|
| Historical Period | 2020-2023 |
| Base Year | 2024 |
| Forecast Period | 2025-2032 |
| Renewable Diesel Market Size 2024 | USD 12.79 billion |
| Renewable Diesel Market, CAGR | 23.6% |
| Renewable Diesel Market Size 2032 | USD 69.64 billion |
The renewable diesel market is led by key players such as Neste Oyj, Marathon Petroleum Corporation, TotalEnergies SE, Eni S.p.A., Valero + Diamond Green Diesel JV, Repsol, Diamond Green Diesel (DGD), and Vegas Renewable Diesel. These companies dominate through large-scale refinery conversions, advanced hydrotreatment technologies, and strong supply chain integration. Strategic investments in sustainable feedstocks and capacity expansion projects further strengthen their market presence. Regionally, North America emerged as the leading market with a 39% share in 2024, driven by supportive clean fuel standards and growing renewable fuel adoption in transportation and aviation sectors
.Market Insights
- The renewable diesel market was valued at USD 12.79 billion in 2024 and is projected to reach USD 69.64 billion by 2032, growing at a CAGR of 23.6%.
- Growth is fueled by rising demand for low-carbon fuels, government mandates promoting clean energy, and expanding availability of renewable feedstocks such as used cooking oil and animal fats.
- The market is witnessing trends like refinery conversions, increased use of hydrogenation technologies, and adoption in aviation and marine sectors for decarbonization.
- Competitive intensity is high, with major energy companies investing in large-scale renewable fuel plants, improving refining efficiency, and securing long-term feedstock supply chains.
- North America led with a 39% share in 2024, followed by Europe with 32% and Asia-Pacific with 21%, while pure renewable diesel held the dominant 63% segment share due to its superior performance and compatibility with existing diesel infrastructure.
Market Segmentation Analysis:
By Type
Pure renewable diesel dominated the market with a 63% share in 2024, driven by its compatibility with existing diesel engines and superior performance compared to biodiesel. The segment benefits from higher energy density, lower carbon emissions, and full substitution capability for petroleum diesel without blending. Increasing adoption in fleet operations and logistics industries supports growth. Governments promoting low-carbon fuel standards in the U.S. and Europe further accelerate demand, while advancements in hydrotreatment processes enhance production efficiency and fuel quality for large-scale commercial use.
- For instance, Neste Oyj operates renewable products refineries across three continents and, following the completion of the Rotterdam expansion in 2027, will increase its annual nameplate capacity for renewable products from the current approximately 5.5 million tons to 6.8 million tons.
By Application
Transportation fuel accounted for the leading 58% market share in 2024, supported by the growing shift toward cleaner mobility solutions. Renewable diesel’s drop-in capability allows seamless integration into existing fuel infrastructure, making it suitable for heavy-duty trucks, buses, and public transport fleets. Expanding government incentives for low-emission vehicles and corporate sustainability commitments drive demand. The aviation segment is also gaining momentum due to rising adoption of sustainable aviation fuels, encouraged by international emissions reduction targets and airline decarbonization initiatives.
- For instance, Marathon Petroleum Corporation operates the Martinez Renewables facility in California, a 50/50 joint venture with Neste. The facility has a total nameplate capacity of approximately 730 million gallons per year, with the output split between the two partners.
Key Growth Drivers
Rising Adoption of Low-Carbon Fuels
Global efforts to reduce greenhouse gas emissions are boosting renewable diesel adoption across transportation and logistics. Governments in North America and Europe are implementing carbon reduction targets and clean fuel programs that favor renewable diesel over conventional fuels. Its compatibility with existing diesel engines enables immediate decarbonization without infrastructure changes. This policy-driven shift positions renewable diesel as a leading alternative in meeting sustainability goals and energy transition mandates.
- For instance, TotalEnergies SE completed the conversion of its La Mède refinery in 2019, turning it into France's first biorefinery with a production capacity of 500,000 metric tons of biofuels per year.
Expansion of Renewable Feedstock Availability
The growing availability of sustainable feedstocks such as used cooking oil, animal fats, and vegetable oils is driving renewable diesel production. Companies are investing in advanced refining technologies to optimize feedstock conversion efficiency. Agricultural diversification and waste collection networks are strengthening global supply chains. The increased feedstock supply ensures consistent production and supports large-scale commercialization, improving market stability and reducing dependence on fossil-derived sources.
- For instance, Enilive (an Eni company) operates the Gela biorefinery, which processes approximately 736,000 metric tons of biomass per year, with over 85% of its feedstock being waste and residues such as used cooking oil, animal fats, and agri-industry by-products
Strategic Investments and Capacity Expansion
Oil refiners and biofuel producers are expanding renewable diesel capacity to meet rising demand. Major energy companies are converting traditional refineries into renewable fuel facilities, leveraging existing infrastructure for cost efficiency. Partnerships between governments and private firms support large-scale projects in the U.S., Europe, and Asia. These investments strengthen supply capabilities and enhance technological innovation, accelerating renewable diesel’s penetration in commercial transport and aviation sectors.
Key Trends & Opportunities
Integration with Aviation and Marine Sectors
The aviation and marine industries are emerging as new growth areas for renewable diesel. Airlines and shipping companies are testing renewable fuels to comply with global emission standards. Blending mandates and carbon offset programs are promoting adoption, while technology advancements allow compatibility with existing engines. The shift toward sustainable aviation fuel (SAF) and renewable marine diesel presents significant opportunities for producers to diversify their customer base.
- For instance, Chevron Renewable Energy Group is an active supplier of sustainable aviation fuel (SAF) and renewable diesel, supporting commercial aviation's decarbonization goals, while BP (which integrated its aviation division Air bp in 2023) distributes SAF capable of reducing lifecycle emissions by up to 80% through its supply chain and partnerships
Development of Advanced Hydrogenation Technologies
Hydrotreatment and co-processing innovations are improving renewable diesel yield and quality. Refineries are integrating hydrogen-based refining processes that enhance efficiency and reduce byproduct waste. These advancements enable the use of diverse feedstocks and improve scalability, helping producers achieve cost competitiveness. Continuous R&D in catalyst optimization and process automation offers long-term opportunities for refining flexibility and higher returns on renewable fuel production.
- For instance, Phillips 66 deployed next-generation hydrogenation at its Rodeo facility, achieving a renewable diesel output capacity of 800 million gallons per year, improving process yield through optimized catalyst systems.
Key Challenges
Feedstock Supply Constraints
Limited and uneven availability of sustainable feedstocks remains a key challenge for market growth. The competition between renewable diesel and biodiesel producers for used cooking oil and animal fats increases procurement costs. Seasonal variations in agricultural supply also impact raw material consistency. To overcome this issue, producers are focusing on developing non-food-based feedstocks and waste-derived alternatives to maintain stable production and pricing structures.
High Production and Conversion Costs
The renewable diesel market faces cost challenges due to high capital investment and complex refining processes. Hydrogenation and upgrading technologies require significant energy inputs, raising operational expenses. Smaller producers often struggle to achieve economies of scale, limiting market entry. Ongoing research in process optimization and government funding for biofuel projects aim to reduce costs, but achieving long-term price parity with petroleum diesel remains a major barrier.
Regional Analysis
North America
North America dominated the renewable diesel market with a 39% share in 2024, supported by strong policy frameworks such as the U.S. Renewable Fuel Standard and California’s Low Carbon Fuel Standard. The region benefits from major production facilities in the U.S. and Canada, driven by investments from energy companies converting refineries to renewable operations. Growing adoption of renewable fuels in transportation fleets and aviation further boosts demand. Continuous support through tax incentives, carbon credits, and government-backed biofuel programs enhances the regional supply chain and accelerates large-scale commercial deployment.
Europe
Europe held a 32% market share in 2024, driven by stringent emission regulations and renewable energy directives promoting bio-based fuels. Countries such as Finland, Sweden, and the Netherlands lead production through advanced hydrotreatment technologies. The European Union’s Fit for 55 initiative and carbon neutrality goals encourage the replacement of fossil-based diesel with renewable alternatives. Demand is strong in the transport and aviation sectors as companies seek to meet sustainability targets. Ongoing R&D efforts and cross-border partnerships continue to strengthen regional capacity and feedstock diversification.
Asia-Pacific
Asia-Pacific accounted for 21% of the renewable diesel market in 2024, fueled by rising energy demand and growing investments in sustainable fuels across China, Japan, and Singapore. Governments are introducing mandates to reduce dependency on imported petroleum and promote renewable fuel blending. Major refineries in Southeast Asia are expanding renewable diesel capacity using palm oil, algae, and waste-based feedstocks. The region’s rapid industrialization and increasing commercial transport activities create strong consumption potential. Continuous technological collaborations and policy incentives are expected to enhance regional production capabilities in the coming years.
Latin America
Latin America captured a 5% market share in 2024, supported by abundant agricultural resources and emerging biofuel policies. Brazil and Argentina are leading producers due to their established biodiesel industries and access to feedstocks like soybean oil. Government initiatives promoting renewable energy and carbon reduction drive regional investment. However, limited refining infrastructure and inconsistent policy enforcement slow widespread adoption. Ongoing collaborations between domestic and international energy companies are helping to expand renewable diesel production and improve export opportunities to North American and European markets.
Middle East & Africa
The Middle East & Africa held a 3% market share in 2024, with growth emerging from renewable energy diversification strategies. Countries such as the UAE and South Africa are investing in bio-refineries to reduce reliance on fossil fuels. Government-driven sustainability programs and partnerships with global energy firms are fostering pilot-scale renewable diesel projects. Limited feedstock availability and high production costs currently restrain growth, but ongoing research into non-edible and waste-based feedstocks is expected to enhance regional competitiveness and long-term potential in the renewable fuel sector.
Market Segmentations:
By Type
- Pure Renewable Diesel
- Renewable Diesel Blend
By Application
- Transportation Fuel
- Aviation
- Marine
- Power Generation
By Geography
- North America
- U.S.
- Canada
- Europe
- Germany
- France
- Italy
- U.K.
- Russia
- Rest of Europe
- Asia-Pacific
- India
- China
- Japan
- Rest of Asia-Pacific
- Latin America
- Brazil
- Mexico
- Rest of Latin America
- Middle East and Africa
- GCC Countries
- South Africa
- Rest of Middle East and Africa
Competitive Landscape
The renewable diesel market is led by major players including Neste Oyj, Marathon Petroleum Corporation, TotalEnergies SE, Eni S.p.A., Valero + Diamond Green Diesel JV, Repsol, Diamond Green Diesel (DGD), and Vegas Renewable Diesel. The competitive landscape is defined by large-scale refinery conversions, feedstock optimization, and technological innovation in hydrogenation and co-processing. Companies are focusing on expanding renewable fuel capacity through joint ventures, acquisitions, and strategic partnerships to meet global demand. Increasing government incentives for low-carbon fuels and growing adoption in transportation and aviation sectors are driving competition. Participants are also investing heavily in waste-derived and non-edible feedstocks to secure sustainable raw material supply. Integration of digital monitoring, process automation, and energy-efficient refining systems enhances production efficiency and emission performance. The market shows consolidation trends as global energy firms strengthen vertical integration, ensuring control over feedstock sourcing, refining operations, and downstream distribution in the renewable energy value chain.
Key Player Analysis
- Neste Oyj
- Maratho
- TotalEnergies SE
- n Petroleum Corporation
- TotalEnergies SE
- Eni S.p.A.
- Valero + Diamond Green Diesel JV
- Repsol
- Diamond Green Diesel (DGD)
- Vegas Renewable Diesel
Recent Developments
- In 2024, Diamond Green Diesel (DGD), a joint venture that includes Valero and Darling Ingredients, began supplying sustainable aviation fuel (SAF) to Florida.
- In 2024, Repsol Spanish-based energy company launched its Nexa 100% Renewable Diesel at service stations.
- In 2024, Neste partnered with Colonial Oil to enhance the availability of renewable diesel in the southeastern U.S. through distribution in Savannah, Georgia.
Report Coverage
The research report offers an in-depth analysis based on Type, Application and Geography. It details leading market players, providing an overview of their business, product offerings, investments, revenue streams, and key applications. Additionally, the report includes insights into the competitive environment, SWOT analysis, current market trends, as well as the primary drivers and constraints. Furthermore, it discusses various factors that have driven market expansion in recent years. The report also explores market dynamics, regulatory scenarios, and technological advancements that are shaping the industry. It assesses the impact of external factors and global economic changes on market growth. Lastly, it provides strategic recommendations for new entrants and established companies to navigate the complexities of the market.
Future Outlook
- Renewable diesel demand will continue to rise with global emission reduction commitments.
- Governments will expand policy incentives and blending mandates to support clean fuel adoption.
- Advancements in hydrotreatment and co-processing will improve production efficiency.
- Feedstock diversification using waste oils and non-edible crops will strengthen supply stability.
- Aviation and marine industries will increasingly adopt renewable diesel for decarbonization goals.
- Oil refineries will accelerate conversion to renewable fuel production facilities.
- Strategic partnerships will drive large-scale capacity expansion across major regions.
- Technology integration will lower production costs and enhance fuel quality.
- Asia-Pacific will emerge as a key growth hub with new refinery investments.
- Renewable diesel will play a central role in achieving global net-zero energy transition targets.
Request a Free Sample
Fill in your details and we'll send you a free sample report.
- Sample data tables & charts
- Research methodology
Need a Custom Version of This Report?
Tailor the scope, geography, or segments to your exact requirements.
- Custom geography or segment scope
- Direct access to our analyst team
Frequently Asked Questions
What is the current market size for Renewable diesel Market, and what is its projected size in 2032?
At what Compound Annual Growth Rate is the Renewable diesel Market projected to grow between 2025 and 2032?
Which Renewable diesel Market segment held the largest share in 2024?
What are the primary factors fueling the growth of the Renewable diesel Market?
Who are the leading companies in the Renewable diesel Market?
Which region commanded the largest share of the Renewable diesel Market in 2024?
Table of Content
Chapter 1. Report Introduction
- 1.1 Report Description & Purpose
- 1.1.1 Report Title & Market Definition
- 1.1.2 Unique Selling Propositions (USP) & Key Differentiators
- 1.1.3 Value Proposition for Stakeholders
- 1.2 Research Objectives
- 1.2.1 Market Sizing Objectives (Volume & Revenue)
- 1.2.2 Segmentation Objectives
- 1.2.3 Competitive Intelligence Objectives
- 1.2.4 Forecast & Scenario Objectives
- 1.3 Report Scope
- 1.3.1 Renewable Diesel Scope – Types & Subtypes Covered
- 1.3.2 Geographic Scope – Regions & Countries Covered
- 1.3.3 Historical Period, Base Year & Forecast Period (2024; forecast to 2032)
- 1.3.4 Inclusions & Exclusions
- 1.4 HS Code & Classification Framework
- 1.5 Currency, Units & Pricing Basis
- 1.6 Target Stakeholders
- 1.7 Limitations & Assumptions
Chapter 2. Executive Summary
- 2.1 Global Renewable Diesel Market Snapshot
- 2.1.1 Market Size – Historical (2024) & Forecast (2024-2032) (2024: USD 12.79 billion → 2032: USD 69.64 billion)
- 2.1.2 Volume & Revenue – Global Totals
- 2.1.3 Key Market Highlights – Top Five Facts
- 2.2 Renewable Diesel Market Segmentation Snapshot
- 2.2.1 Market Split by Region – 2024 vs. 2032
- 2.3 Competitive Snapshot
- 2.3.1 Top 10 Players by Revenue Share – 2024
- 2.3.2 Top 10 Players by Volume Share – 2024
- 2.3.3 Recent Strategic Developments (18-Month Summary)
- 2.4 Key Investment Highlights & Strategic Conclusions
Chapter 3. Renewable Diesel Market Dynamics & Industry Analysis
- 3.1 Market Overview & Context
- 3.1.1 Renewable Diesel Market Position in the Broader Automotive Value Chain
- 3.1.2 OEM vs. Replacement Market Dynamics
- 3.1.3 Market Maturity & Development Stage by Region
- 3.2 Renewable Diesel Market Drivers
- 3.3 Renewable Diesel Market Restraints & Challenges
- 3.4 Renewable Diesel Market Opportunities
- 3.5 Porter's Five Forces Analysis
- 3.5.1 Threat of New Entrants
- 3.5.2 Bargaining Power of Suppliers
- 3.5.3 Bargaining Power of Buyers
- 3.5.4 Threat of Substitutes
- 3.5.5 Competitive Rivalry – Intensity Assessment
- 3.6 Renewable Diesel Value Chain Analysis
- 3.6.1 Upstream – Raw Material/Input Suppliers
- 3.6.1.1 Raw Material/Input 1
- 3.6.1.2 Raw Material/Input 2
- 3.6.1.3 Raw Material/Input 3
- 3.6.2 Midstream – Production/Manufacturing/Service Delivery
- 3.6.2.1 Production/Process Overview
- 3.6.2.2 Key Facility Locations & Capacity by Manufacturer
- 3.6.3 Downstream – Distribution & End Consumer
- 3.6.3.1 Primary Channel – B2B/OEM
- 3.6.3.2 Secondary Channels – Dealer, Retail, Online, Direct
- 3.6.4 Value Chain Profitability Analysis
- 3.6.1 Upstream – Raw Material/Input Suppliers
- 3.7 PESTEL Analysis
- 3.7.1 Political Factors
- 3.7.2 Economic Factors
- 3.7.3 Social Factors
- 3.7.4 Technological Factors
- 3.7.5 Environmental Factors
- 3.7.6 Legal Factors
- 3.8 Renewable Diesel Supply Chain Analysis
- 3.8.1 Raw Material/Input Supply Risk Assessment
- 3.8.2 Manufacturing Concentration Risk (Geographic Exposure)
- 3.8.3 Trade Disruption Impact Analysis
- 3.9 Regulatory & Policy Landscape
Note: The regulatory and policy landscape section covers regulations based on their applicability to the market, Renewable Diesel category, geography, and scope of the study. Only regulatory frameworks with a material impact on operations, compliance, trade, sustainability, or market access are analyzed in detail.
Chapter 4. Key Investment Pockets & Opportunity Analysis
- 4.1 Renewable Diesel Market Attractiveness Analysis
- 4.1.1 By Region – Investment Attractiveness Matrix (Volume × CAGR)
- 4.2 Absolute Revenue Growth Opportunity
- 4.2.1 By Region – Absolute USD Growth Through 2032
- 4.3 Incremental Volume Opportunity
- 4.3.1 By Region – Incremental Volume Through 2032
- 4.3.2 Segment – Incremental Volume
- 4.4 Emerging Submarket Opportunity Deep Dive (Subject to Applicability)
- 4.5 Emerging Market Opportunity Scorecards
- 4.5.1 United States
- 4.5.2 Europe
- 4.5.3 Asia
- 4.5.4 Middle East & Africa
Note: Emerging Market Opportunity Scorecards will be included based on relevance and strategic importance. Regions listed are indicative and may vary depending on data availability and market dynamics.
Chapter 5. Renewable Diesel Import-Export Analysis & Trade Flows
- 5.1 Global Trade Overview
- 5.1.1 Global Export Value by Country (2024)
- 5.1.2 Global Export Volume by Country (2024)
- 5.1.3 Global Import Value by Country (2024)
- 5.1.4 Global Import Volume by Country (2024)
- 5.1.5 Net Trade Balance by Country (2024)
- 5.2 Export Analysis – Segment
- 5.2.1 Type 1 (HS Code)
- 5.2.2 Type 2 (HS Code)
- 5.2.3 Type 3 (HS Code)
- 5.2.4 Type 4 (HS Code)
- 5.2.5 Type 5 (HS Code)
- 5.3 Import Analysis – Segment
- 5.3.1 Type 1 (HS Code)
- 5.3.2 Type 2 (HS Code)
- 5.3.3 Type 3 (HS Code)
- 5.3.4 Type 4 (HS Code)
- 5.3.5 Type 5 (HS Code)
- 5.4 Average Unit Trade Prices
- 5.4.1 Average Export Price – Segment & Country
- 5.4.2 Average Import Price – Segment & Source Country
- 5.4.3 Price Trends (2024)
- 5.5 Key Trade Route Analysis
- 5.5.1 Trade Route 1
- 5.5.2 Trade Route 2
- 5.5.3 Trade Route 3
- 5.5.4 Trade Route 4
- 5.5.5 Trade Route 5
- 5.6 Trade Policy Impact Assessment
- 5.6.1 US Anti-Dumping & Section 301 Tariffs
- 5.6.2 EU Customs Union Impact
- 5.6.3 Major Free Trade Agreements
- 5.6.4 USMCA Rules of Origin
Note: Trade policy analysis will be included only where relevant to the Renewable Diesel market.
Chapter 6. Competitive Landscape & Company Benchmarking
- 6.1 Renewable Diesel Market Concentration & Structure
- 6.1.1 Herfindahl-Hirschman Index (HHI) – vs. 2024
- 6.1.2 Tier 1, Tier 2 & Tier 3 Market Structure
- 6.1.3 Global, Regional & Local Player Dynamics
- 6.2 Renewable Diesel Market Share Analysis – 2024
- 6.2.1 Global Revenue Share by Company
- 6.2.2 Global Volume Share by Company
- 6.2.3 Regional Revenue Share
- 6.2.4 Market Share Evolution ( vs. 2024)
- 6.2.5 OEM Segment Share by Company
- 6.2.6 Replacement Segment Share by Company
- 6.3 Production/Delivery Capacity & Facility Analysis
- 6.3.1 Global Installed Capacity
- 6.3.2 Capacity Utilization Rates
- 6.3.3 Production/Output Volume
- 6.3.4 Facility Locations & Capacity Map
- 6.3.5 Planned Capacity Additions
- 6.4 Renewable Diesel Competitive Benchmarking Matrix
- 6.4.1 Revenue, Volume, CAGR & Profitability Comparison
- 6.4.2 Channel Revenue Mix
- 6.4.3 Geographic Revenue Exposure
- 6.4.4 R&D Intensity
- 6.4.5 Sustainability Maturity
- 6.5 Strategic Developments in Renewable Diesel (Last 24 Months)
- 6.5.1 Mergers, Acquisitions & Divestments
- 6.5.2 New Renewable Diesel Launches
- 6.5.3 Facility Expansions
- 6.5.4 Strategic Alliances, Joint Ventures & Partnerships
- 6.5.5 Distribution Expansion & Market Entry
- 6.5.6 Sustainability & ESG Initiatives
- 6.6 Competitive Strategy Mapping
- 6.6.1 Leader, Challenger, Follower & Niche Classification
- 6.6.2 Pricing Strategy Comparison
- 6.6.3 Channel Strategy Matrix
Note: Strategic developments are included based on their materiality and the availability of reliable information.
Chapter 7. Global Renewable Diesel Market – By Distribution Channel
- 7.1 Segment Overview
- 7.1.1 Volume & Revenue Split by Channel (2024 & 2032)
- 7.1.2 Channel Mix Evolution (2024-2032)
Chapter 8. Regional Market Analysis – Global Overview
- 8.1 Global Regional Overview
- 8.1.1 Regional Volume Share
- 8.1.2 Regional Revenue Share
- 8.1.3 Regional Volume by Region
- 8.1.4 Regional Revenue by Region
- 8.1.5 Regional Forecast Through 2032
- 8.2 Cross-Regional Segment Analysis
- 8.2.1 By Distribution Channel
- 8.2.2 By Brand/Price Tier
Chapter 9. North America Renewable Diesel Market
- 9.1 United States
- 9.2 Canada
- 9.3 Mexico
Chapter 10. Europe Renewable Diesel Market
- 10.1 Germany
- 10.2 France
- 10.3 Italy
- 10.4 United Kingdom
- 10.5 Spain
- 10.6 Poland
- 10.7 Russia
- 10.8 Netherlands
- 10.9 Belgium
- 10.10 Sweden
- 10.11 Denmark
- 10.12 Norway
- 10.13 Rest of Europe
Chapter 11. Asia Pacific Renewable Diesel Market
- 11.1 China
- 11.2 India
- 11.3 Japan
- 11.4 South Korea
- 11.5 Thailand
- 11.6 Indonesia
- 11.7 Vietnam
- 11.8 Malaysia
- 11.9 Australia
- 11.10 Rest of Asia Pacific
Chapter 12. Latin America Renewable Diesel Market
- 12.1 Brazil
- 12.2 Argentina
- 12.3 Colombia
- 12.4 Chile
- 12.5 Rest of Latin America
Chapter 13. Middle East Renewable Diesel Market
- 13.1 Saudi Arabia
- 13.2 United Arab Emirates
- 13.3 Turkey
- 13.4 Israel
- 13.5 Iran
- 13.6 Rest of the Middle East
Chapter 14. Africa Renewable Diesel Market
- 14.1 South Africa
- 14.2 Egypt
- 14.3 Nigeria
- 14.4 Morocco
- 14.5 Rest of Africa
Chapter 15. Renewable Diesel Company Profiles
- 15.1 [Company 01]
- 15.1.1 Company Overview
- 15.1.2 Key Management Personnel
- 15.1.3 Products & Services Portfolio
- 15.1.4 Financial Performance
- 15.1.5 Key Market Focus & Geographic Presence
- 15.1.6 Recent Developments & Strategic Initiatives
Note: The company profile list is preliminary and may change based on research findings, market developments, data availability, and client requirements.
Chapter 16. Appendices
- Appendix A – List of Abbreviations & Acronyms
- Appendix B – Industry Classification Code Reference – Full Series
- Appendix C – Production & Capacity Data Tables
- Appendix D – End-Use & Demand Base Tables
- Appendix E – Consumption & Replacement Rate Assumptions
- Appendix F – ASP Reference Tables
- Appendix G – Manufacturing & Facility Database
- Appendix H – Import-Export Data Tables
- Appendix I – Regulatory Summary Tables
- Appendix J – Primary Research Participant List (Anonymized)
- Appendix K – Primary Research Questionnaire Framework
- Appendix L – Data Sources & Bibliography
- Appendix M – Market Size Divergence & Source Comparison
Chapter 17. Research Methodology
- 17.1 Research Framework & Philosophy
- 17.2 Secondary Research – Sources, Hierarchy & Data Extraction
- 17.3 Data Modeling – Bottom-Up & Top-Down Market Sizing
- 17.4 Primary Research – Stakeholder Framework, LOI & Sample Sizes
- 17.5 Forecast Methodology – Regression, Scenario & Sensitivity Analysis
- 17.6 Quality Control – Four-Layer Validation Framework
- 17.7 Limitations & Standard Assumptions
- 17.8 Disclaimer
