
Market Overview
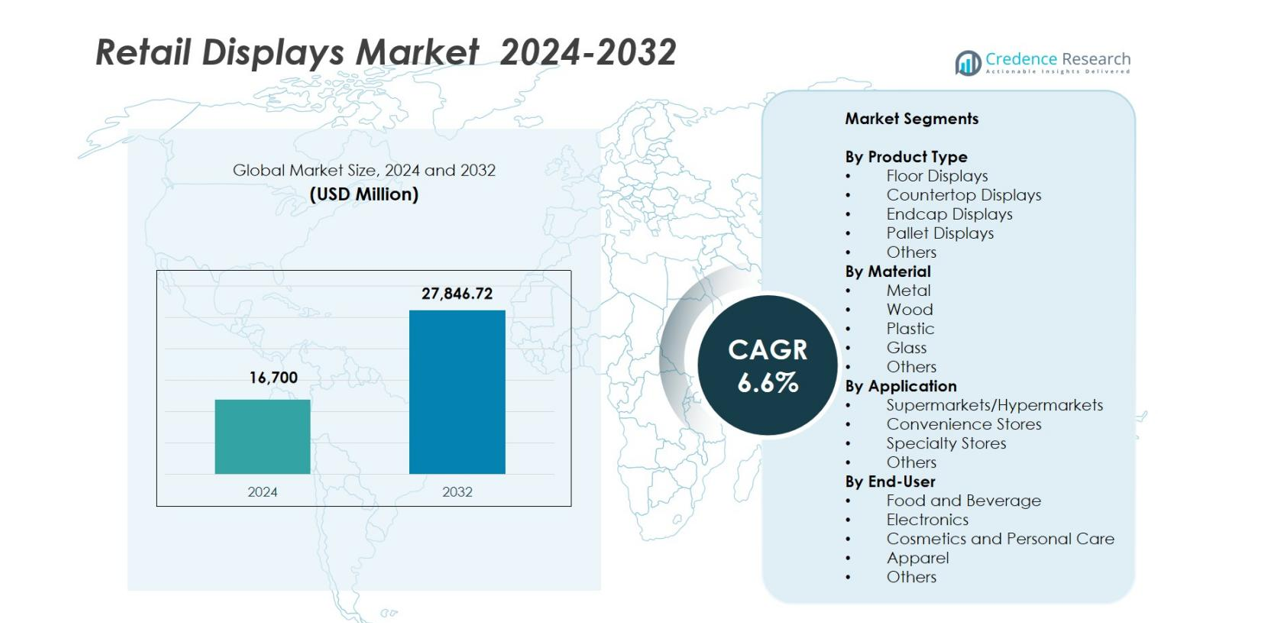
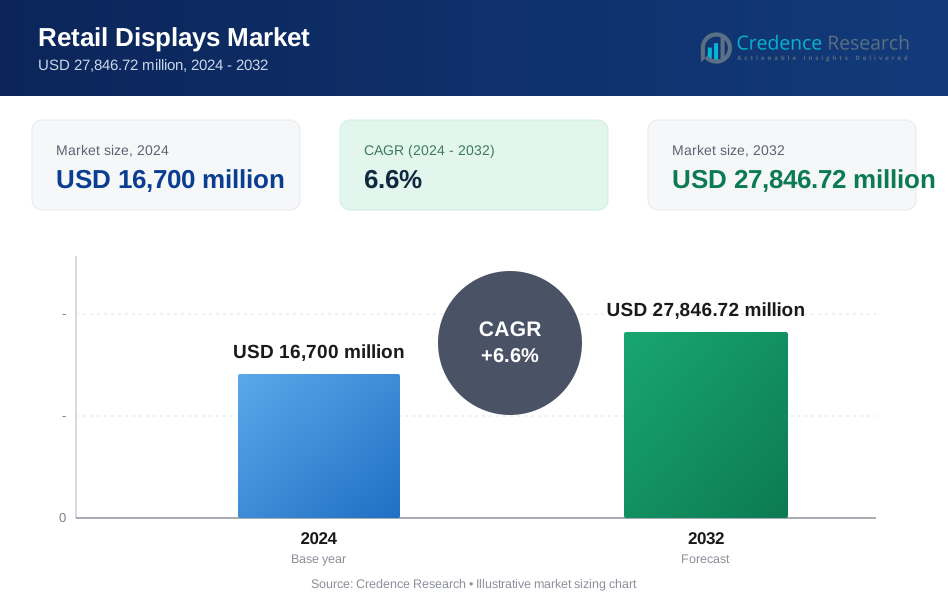
Retail Displays Market size was valued at USD 16,700 million in 2024 and is anticipated to reach USD 27,846.72 million by 2032, at a CAGR of 6.6% during the forecast period.
| REPORT ATTRIBUTE | DETAILS |
|---|---|
| Historical Period | 2020-2023 |
| Base Year | 2024 |
| Forecast Period | 2025-2032 |
| Retail Displays Market Size 2024 | USD 16,700 million |
| Retail Displays Market, CAGR | 6.6% |
| Retail Displays Market Size 2032 | USD 27,846.72 million |
Retail Displays Market demonstrates strong competition led by major players such as AU Optronics Corp., Sharp Corporation, BOE Technology Group Co., Ltd., Toshiba Corporation, Panasonic Corporation, Innolux Corporation, NEC Display Solutions Ltd., LG Display Co., Ltd., Sony Corporation, and Samsung Electronics Co., Ltd., all of which continue advancing display technologies, modular designs, and digital signage solutions to meet evolving retail needs. Regionally, North America dominated the market with a 32.4% share in 2024, driven by extensive store modernization and high adoption of digital retail technologies. Europe and Asia-Pacific followed, supported by growing retail infrastructure, sustainability-driven innovations, and rapid expansion of organized retail formats.
Market Insights
- Retail Displays Market was valued at USD 16,700 million in 2024 and is projected to reach USD 27,846.72 million by 2032, registering a 6.6% CAGR.
- Growth is driven by rising store modernization, increased focus on visual merchandising, and expanding adoption of modular and digital display systems across supermarkets, convenience stores, and specialty outlets.
- Sustainability-focused materials, smart digital signage, interactive displays, and omni-channel retail integration are emerging as key trends shaping product innovation and retailer purchasing behavior.
- The market includes strong players such as AU Optronics, Panasonic, Sharp, Innolux, NEC Display Solutions, LG Display, Sony, and Samsung, intensifying competition through technology upgrades and customizable solutions.
- North America led with 32.4% share, followed by Europe at 28.1% and Asia-Pacific at 27.6%, while floor displays dominated product types with 34.8% share, and metal-based materials led with 38.2% due to durability and long lifecycle advantages.
Market Segmentation Analysis
By Product Type
The Retail Displays market is dominated by floor displays, accounting for 34.8% of the market share in 2024. Their leadership stems from high visibility, larger display area, and strong suitability for promoting bulk items and seasonal products across supermarkets and hypermarkets. Countertop displays continue gaining traction due to rising impulse-buy strategies in convenience stores, while endcap and pallet displays benefit from growing retail merchandising automation. The increasing adoption of customizable and modular display systems further strengthens demand by enhancing flexibility and brand engagement at point-of-sale locations.
- For instance, the design agency Genesis Retail Displays has produced custom permanent POS (point-of-sale) setups for major retailers such as Woolworths and JB Hi‑Fi showing that modular and tailor-made display systems are already in active deployment in mature retail chains.
By Material
Metal-based retail displays lead the segment with 38.2% share in 2024, driven by their superior durability, load-bearing capacity, and longer lifecycle, making them highly preferred in high-traffic retail formats. Wood displays follow owing to premium aesthetics popular in specialty and luxury stores, while plastic displays remain attractive for cost-effective and lightweight deployment. Glass displays continue to grow in fashion and electronics retail due to improved product visibility. Rising focus on sustainability and recyclable materials is pushing manufacturers toward hybrid and eco-friendly display solutions.
- For instance, Lozier Corporation introduced enhanced steel gondola shelving and heavy-duty metal fixtures widely adopted by major U.S. retailers, reinforcing demand for long-life, high-capacity metal displays in high-traffic stores.
By Application
Supermarkets and hypermarkets dominated the application segment with 41.6% market share in 2024, supported by expansion of large-format retail and increasing demand for organized product presentation that improves customer navigation and boosts impulse purchases. Convenience stores are rapidly adopting compact, modular displays to optimize limited space, while specialty stores invest in premium and brand-centric formats to elevate visual merchandising. The Others category, including pharmacies and DIY stores, shows steady growth as retailers diversify product assortments and prioritize visually engaging, space-efficient display solutions.
Key Growth Drivers
Rising Retail Modernization and Store Renovation Programs
Global retail modernization initiatives are significantly accelerating demand for advanced display solutions as brands upgrade store layouts to enhance customer engagement and maximize product visibility. Retailers across supermarkets, convenience stores, and specialty outlets increasingly prioritize organized merchandising, data-driven shelf planning, and premium in-store experiences, driving adoption of innovative display formats such as modular units, digital-integrated displays, and customizable fixtures. Expanding retail footprints in emerging markets, along with investments in experiential retail environments, further boost display deployments. Shifting consumer preferences toward visually appealing product arrangements also promote frequent display upgrades, strengthening demand for durable, flexible retail display systems.
- For instance, Walmart deployed digital signage and interactive display systems through its retail media network upgrades in 2024, integrating software from Navori Labs to enhance in-store engagement and analytics-driven merchandising.
Growing Influence of Impulse Buying and Visual Merchandising Strategies
The rising importance of impulse purchasing behavior strongly contributes to market expansion, as retailers leverage strategic display placement to influence consumer decision-making at the point of sale. Displays such as floor units, countertop fixtures, and endcaps play a crucial role in highlighting promotional items, new product launches, and seasonal assortments. Brands increasingly rely on eye-catching designs, color psychology, and storytelling to elevate product appeal and capture shopper attention. Enhanced focus on category management, cross-merchandising, and shopper analytics drives adoption of customizable display systems. As competition intensifies across retail channels, effective visual merchandising becomes essential for differentiation, boosting demand for high-impact display formats that support dynamic retail strategies.
- For instance, Coca-Cola has repeatedly documented sales lifts from its branded floor-standing units placed near checkout zones, with certain campaigns reporting double-digit increases in impulse purchases during promotional periods.
Expansion of Omni-Channel and Digitally Enhanced Retail Ecosystems
The rapid integration of offline and online retail channels is driving strong demand for versatile display systems that support omni-channel shopping behaviors. Retailers invest in displays that accommodate smart labels, QR codes, digital screens, and interactive technologies to bridge physical and digital experiences. Adoption of in-store analytics, IoT-enabled tracking, and AI-driven recommendations further requires compatible display infrastructure. Click-and-collect models, pop-up stores, and experiential retail formats are expanding, encouraging deployment of modular and visually compelling displays. As omni-channel strategies mature, retailers increasingly rely on display systems as essential tools for seamless customer engagement, real-time promotions, and cost-efficient store operations.
Key Trends & Opportunities
Sustainability-Driven Display Innovation and Eco-Friendly Materials
Growing environmental consciousness is creating strong opportunities for manufacturers to develop eco-friendly retail displays using recyclable, biodegradable, and low-impact materials. Retailers with ESG commitments are shifting toward sustainable wood, metal hybrids, recycled plastics, and low-VOC coatings to align merchandising with sustainability goals. Circular design principles, such as reusability, disassembly, and modularity, are gaining traction, enabling retailers to minimize waste and extend display lifecycles. This sustainability shift also enhances brand image as consumers increasingly favor environmentally responsible stores. Manufacturers that invest in green production processes and traceable material sourcing stand to benefit from rising procurement demand across modern retail environments.
- For instance, IKEA expanded its use of FSC-certified wood and recycled materials across store fixtures, including modular shelving and display units, as part of its global commitment to source 100% renewable or recycled materials by 2030.
Increasing Adoption of Smart and Digital Retail Display Technologies
Digital transformation in retail environments presents major opportunities as stores integrate smart technologies into traditional display systems. Interactive screens, RFID-enabled shelves, LED signage, electronic shelf labels, and IoT-connected fixtures are becoming central to delivering personalized in-store experiences. These technologies support real-time pricing, dynamic promotions, inventory transparency, and enhanced shopper engagement. The rise of data-driven retailing encourages displays capable of capturing behavioral insights, optimizing product placement, and boosting conversion rates. As consumers expect seamless integration between digital and physical shopping, demand for intelligent display solutions continues to accelerate, creating strong opportunities for technology-driven vendors.
- For instance, Carrefour expanded its rollout of SES-imagotag’s VUSION electronic shelf label platform in Europe, integrating cloud-connected displays that support dynamic pricing, shelf monitoring, and in-store shopper analytics.
Key Challenges
High Costs Associated with Advanced and Customized Display Solutions
Despite strong demand for modern display systems, high costs remain a significant barrier to widespread adoption. Premium materials, advanced digital components, and custom designs increase overall production and installation expenses, restricting access for small and mid-sized retailers. Additional operational costs such as maintenance, energy usage, and software updates for digital displays further deter investment. These financial challenges slow modernization efforts and limit the uptake of technologically advanced retail displays. Manufacturers face pressure to balance innovation with affordability to cater to budget-sensitive retail environments without compromising display effectiveness.
Rapidly Changing Consumer Preferences and Shorter Product Lifecycles
Retailers must continuously adapt displays to reflect shifting consumer tastes, fast-changing trends, and evolving branding requirements. This results in shorter display lifecycles and frequent redesigns, increasing operational complexity and inventory turnover for manufacturers. Rapid product introductions and promotional cycles require displays that are easily adaptable, scalable, and quick to produce. These fluctuations can lead to forecasting challenges, cost overruns, and production inefficiencies. Manufacturers unable to align with rapidly evolving merchandising expectations risk losing competitiveness in an industry where agility, customization, and visual appeal are increasingly critical.
Regional Analysis
North America
North America held the largest share of the Retail Displays market with 32.4% in 2024, supported by strong investments in store modernization, premium visual merchandising, and omnichannel retail strategies. Major retailers across the U.S. and Canada continue upgrading display infrastructures to enhance product visibility and improve in-store engagement. The region benefits from high adoption of digital signage, intelligent display systems, and modular fixtures driven by competitive brand positioning. Growth in convenience formats and specialty retail further strengthens demand, while rising expectations for immersive shopping experiences encourage deployment of innovative, customizable display solutions.
Europe
Europe accounted for 28.1% of the Retail Displays market in 2024, propelled by extensive retail refurbishments, sustainability-focused display materials, and a strong base of luxury and specialty stores. Retailers increasingly prefer eco-friendly wooden and metal displays to meet EU sustainability mandates and enhance brand aesthetics. Demand grows across Germany, France, Italy, and the U.K. as organized retail expands. The region's focus on premium shopping environments, advanced merchandising systems, and digital integration accelerates display upgrades, while adoption of interactive screens and electronic shelf labels further boosts market penetration.
Asia-Pacific
Asia-Pacific captured 27.6% of the market share in 2024 and remains the fastest-growing region due to rapid retail expansion and rising investments in modern store formats. China, India, Japan, and Southeast Asia exhibit increasing demand for traditional and digital displays as organized retail accelerates. Urbanization, growing disposable incomes, and expansion of supermarkets and hypermarkets drive adoption of modular, cost-efficient display solutions. Large-scale manufacturing capabilities support competitive pricing, while e-commerce-to-offline integration fuels demand for omni-channel compatible displays that enhance shopper engagement and store efficiency.
Latin America
Latin America held 6.8% of the Retail Displays market in 2024, supported by the growth of supermarkets, convenience chains, and pharmacies across Brazil, Mexico, and Colombia. Retailers emphasize improved merchandising and branded display systems to attract customers in competitive environments. Cost-effective plastic and metal displays remain dominant due to budget limitations, with gradual adoption of digital displays. Consumer preference for modern store layouts and enhanced product visibility supports market growth, while increasing retail consolidation and entry of global retail chains strengthen long-term expansion opportunities despite economic volatility.
Middle East & Africa
The Middle East & Africa region accounted for 5.1% of the market share in 2024, driven by rapid retail infrastructure development, mall expansions, and rising presence of international brands. Gulf countries, especially the UAE and Saudi Arabia, invest heavily in premium display systems to elevate shopping aesthetics and support luxury retail formats. Emerging African retail hubs adopt durable and modular displays to improve merchandising efficiency. Growth in hypermarkets, specialty stores, and digital signage adoption reflects shifting consumer expectations for modern, visually engaging retail spaces across MEA.
Market Segmentations
By Product Type
- Floor Displays
- Countertop Displays
- Endcap Displays
- Pallet Displays
- Others
By Material
- Metal
- Wood
- Plastic
- Glass
- Others
By Application
- Supermarkets/Hypermarkets
- Convenience Stores
- Specialty Stores
- Others
By End-User
- Food and Beverage
- Electronics
- Cosmetics and Personal Care
- Apparel
- Others
By Geography
- North America
- U.S.
- Canada
- Mexico
- Europe
- Germany
- France
- U.K.
- Italy
- Spain
- Rest of Europe
- Asia Pacific
- China
- Japan
- India
- South Korea
- South-east Asia
- Rest of Asia Pacific
- Latin America
- Brazil
- Argentina
- Rest of Latin America
- Middle East & Africa
- GCC Countries
- South Africa
- Rest of the Middle East and Africa
Competitive Landscape
The Retail Displays market features a highly dynamic competitive landscape characterized by a mix of global display manufacturers, retail fixture specialists, and technology-driven signage providers. Key players such as Samsung Electronics Co., Ltd., LG Display Co., Ltd., Panasonic Corporation, Sony Corporation, Sharp Corporation, Toshiba Corporation, NEC Display Solutions Ltd., AU Optronics Corp., Innolux Corporation, and BOE Technology Group Co., Ltd. actively strengthen their positions through product innovation, customization capabilities, and expansion into smart display technologies. Companies increasingly focus on modular, lightweight, and sustainable materials to align with evolving retailer requirements. Digital transformation within retail is prompting major investments in interactive touchscreens, electronic shelf labels, LED signage, and IoT-enabled display systems, intensifying competition in the premium segment. Strategic partnerships with retailers, design consultancies, and technology providers further enhance product differentiation and global market penetration. Overall, competition continues to shift toward integrated, visually engaging, and technologically advanced display solutions.
Key Player Analysis
- AU Optronics Corp.
- Sharp Corporation
- BOE Technology Group Co., Ltd.
- Toshiba Corporation
- Panasonic Corporation
- Innolux Corporation
- NEC Display Solutions Ltd.
- LG Display Co., Ltd.
- Sony Corporation
- Samsung Electronics Co., Ltd.
Recent Developments
- In August 2025, Navori Labs acquired Signagelive creating what Navori calls the world’s largest independent, channel-only digital signage CMS platform by installed base.
- In June 2025, Albertsons Media Collective (part of Albertsons Companies) launched its in-store digital display network powered by STRATACACHE to offer interactive in-store advertising and brand-visibility solutions.
- In February 2025, STRATACACHE acquired SNED, a France-based LED solutions provider focused on pharmacy signage and related display systems
Report Coverage
The research report offers an in-depth analysis based on Product Type, Material, Application, End-User and Geography. It details leading market players, providing an overview of their business, product offerings, investments, revenue streams, and key applications. Additionally, the report includes insights into the competitive environment, SWOT analysis, current market trends, as well as the primary drivers and constraints. Furthermore, it discusses various factors that have driven market expansion in recent years. The report also explores market dynamics, regulatory scenarios, and technological advancements that are shaping the industry. It assesses the impact of external factors and global economic changes on market growth. Lastly, it provides strategic recommendations for new entrants and established companies to navigate the complexities of the market.
Future Outlook
- The market will experience steady growth as retailers continue investing in modern, visually engaging in-store environments.
- Digital and smart display technologies will gain wider adoption to enhance real-time promotions and shopper interaction.
- Sustainability initiatives will drive demand for eco-friendly, recyclable, and modular display materials.
- Omni-channel retail strategies will increase the need for displays that integrate digital content and data-driven merchandising.
- Customizable and flexible display formats will see rising preference to support frequent product rotations and promotions.
- Growth of convenience and specialty stores will boost demand for compact, space-efficient display systems.
- Advancements in IoT and analytics will enhance display functionality through improved shopper behavior tracking.
- Emerging markets will contribute significantly due to rapid retail expansion and rising urbanization.
- Partnerships between display manufacturers and retail technology providers will accelerate product innovation.
- Increasing competition will push companies to focus on design differentiation, durability, and cost efficiency.
Request a Free Sample
Fill in your details and we'll send you a free sample report.
- Sample data tables & charts
- Research methodology
Need a Custom Version of This Report?
Tailor the scope, geography, or segments to your exact requirements.
- Custom geography or segment scope
- Direct access to our analyst team
Frequently Asked Questions
What is the current market size for Retail Displays Market, and what is its projected size in 2032?
At what Compound Annual Growth Rate is the Retail Displays Market projected to grow between 2024 and 2032?
Which Retail Displays Market segment held the largest share in 2024?
What are the primary factors fueling the growth of the Retail Displays Market?
Who are the leading companies in the Retail Displays Market?
Which region commanded the largest share of the Retail Displays Market in 2024?
Table of Content
Chapter 1. Report Introduction
- 1.1 Report Description & Purpose
- 1.1.1 Report Title & Market Definition
- 1.1.2 Unique Selling Propositions (USP) & Key Differentiators
- 1.1.3 Value Proposition for Stakeholders
- 1.2 Research Objectives
- 1.2.1 Market Sizing Objectives (Volume & Revenue)
- 1.2.2 Segmentation Objectives
- 1.2.3 Competitive Intelligence Objectives
- 1.2.4 Forecast & Scenario Objectives
- 1.3 Report Scope
- 1.3.1 Retail Displays Scope – Types & Subtypes Covered
- 1.3.2 Geographic Scope – Regions & Countries Covered
- 1.3.3 Historical Period, Base Year & Forecast Period (2024; forecast to 2032)
- 1.3.4 Inclusions & Exclusions
- 1.4 HS Code & Classification Framework
- 1.5 Currency, Units & Pricing Basis
- 1.6 Target Stakeholders
- 1.7 Limitations & Assumptions
Chapter 2. Executive Summary
- 2.1 Global Retail Displays Market Snapshot
- 2.1.1 Market Size – Historical (2024) & Forecast (2024-2032) (2024: USD 16,700 million → 2032: USD 27,846.72 million)
- 2.1.2 Volume & Revenue – Global Totals
- 2.1.3 Key Market Highlights – Top Five Facts
- 2.2 Retail Displays Market Segmentation Snapshot
- 2.2.1 Market Split by Region – 2024 vs. 2032
- 2.3 Competitive Snapshot
- 2.3.1 Top 10 Players by Revenue Share – 2024
- 2.3.2 Top 10 Players by Volume Share – 2024
- 2.3.3 Recent Strategic Developments (18-Month Summary)
- 2.4 Key Investment Highlights & Strategic Conclusions
Chapter 3. Retail Displays Market Dynamics & Industry Analysis
- 3.1 Market Overview & Context
- 3.1.1 Retail Displays Market Position in the Broader Automotive Value Chain
- 3.1.2 OEM vs. Replacement Market Dynamics
- 3.1.3 Market Maturity & Development Stage by Region
- 3.2 Retail Displays Market Drivers
- 3.3 Retail Displays Market Restraints & Challenges
- 3.4 Retail Displays Market Opportunities
- 3.5 Porter's Five Forces Analysis
- 3.5.1 Threat of New Entrants
- 3.5.2 Bargaining Power of Suppliers
- 3.5.3 Bargaining Power of Buyers
- 3.5.4 Threat of Substitutes
- 3.5.5 Competitive Rivalry – Intensity Assessment
- 3.6 Retail Displays Value Chain Analysis
- 3.6.1 Upstream – Raw Material/Input Suppliers
- 3.6.1.1 Raw Material/Input 1
- 3.6.1.2 Raw Material/Input 2
- 3.6.1.3 Raw Material/Input 3
- 3.6.2 Midstream – Production/Manufacturing/Service Delivery
- 3.6.2.1 Production/Process Overview
- 3.6.2.2 Key Facility Locations & Capacity by Manufacturer
- 3.6.3 Downstream – Distribution & End Consumer
- 3.6.3.1 Primary Channel – B2B/OEM
- 3.6.3.2 Secondary Channels – Dealer, Retail, Online, Direct
- 3.6.4 Value Chain Profitability Analysis
- 3.6.1 Upstream – Raw Material/Input Suppliers
- 3.7 PESTEL Analysis
- 3.7.1 Political Factors
- 3.7.2 Economic Factors
- 3.7.3 Social Factors
- 3.7.4 Technological Factors
- 3.7.5 Environmental Factors
- 3.7.6 Legal Factors
- 3.8 Retail Displays Supply Chain Analysis
- 3.8.1 Raw Material/Input Supply Risk Assessment
- 3.8.2 Manufacturing Concentration Risk (Geographic Exposure)
- 3.8.3 Trade Disruption Impact Analysis
- 3.9 Regulatory & Policy Landscape
Note: The regulatory and policy landscape section covers regulations based on their applicability to the market, Retail Displays category, geography, and scope of the study. Only regulatory frameworks with a material impact on operations, compliance, trade, sustainability, or market access are analyzed in detail.
Chapter 4. Key Investment Pockets & Opportunity Analysis
- 4.1 Retail Displays Market Attractiveness Analysis
- 4.1.1 By Region – Investment Attractiveness Matrix (Volume × CAGR)
- 4.2 Absolute Revenue Growth Opportunity
- 4.2.1 By Region – Absolute USD Growth Through 2032
- 4.3 Incremental Volume Opportunity
- 4.3.1 By Region – Incremental Volume Through 2032
- 4.3.2 Segment – Incremental Volume
- 4.4 Emerging Submarket Opportunity Deep Dive (Subject to Applicability)
- 4.5 Emerging Market Opportunity Scorecards
- 4.5.1 United States
- 4.5.2 Europe
- 4.5.3 Asia
- 4.5.4 Middle East & Africa
Note: Emerging Market Opportunity Scorecards will be included based on relevance and strategic importance. Regions listed are indicative and may vary depending on data availability and market dynamics.
Chapter 5. Retail Displays Import-Export Analysis & Trade Flows
- 5.1 Global Trade Overview
- 5.1.1 Global Export Value by Country (2024)
- 5.1.2 Global Export Volume by Country (2024)
- 5.1.3 Global Import Value by Country (2024)
- 5.1.4 Global Import Volume by Country (2024)
- 5.1.5 Net Trade Balance by Country (2024)
- 5.2 Export Analysis – Segment
- 5.2.1 Type 1 (HS Code)
- 5.2.2 Type 2 (HS Code)
- 5.2.3 Type 3 (HS Code)
- 5.2.4 Type 4 (HS Code)
- 5.2.5 Type 5 (HS Code)
- 5.3 Import Analysis – Segment
- 5.3.1 Type 1 (HS Code)
- 5.3.2 Type 2 (HS Code)
- 5.3.3 Type 3 (HS Code)
- 5.3.4 Type 4 (HS Code)
- 5.3.5 Type 5 (HS Code)
- 5.4 Average Unit Trade Prices
- 5.4.1 Average Export Price – Segment & Country
- 5.4.2 Average Import Price – Segment & Source Country
- 5.4.3 Price Trends (2024)
- 5.5 Key Trade Route Analysis
- 5.5.1 Trade Route 1
- 5.5.2 Trade Route 2
- 5.5.3 Trade Route 3
- 5.5.4 Trade Route 4
- 5.5.5 Trade Route 5
- 5.6 Trade Policy Impact Assessment
- 5.6.1 US Anti-Dumping & Section 301 Tariffs
- 5.6.2 EU Customs Union Impact
- 5.6.3 Major Free Trade Agreements
- 5.6.4 USMCA Rules of Origin
Note: Trade policy analysis will be included only where relevant to the Retail Displays market.
Chapter 6. Competitive Landscape & Company Benchmarking
- 6.1 Retail Displays Market Concentration & Structure
- 6.1.1 Herfindahl-Hirschman Index (HHI) – vs. 2024
- 6.1.2 Tier 1, Tier 2 & Tier 3 Market Structure
- 6.1.3 Global, Regional & Local Player Dynamics
- 6.2 Retail Displays Market Share Analysis – 2024
- 6.2.1 Global Revenue Share by Company
- 6.2.2 Global Volume Share by Company
- 6.2.3 Regional Revenue Share
- 6.2.4 Market Share Evolution ( vs. 2024)
- 6.2.5 OEM Segment Share by Company
- 6.2.6 Replacement Segment Share by Company
- 6.3 Production/Delivery Capacity & Facility Analysis
- 6.3.1 Global Installed Capacity
- 6.3.2 Capacity Utilization Rates
- 6.3.3 Production/Output Volume
- 6.3.4 Facility Locations & Capacity Map
- 6.3.5 Planned Capacity Additions
- 6.4 Retail Displays Competitive Benchmarking Matrix
- 6.4.1 Revenue, Volume, CAGR & Profitability Comparison
- 6.4.2 Channel Revenue Mix
- 6.4.3 Geographic Revenue Exposure
- 6.4.4 R&D Intensity
- 6.4.5 Sustainability Maturity
- 6.5 Strategic Developments in Retail Displays (Last 24 Months)
- 6.5.1 Mergers, Acquisitions & Divestments
- 6.5.2 New Retail Displays Launches
- 6.5.3 Facility Expansions
- 6.5.4 Strategic Alliances, Joint Ventures & Partnerships
- 6.5.5 Distribution Expansion & Market Entry
- 6.5.6 Sustainability & ESG Initiatives
- 6.6 Competitive Strategy Mapping
- 6.6.1 Leader, Challenger, Follower & Niche Classification
- 6.6.2 Pricing Strategy Comparison
- 6.6.3 Channel Strategy Matrix
Note: Strategic developments are included based on their materiality and the availability of reliable information.
Chapter 7. Global Retail Displays Market – By Distribution Channel
- 7.1 Segment Overview
- 7.1.1 Volume & Revenue Split by Channel (2024 & 2032)
- 7.1.2 Channel Mix Evolution (2024-2032)
Chapter 8. Regional Market Analysis – Global Overview
- 8.1 Global Regional Overview
- 8.1.1 Regional Volume Share
- 8.1.2 Regional Revenue Share
- 8.1.3 Regional Volume by Region
- 8.1.4 Regional Revenue by Region
- 8.1.5 Regional Forecast Through 2032
- 8.2 Cross-Regional Segment Analysis
- 8.2.1 By Distribution Channel
- 8.2.2 By Brand/Price Tier
Chapter 9. North America Retail Displays Market
- 9.1 United States
- 9.2 Canada
- 9.3 Mexico
Chapter 10. Europe Retail Displays Market
- 10.1 Germany
- 10.2 France
- 10.3 Italy
- 10.4 United Kingdom
- 10.5 Spain
- 10.6 Poland
- 10.7 Russia
- 10.8 Netherlands
- 10.9 Belgium
- 10.10 Sweden
- 10.11 Denmark
- 10.12 Norway
- 10.13 Rest of Europe
Chapter 11. Asia Pacific Retail Displays Market
- 11.1 China
- 11.2 India
- 11.3 Japan
- 11.4 South Korea
- 11.5 Thailand
- 11.6 Indonesia
- 11.7 Vietnam
- 11.8 Malaysia
- 11.9 Australia
- 11.10 Rest of Asia Pacific
Chapter 12. Latin America Retail Displays Market
- 12.1 Brazil
- 12.2 Argentina
- 12.3 Colombia
- 12.4 Chile
- 12.5 Rest of Latin America
Chapter 13. Middle East Retail Displays Market
- 13.1 Saudi Arabia
- 13.2 United Arab Emirates
- 13.3 Turkey
- 13.4 Israel
- 13.5 Iran
- 13.6 Rest of the Middle East
Chapter 14. Africa Retail Displays Market
- 14.1 South Africa
- 14.2 Egypt
- 14.3 Nigeria
- 14.4 Morocco
- 14.5 Rest of Africa
Chapter 15. Retail Displays Company Profiles
- 15.1 [Company 01]
- 15.1.1 Company Overview
- 15.1.2 Key Management Personnel
- 15.1.3 Products & Services Portfolio
- 15.1.4 Financial Performance
- 15.1.5 Key Market Focus & Geographic Presence
- 15.1.6 Recent Developments & Strategic Initiatives
Note: The company profile list is preliminary and may change based on research findings, market developments, data availability, and client requirements.
Chapter 16. Appendices
- Appendix A – List of Abbreviations & Acronyms
- Appendix B – Industry Classification Code Reference – Full Series
- Appendix C – Production & Capacity Data Tables
- Appendix D – End-Use & Demand Base Tables
- Appendix E – Consumption & Replacement Rate Assumptions
- Appendix F – ASP Reference Tables
- Appendix G – Manufacturing & Facility Database
- Appendix H – Import-Export Data Tables
- Appendix I – Regulatory Summary Tables
- Appendix J – Primary Research Participant List (Anonymized)
- Appendix K – Primary Research Questionnaire Framework
- Appendix L – Data Sources & Bibliography
- Appendix M – Market Size Divergence & Source Comparison
Chapter 17. Research Methodology
- 17.1 Research Framework & Philosophy
- 17.2 Secondary Research – Sources, Hierarchy & Data Extraction
- 17.3 Data Modeling – Bottom-Up & Top-Down Market Sizing
- 17.4 Primary Research – Stakeholder Framework, LOI & Sample Sizes
- 17.5 Forecast Methodology – Regression, Scenario & Sensitivity Analysis
- 17.6 Quality Control – Four-Layer Validation Framework
- 17.7 Limitations & Standard Assumptions
- 17.8 Disclaimer
