Market Overview
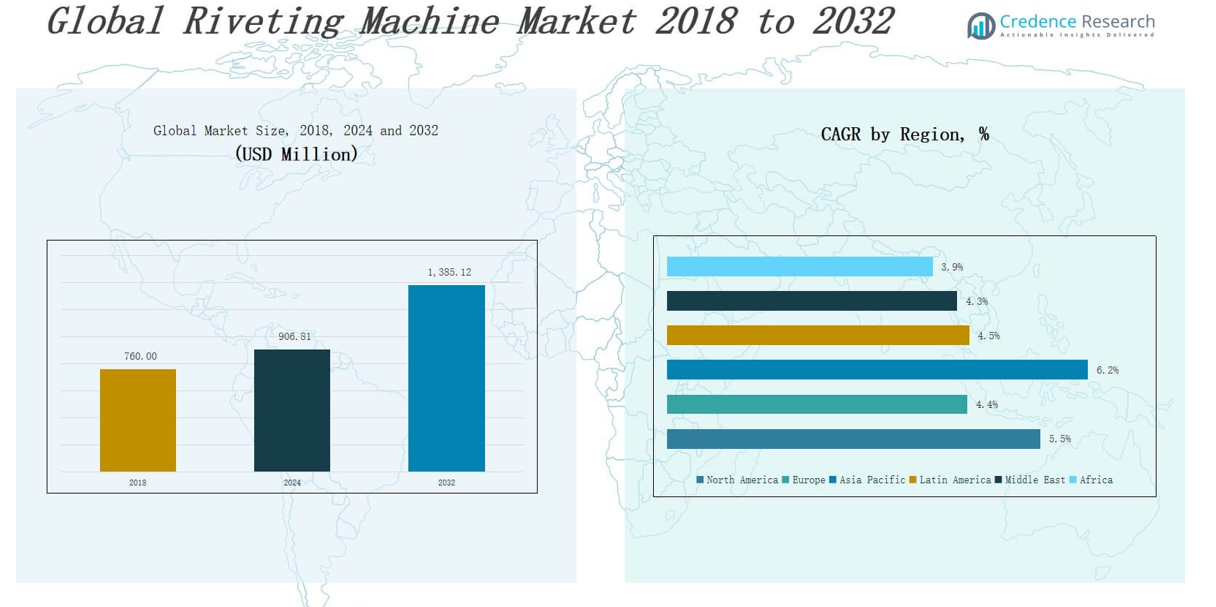
The Riveting Machine Market size was valued at USD 760.00 million in 2018 to USD 906.81 million in 2024 and is anticipated to reach USD 1,385.12 million by 2032, at a CAGR of 5.49 % during the forecast period.
| REPORT ATTRIBUTE |
DETAILS |
| Historical Period |
2020-2023 |
| Base Year |
2024 |
| Forecast Period |
2025-2032 |
| Riveting Machine Market Size 2024 |
USD 906.81 million |
| Riveting Machine Market, CAGR |
5.49% |
| Riveting Machine Market Size 2032 |
USD 1,385.12 million |
The Riveting Machine Market is driven by the growing demand for automation and precision in assembly processes across automotive, aerospace, and industrial manufacturing sectors. As industries seek faster, more consistent fastening solutions to enhance productivity and reduce operational costs, riveting machines offer reliable performance and lower maintenance compared to alternative joining technologies. The rising adoption of lightweight materials such as aluminum and composites in transportation sectors further fuels the need for advanced riveting systems capable of handling diverse materials. Trends indicate a shift toward CNC and servo-controlled riveting machines that deliver higher accuracy, programmable functionality, and real-time monitoring. The integration of Industry 4.0 technologies, including IoT-enabled diagnostics and predictive maintenance, is enhancing system efficiency and minimizing downtime. Additionally, the demand for environmentally sustainable and energy-efficient equipment is influencing product innovation. Growing investments in infrastructure and electric vehicles (EVs), coupled with labor shortages in manufacturing, continue to accelerate the adoption of automated riveting solutions worldwide.
The Riveting Machine Market spans key regions including North America, Europe, Asia Pacific, Latin America, the Middle East, and Africa. Asia Pacific leads the market in terms of revenue, driven by rapid industrialization and manufacturing expansion in China, India, and Southeast Asia. North America and Europe follow with strong demand from the automotive, aerospace, and industrial machinery sectors. Latin America and the Middle East show steady growth backed by infrastructure and construction projects, while Africa remains an emerging market with increasing adoption. Key players operating across these regions include Baltec, Orbitform, Chicago Rivet & Machine Co., AGME Automated Assembly Solutions, Edward Segal Inc., IRIVET, and S. Dunkes GmbH. These companies focus on technological advancement, automation, and precision to meet diverse application requirements globally and sustain their competitive edge.
Market Insights
- The Riveting Machine Market was valued at USD 760.00 million in 2018, reached USD 906.81 million in 2024, and is projected to grow to USD 1,385.12 million by 2032 at a CAGR of 5.49%.
- Demand is fueled by the need for automation, precision, and cost-effective fastening in automotive, aerospace, and industrial manufacturing sectors.
- The market benefits from the shift to lightweight materials like aluminum and composites, requiring advanced riveting systems for structural integrity.
- CNC and servo-controlled machines with programmable features and real-time monitoring are gaining popularity for enhanced productivity.
- Integration of Industry 4.0 tools like IoT-enabled diagnostics and predictive maintenance is improving operational efficiency and reducing downtime.
- Asia Pacific leads the market in revenue, followed by North America and Europe; Latin America, Middle East, and Africa show steady growth potential.
- Key players include Baltec, Orbitform, Chicago Rivet & Machine Co., AGME, Edward Segal Inc., IRIVET, and S. Dunkes GmbH, competing through automation, precision, and regional expansion.
Access crucial information at unmatched prices!
Request your sample report today & start making informed decisions powered by Credence Research Inc.!
Download Sample
Market Drivers
Rising Demand for Automation and Production Efficiency
The Riveting Machine Market is gaining traction due to the increased push toward automation across manufacturing sectors. Companies are seeking to improve production speed, reduce human error, and ensure consistent quality in high-volume assembly lines. Riveting machines deliver these outcomes with precision and repeatability. Industries such as automotive, aerospace, and appliances rely heavily on efficient fastening processes. Automation also addresses labor shortages and helps optimize workflows. It enables manufacturers to reduce costs and meet growing output targets. Investments in smart factories further support the adoption of advanced riveting solutions.
- For instance, Airbus uses low-voltage electromagnetic riveting (LVER) machines at its Broughton, UK plant to assemble A320 wing panels, with robots installing over 3,000 blind rivets per A330 wing, ensuring precise, repeatable fastening and reducing assembly errors.
Growing Use of Lightweight Materials in Key Industries
The increasing use of lightweight materials such as aluminum, magnesium, and composites in transportation and aerospace sectors is a significant driver for the Riveting Machine Market. These materials require precise fastening techniques that traditional welding methods cannot offer. Riveting machines meet this need with minimal thermal distortion and structural compromise. The trend toward fuel efficiency and emission reduction promotes material innovation. Riveting technology evolves to accommodate multi-material joining. It ensures structural integrity without compromising weight goals.
- For instance, Airbus A350 XWB incorporates over 70% advanced materials, including composites, titanium, and modern aluminum alloys, with riveting machines adapted to join these dissimilar materials efficiently and reliably in the aircraft’s fuselage and wing structures.
Expansion of the Electric Vehicle and Renewable Energy Sectors
The rapid expansion of electric vehicle production and renewable energy projects is contributing to the growth of the Riveting Machine Market. EV assembly requires high-strength and lightweight joints, especially for battery casings and structural frames. Riveting solutions offer clean, reliable fastening without introducing thermal or chemical stress. Renewable energy components such as wind turbine blades and solar panel frames also benefit from riveting processes. It enhances structural durability and supports sustainable infrastructure development. The market benefits from rising investment in clean energy technologies.
Emphasis on Technological Integration and Smart Manufacturing
The integration of Industry 4.0 technologies is transforming the capabilities of the Riveting Machine Market. Smart riveting systems equipped with sensors, data analytics, and remote monitoring tools are becoming standard in advanced manufacturing setups. These features allow real-time quality checks, predictive maintenance, and process optimization. It reduces downtime and improves operational efficiency. Demand for customization and digital control is reshaping machine configurations. Manufacturers increasingly prioritize user-friendly interfaces and programmable functions. The shift to intelligent equipment supports long-term production agility and quality assurance.
Market Trends
Adoption of CNC and Servo-Controlled Riveting Systems
The Riveting Machine Market is witnessing a shift toward CNC and servo-controlled machines that offer superior accuracy, programmable control, and adaptability. These systems support real-time adjustments and reduce manual intervention, which increases efficiency and lowers operational errors. Servo-based machines are ideal for applications requiring high precision and repeatability. They also support energy-saving features and faster cycle times. Manufacturers prefer these machines for their ability to handle varied materials and joint configurations. It enhances flexibility in automated production environments.
- For instance, FMW Friedrich’s CNC riveting machines feature high-resolution multi-touch controls and can process different rivets in a single operation, offering short changeover times and high travel speeds up to 400 mm/s, which directly enhances flexibility and reduces operational costs.
Integration of Industry 4.0 and Smart Monitoring Features
Smart manufacturing is shaping the future of the Riveting Machine Market through the integration of Industry 4.0 technologies. Machines now feature IoT-enabled diagnostics, remote monitoring, and predictive maintenance tools. These capabilities allow operators to track machine health, optimize performance, and prevent unplanned downtime. Data-driven insights from connected machines improve decision-making and reduce overall maintenance costs. It helps in achieving operational efficiency and longer equipment life. Adoption of smart technologies is expanding across both large-scale and small-scale facilities.
- For instance, Stanley Engineered Fastening’s BR12PP-8 Process Monitoring System enables real-time quality data capture and connectivity to factory PLCs, enhancing assembly accuracy and traceability.
Customization and Modular Designs for Diverse Applications
Manufacturers in the Riveting Machine Market are offering customizable and modular machines to cater to the unique needs of various industries. This trend supports flexible production lines where quick tooling changes and scalability are essential. Modular systems allow users to adapt to different rivet types, sizes, and application requirements. It enhances cost-efficiency and production adaptability. Demand for tailored solutions is increasing in sectors like automotive, construction, and consumer electronics. Versatility in design contributes to faster deployment and improved equipment utilization.
Rising Preference for Environmentally Friendly Joining Techniques
Environmental considerations are influencing the adoption of riveting machines that minimize energy consumption and reduce emissions. Compared to traditional welding, riveting generates no fumes and requires less power, making it suitable for sustainable manufacturing practices. Manufacturers are designing quieter, more energy-efficient machines that align with global environmental standards. The Riveting Machine Market is aligning with green manufacturing goals across developed and developing economies. It supports compliance with safety and sustainability regulations. Demand for eco-friendly solutions continues to shape product development strategies.
Market Challenges Analysis
High Initial Investment and Maintenance Costs
The Riveting Machine Market faces challenges due to the high upfront cost of advanced automated systems, particularly for small and medium-sized enterprises. Investing in servo-controlled and CNC-integrated machines requires significant capital, which can limit adoption in cost-sensitive markets. Maintenance of these machines also demands specialized technicians and scheduled service routines, adding to long-term operational expenses. It creates a financial barrier for manufacturers operating under tight budgets. Frequent component replacement and calibration can affect productivity if not managed efficiently. These cost constraints slow the penetration of advanced systems in developing economies.
Limited Compatibility with Complex and Evolving Materials
The increasing use of advanced composites and multi-material assemblies poses challenges for the Riveting Machine Market. Some traditional machines struggle to adapt to the varying mechanical properties of new materials used in automotive and aerospace applications. It requires specialized tooling and flexible configurations, which are not always readily available. Adapting machines for new substrates involves technical complexities and delays in implementation. Manufacturers must continually upgrade their systems to match evolving industry requirements. Limited compatibility can reduce operational flexibility and affect production timelines.
Market Opportunities
Expansion of Electric Vehicles and Lightweight Assemblies
The accelerating growth of the electric vehicle (EV) market presents significant opportunities for the Riveting Machine Market. EV manufacturing demands lightweight and high-strength components, which require precise and non-thermal joining solutions. Riveting machines offer consistent performance in assembling battery enclosures, structural elements, and lightweight frames. It supports manufacturers aiming to reduce vehicle weight without compromising durability. As global EV production scales up, demand for automated riveting systems will rise sharply. Suppliers can benefit by offering solutions tailored for EV-specific applications.
Rising Demand from Emerging Markets and Infrastructure Development
Emerging economies are witnessing increased industrial activity and infrastructure investments, opening new growth avenues for the Riveting Machine Market. Construction, transportation, and machinery sectors in regions like Southeast Asia, Latin America, and Africa are investing in modern assembly technologies. Riveting machines offer cost-effective, durable solutions for metal joining across these sectors. It provides an attractive alternative to welding where precision and minimal heat input are required. Growing demand for localized manufacturing and automation in these markets creates long-term opportunities for global and regional players.
Market Segmentation Analysis:
By Type
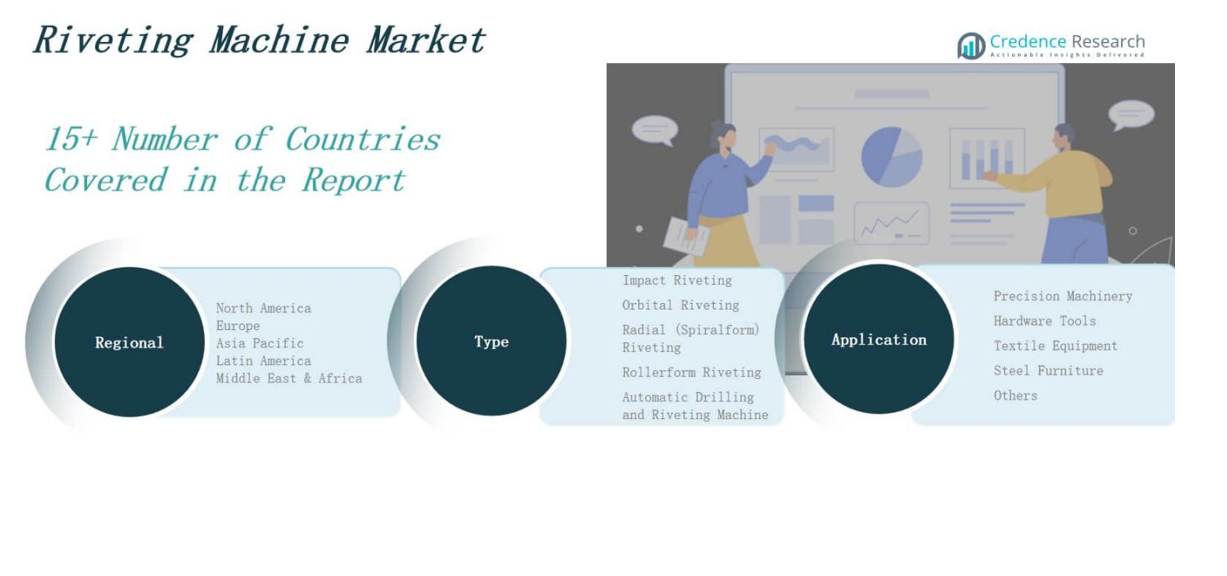
The Riveting Machine Market is segmented into Impact Riveting, Orbital Riveting, Radial (Spiralform) Riveting, Rollerform Riveting, and Automatic Drilling and Riveting Machines. Impact riveting holds a major share due to its speed and cost-efficiency, making it ideal for high-volume production. Orbital riveting is preferred for applications requiring low-stress, clean joints. Radial riveting offers precise, aesthetically superior joints with minimal distortion. Rollerform riveting serves cylindrical or delicate assemblies. Automatic drilling and riveting machines are gaining traction in aerospace and heavy industries due to their high throughput and automation benefits.
- For instance, Stryver designed and built a high-speed custom riveting machine for automotive applications, enabling operators to efficiently rivet stampings together with minimal opportunity for error.
By Application
Based on application, the market includes Precision Machinery, Hardware Tools, Textile Equipment, Steel Furniture, and Others. Precision machinery drives steady demand due to the need for accurate, durable joints in complex assemblies. Hardware tools segment benefits from mass production of hand tools and mechanical devices. Textile equipment relies on reliable fastening of metal components used in industrial sewing and weaving machines. Steel furniture applications require robust and efficient assembly systems. The “Others” segment includes consumer electronics, appliances, and niche industrial products using lightweight and composite parts that require reliable riveting processes.
- For instance, Hettich’s Systema Top 2000 drawer system is widely used in office furniture, offering precision runners with load capacities up to 45 kg and advanced features like central locking and soft-closing, ensuring both strength and smooth operation in intricate assemblies.
Segments:
Based on Type:
- Impact Riveting
- Orbital Riveting
- Radial (Spiralform) Riveting
- Rollerform Riveting
- Automatic Drilling and Riveting Machine
Based on Application
- Precision Machinery
- Hardware Tools
- Textile Equipment
- Steel Furniture
- Others
Based on Region
- North America
- Europe
- Germany
- France
- U.K.
- Italy
- Spain
- Rest of Europe
- Asia Pacific
- China
- Japan
- India
- South Korea
- South-east Asia
- Rest of Asia Pacific
- Latin America
- Brazil
- Argentina
- Rest of Latin America
- Middle East & Africa
- GCC Countries
- South Africa
- Rest of the Middle East and Africa
Regional Analysis
North America
The North America Riveting Machine Market size was valued at USD 161.88 million in 2018 to USD 189.15 million in 2024 and is anticipated to reach USD 288.25 million by 2032, at a CAGR of 5.5% during the forecast period. North America holds a significant share of the Riveting Machine Market, driven by the strong presence of automotive, aerospace, and defense manufacturing. The U.S. leads the region, supported by high adoption of automated and servo-controlled riveting systems. Growing demand for lightweight components in electric vehicles and aircraft supports market expansion. It benefits from early integration of Industry 4.0 technologies across production facilities. Investments in R&D and infrastructure modernization also contribute to regional growth.
Europe
The Europe Riveting Machine Market size was valued at USD 142.12 million in 2018 to USD 160.30 million in 2024 and is anticipated to reach USD 225.43 million by 2032, at a CAGR of 4.4% during the forecast period. Europe remains a mature market with steady demand from the automotive, industrial equipment, and precision engineering sectors. Germany, France, and Italy are key contributors due to their manufacturing strength and emphasis on process quality. It sees strong adoption of orbital and radial riveting systems for high-precision applications. The push for sustainable and energy-efficient production methods supports the use of eco-friendly riveting machines. Regulatory standards on quality and worker safety further drive the transition toward automated systems.
Asia Pacific
The Asia Pacific Riveting Machine Market size was valued at USD 353.40 million in 2018 to USD 431.50 million in 2024 and is anticipated to reach USD 695.75 million by 2032, at a CAGR of 6.2% during the forecast period. Asia Pacific dominates the Riveting Machine Market, accounting for the largest market share. Rapid industrialization and expanding automotive and electronics manufacturing in China, India, South Korea, and Japan fuel demand. It benefits from low production costs, rising export volumes, and government incentives for local manufacturing. The need for cost-effective, high-output riveting systems is prominent across sectors. Urban infrastructure development and regional expansion of aerospace activities also support market growth.
Latin America
The Latin America Riveting Machine Market size was valued at USD 44.61 million in 2018 to USD 52.68 million in 2024 and is anticipated to reach USD 74.20 million by 2032, at a CAGR of 4.5% during the forecast period. Latin America holds a moderate share in the global Riveting Machine Market, with Brazil and Mexico leading regional adoption. Growing demand for automotive components, construction equipment, and metal furniture supports equipment upgrades. It sees gradual automation in industrial processes as local manufacturers focus on productivity. Economic diversification and new investments in manufacturing infrastructure open opportunities for advanced riveting systems. Limited skilled labor also encourages interest in user-friendly and semi-automated machines.
Middle East
The Middle East Riveting Machine Market size was valued at USD 31.31 million in 2018 to USD 35.18 million in 2024 and is anticipated to reach USD 48.90 million by 2032, at a CAGR of 4.3% during the forecast period. The Middle East market is growing steadily due to infrastructure projects, industrial development, and defense sector investments. It sees rising demand from metal fabrication, transportation, and energy industries. Countries such as the UAE and Saudi Arabia are focusing on non-oil industrial growth, supporting machinery demand. Riveting machines serve regional manufacturers seeking durable and efficient assembly systems. Adoption remains gradual but is expected to accelerate with policy-driven industrial expansion. Automation and equipment modernization are gaining attention in public and private sectors.
Africa
The Africa Riveting Machine Market size was valued at USD 26.68 million in 2018 to USD 38.00 million in 2024 and is anticipated to reach USD 52.59 million by 2032, at a CAGR of 3.9% during the forecast period. Africa represents a small but growing share of the Riveting Machine Market. Industrial activity in South Africa, Egypt, and parts of West Africa is supporting machinery demand. It is driven by infrastructure development, automotive assembly, and consumer goods manufacturing. Manual riveting tools dominate, but interest in semi-automated systems is increasing. Cost and lack of technical expertise remain barriers to rapid adoption. Market growth depends on investment in localized manufacturing and skill development programs.
Shape Your Report to Specific Countries or Regions & Enjoy 30% Off!
Key Player Analysis
- Baltec
- Orbitform
- Chicago Rivet & Machine Co.
- National Rivet & Manufacturing Co.
- AGME Automated Assembly Solutions
- Dunkes GmbH
- Edward Segal Inc.
- Superior Rivet Machines
- IRIVET
- Atoli Machinery Co., Ltd.
Competitive Analysis
The Riveting Machine Market is moderately fragmented with a mix of global and regional players competing on product innovation, precision engineering, and automation capabilities. Leading companies such as Baltec, Orbitform, AGME, and Chicago Rivet & Machine Co. focus on delivering high-performance solutions tailored to automotive, aerospace, and general manufacturing needs. It sees growing competition from Asian manufacturers offering cost-effective machines with improved features. Players are investing in CNC and servo-controlled technologies to meet demand for accuracy and energy efficiency. Strategic partnerships, technological upgrades, and customer-specific customization remain key growth strategies. Companies are expanding their global footprint through distribution networks and service support. The market favors firms that combine mechanical reliability with smart automation and compact system design. Continuous R&D and integration of Industry 4.0 tools provide competitive advantages in large-scale industrial applications.
Recent Developments
- In April 2025, Belotti SpA unveiled its ARC – Automatic Riveting Cell at JEC World 2025, targeting high-volume production in the aerospace and automotive sectors.
- In May 2025, Heron Intelligent Equipment formed a strategic partnership with Ito Group to expand metal‑joining equipment sales, including riveting machines, across regions like the U.S., India, and Japan .
- In May 2025, Electroimpact introduced its new all‑electric semi‑automatic riveting machine named “Flexriveter,” designed to handle both squeeze rivets and interference bolts with cost-effective operation.
- In February 2025, Spanish company Fator launched an innovative anti‑corrosion rivet and riveting tool for installing solar panels on trackers, offering faster assembly times
Market Concentration & Characteristics
The Riveting Machine Market is moderately concentrated, with a mix of established global players and regional manufacturers competing across price, technology, and customization. It is characterized by steady technological advancement, rising automation, and growing demand for application-specific solutions. Leading companies focus on CNC and servo-controlled machines to meet precision and efficiency requirements in high-performance industries. The market exhibits a strong presence in sectors such as automotive, aerospace, electronics, and industrial machinery. It is shaped by increasing demand for lightweight material compatibility and integration of Industry 4.0 technologies. Barriers to entry include high initial capital investment, technical expertise, and strong brand recognition held by key players. The market favors firms that can deliver reliability, digital integration, and after-sales support. Demand is shifting toward energy-efficient, user-friendly, and scalable systems. Manufacturers that offer modular configurations, real-time monitoring, and predictive maintenance tools are gaining a competitive edge in a landscape driven by performance and productivity.
Report Coverage
The research report offers an in-depth analysis based on Type, Application and Geography. It details leading market players, providing an overview of their business, product offerings, investments, revenue streams, and key applications. Additionally, the report includes insights into the competitive environment, SWOT analysis, current market trends, as well as the primary drivers and constraints. Furthermore, it discusses various factors that have driven market expansion in recent years. The report also explores market dynamics, regulatory scenarios, and technological advancements that are shaping the industry. It assesses the impact of external factors and global economic changes on market growth. Lastly, it provides strategic recommendations for new entrants and established companies to navigate the complexities of the market.
Future Outlook
- Demand for automated riveting systems will increase across automotive, aerospace, and heavy machinery industries.
- Manufacturers will adopt servo-controlled and CNC machines for greater precision and flexibility.
- Industry 4.0 integration will enhance machine performance through IoT connectivity and real-time monitoring.
- Adoption of lightweight materials in transportation sectors will drive innovation in multi-material joining solutions.
- Electric vehicle production will create new opportunities for high-strength, non-thermal fastening technologies.
- Companies will focus on energy-efficient and environmentally friendly machine designs to meet sustainability goals.
- Emerging markets in Asia Pacific, Latin America, and Africa will see rising demand for semi-automated solutions.
- Investment in R&D will grow to improve tooling versatility and reduce maintenance needs.
- Smart user interfaces and programmable features will become standard in modern riveting systems.
- Market competition will intensify with new entrants offering cost-effective and customized machinery.


