Market Overview:
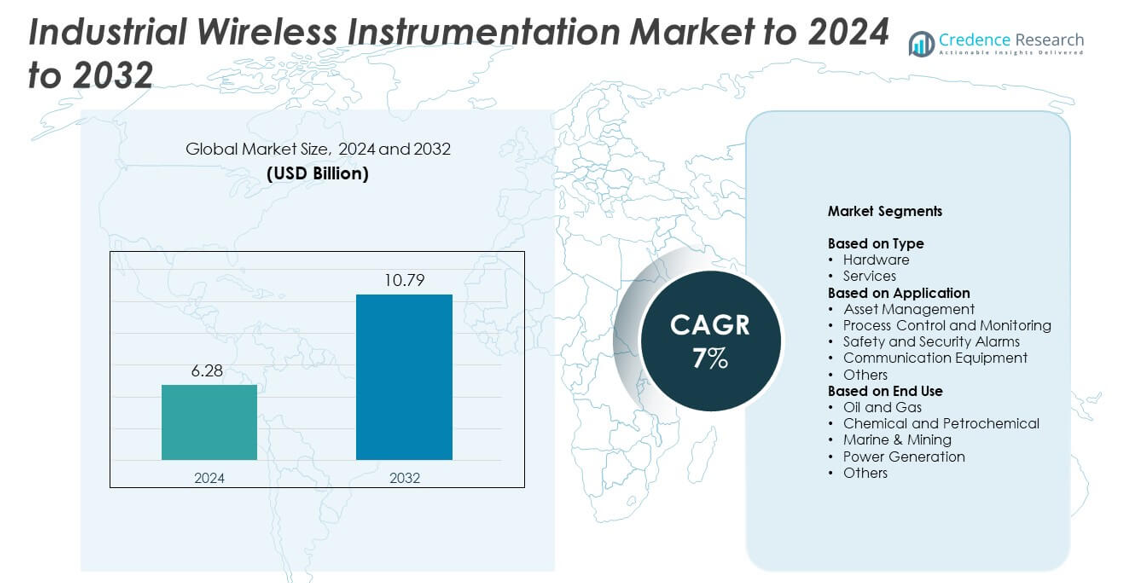
Industrial Wireless Instrumentation Market size was valued at USD 6.28 Billion in 2024 and is anticipated to reach USD 10.79 Billion by 2032, at a CAGR of 7% during the forecast period.
| REPORT ATTRIBUTE |
DETAILS |
| Historical Period |
2020-2023 |
| Base Year |
2024 |
| Forecast Period |
2025-2032 |
| Industrial Wireless Instrumentation Market Size 2024 |
USD 6.28 Billion |
| Industrial Wireless Instrumentation Market, CAGR |
7% |
| Industrial Wireless Instrumentation Market Size 2032 |
USD 10.79 Billion |
The Industrial Wireless Instrumentation Market includes major players such as NXP Semiconductors, Intel Corporation, Honeywell International Inc., ABB, Advantech Co., Ltd., Texas Instruments Incorporated, Cisco Systems, Inc., Sensirion AG, Huawei Technologies Co., Ltd., and Analog Devices, Inc. These companies compete through advanced wireless sensor networks, secure connectivity platforms, and integrated IIoT solutions that improve plant visibility and operational efficiency. North America led the global market in 2024 with about 38% share, supported by strong automation investment and early adoption of wireless technologies across oil and gas, chemicals, and power industries. Europe and Asia Pacific followed as key regional contributors with growing digital transformation efforts.
Market Insights
- The Industrial Wireless Instrumentation Market reached USD 6.28 Billion in 2024 and is projected to reach USD 10.79 Billion by 2032, growing at a CAGR of 7%.
- Strong demand for process control and monitoring systems, which held about 46% share in 2024, drives adoption as industries focus on real-time visibility and lower wiring costs.
- Advanced wireless standards and predictive maintenance tools shape market trends, supported by rising integration of IIoT devices across large industrial facilities.
- Competition strengthens as leading companies develop secure, energy-efficient wireless platforms and expand partnerships for scalable deployment across diverse industrial settings.
- North America led the market with around 38% share in 2024, followed by Europe at about 28% and Asia Pacific at roughly 24%, while hardware remained the top type segment with nearly 63% share.
Access crucial information at unmatched prices!
Request your sample report today & start making informed decisions powered by Credence Research Inc.!
Download Sample
Market Segmentation Analysis:
By Type
Hardware led the type segment in 2024 with about 63% share due to strong adoption of wireless transmitters, gateways, routers, and sensor nodes across industrial plants. Manufacturers relied on hardware to support real-time data capture, reduce cabling costs, and enable faster deployment in remote or hazardous zones. Growth in industrial IoT integration and modernization of legacy systems strengthened hardware demand. Services grew as industries increased spending on system integration, maintenance, and network optimization, but remained smaller because most investments centered on physical device installation.
- For instance, Emerson’s Rosemount 3051S transmitters with SmartPower modules offer up to 10-year maintenance-free power module life at a one-minute wireless update rate, supporting long-lived industrial wireless hardware deployments.
By Application
Process control and monitoring dominated the application segment in 2024 with nearly 46% share, supported by the need for continuous data flow from critical units like pumps, compressors, and reactors. Industries adopted wireless systems to improve response time, reduce downtime, and maintain stable production output. Asset management also expanded as plants adopted predictive maintenance tools. Safety and security alarms gained traction due to rising attention to workplace risks, while communication equipment and other niche uses advanced with broader digital transformation strategies.
- For instance, Honeywell’s OneWireless Field Device Access Point is specified to support update rates of under 10 seconds for process monitoring, enabling responsive control in hazardous plant areas, and is advertised as having short latency (less than 250 ms).
By End Use
Oil and gas held the largest end-use share in 2024 at about 38%, driven by heavy deployment of wireless sensors in upstream fields, midstream pipelines, and downstream facilities. Companies used wireless instrumentation to monitor pressure, flow, leaks, and equipment performance in remote and high-risk environments. Chemical and petrochemical plants also adopted wireless systems to support complex batch operations and regulatory compliance. Marine and mining operations advanced adoption due to harsh terrain needs, while power generation and other industries grew with rising focus on reliability, automation, and energy efficiency.
Key Growth Drvers
Rising Industrial IoT Adoption
Industrial IoT expansion boosted wireless instrumentation demand as factories connected more devices to improve visibility and efficiency. Wireless systems supported real-time monitoring, reduced wiring complexity, and lowered installation costs across large plants. Companies used advanced sensors to enhance process accuracy while scaling digital operations. Growing focus on data-driven maintenance and automated decision-making pushed industries to replace legacy wired networks with flexible wireless setups.
- For instance, Siemens, as a leading automation provider, has an installed base of over 30 million automated systems and over 75 million contracted smart meters globally.
Increased Need for Remote Operations
Remote plant management became a major growth driver as industries focused on safety and cost control. Wireless instrumentation helped operators track equipment performance, detect faults, and control critical assets from centralized locations. Oil, gas, mining, and marine sectors benefited from reduced on-site staffing and improved worker safety in hazardous zones. This shift aligned with rising adoption of remote diagnostics and centralized control rooms across global industrial sites.
- For instance, Aker BP’s Yggdrasil development in the North Sea is designed to be operated remotely from Stavanger, managing more than 700 million barrels of recoverable resources through unmanned production platforms and digitalized processes starting from 2027.
Growing Demand for Predictive Maintenance
Predictive maintenance accelerated market growth by enabling early detection of component wear and system anomalies. Wireless sensors delivered continuous data from rotating machinery, pipelines, and reactors, helping prevent unplanned shutdowns. Industries increased investment in analytics-linked sensor networks to extend asset life and optimize maintenance schedules. This driver gained momentum as companies sought to reduce operational losses and enhance production continuity in competitive environments.
Key Trends and Opportunities
Expansion of Advanced Wireless Technologies
Industries adopted high-performance wireless platforms such as Wi-Fi 6, private LTE, and LPWAN to support wider coverage and higher device density. These technologies improved network reliability, enhanced data throughput, and enabled mass sensor deployment across complex facilities. The trend created strong opportunities for vendors offering low-power devices and robust network architectures. Growth in automation and digital ecosystems supported long-term adoption.
- For instance, Cisco’s Catalyst IW9167 heavy-duty industrial access point supports Wi-Fi 6 and 6E with PHY data rates up to 7.8 gigabits per second across tri-radio operation in the 2.4, 5, and 6 gigahertz bands.
Rising Focus on Cybersecure Industrial Networks
Companies strengthened cybersecurity around wireless instrumentation to protect critical data and operational processes. Vendors introduced encrypted communication, identity management, and intrusion-detection features tailored for industrial settings. This trend created opportunities for secure wireless platforms aligned with evolving industrial standards. Growing concerns over operational disruptions and cyberattacks made security-focused solutions a priority across energy, chemicals, and manufacturing sectors.
- For instance, Palo Alto Networks’ PA-5250 next-generation firewall is specified with firewall throughput of 35.9 gigabits per second and a maximum of 8,000,000 concurrent sessions, securing high-volume traffic flows in mission-critical networks.
Integration of AI and Edge Analytics
Industries explored AI-enabled wireless systems that process data closer to equipment for faster decision-making. Edge analytics helped reduce cloud dependency and improved response time in safety-sensitive processes. This trend opened opportunities for smart sensors with embedded processing and adaptive learning. Companies viewed AI-driven wireless networks as a way to enhance productivity, forecasting accuracy, and automation maturity.
Key Challenges
Interference and Reliability Issues in Harsh Environments
Industrial sites often faced radio interference caused by heavy machinery, metal structures, and high-temperature zones. These conditions affected signal strength, reduced network reliability, and required specialized engineering to maintain performance. Ensuring stable connectivity across large or complex layouts became a major challenge for operators. Industries invested more in advanced protocols and ruggedized devices, but reliability concerns still slowed adoption in certain applications.
Cybersecurity Risks Across Wireless Networks
Wireless connections increased exposure to unauthorized access, data breaches, and system disruption. Industrial operators struggled to maintain secure communication channels across multiple sites, legacy systems, and third-party devices. Implementing strong encryption and authentication required additional investment and expertise. The challenge intensified as cyber threats grew more sophisticated, making security a critical barrier for wider deployment of connected wireless instrumentation.
Regional Analysis
North America
North America held about 38% share in 2024 due to strong industrial automation, high IIoT deployment, and early adoption of advanced wireless standards across oil and gas, chemicals, and power sectors. Plants upgraded legacy systems to support real-time data flow and remote operations. The region benefited from strong vendor presence, rising investments in digital transformation, and strict safety requirements driving wireless sensor use. Expanding shale operations and modernization of refineries also strengthened demand. Growing focus on predictive maintenance and secure wireless networks supported steady growth across major industrial hubs.
Europe
Europe accounted for nearly 28% share in 2024, driven by strong adoption of wireless instrumentation in chemicals, power generation, and manufacturing. The region advanced Industry 4.0 programs, encouraging plants to deploy scalable wireless networks and smart sensors. Strict regulatory frameworks supported upgrades to safer and more efficient monitoring systems. Growth in renewable energy facilities and expansion of advanced process industries increased demand for continuous data insight. Investments in energy-efficient production and cybersecurity-enhanced wireless solutions allowed Europe to maintain steady momentum across established industrial markets.
Asia Pacific
Asia Pacific held about 24% share in 2024, supported by rapid industrial expansion, strong manufacturing output, and rising modernization across oil and gas, chemicals, and power utilities. Regional companies increased adoption of wireless systems to reduce wiring cost and enhance operational flexibility in large plants. Government-led digitalization programs encouraged smart factory development and IoT deployment. High investment in refining, petrochemical, and mining projects strengthened demand for reliable monitoring networks. The region’s fast-growing industrial base and rising focus on remote operations positioned Asia Pacific as the strongest future growth hub.
Latin America
Latin America captured around 6% share in 2024, influenced by growing wireless adoption in oil and gas, mining, and power generation. Countries with large resource sectors used wireless instrumentation to improve safety and reduce downtime in remote facilities. Economic reforms and gradual modernization of industrial plants supported new installations. Adoption grew as companies sought cost-effective monitoring solutions and reduced dependence on wired infrastructure. Slow-paced digital transformation limited growth in some markets, but ongoing investment in energy and mining projects continued to support steady regional demand.
Middle East and Africa
Middle East and Africa held nearly 4% share in 2024, supported by wireless deployment across upstream oil fields, refineries, and power facilities. Companies used wireless systems to monitor critical equipment in harsh climates and remote desert locations. Large-scale energy projects and refinery expansions boosted demand for low-maintenance, real-time monitoring devices. Mining operations in Africa also adopted wireless solutions to strengthen asset visibility. Despite budget constraints in several countries, ongoing investment in energy infrastructure and rising interest in remote operations supported gradual adoption across the region.
Market Segmentations:
By Type
By Application
- Asset Management
- Process Control and Monitoring
- Safety and Security Alarms
- Communication Equipment
- Others
By End Use
- Oil and Gas
- Chemical and Petrochemical
- Marine & Mining
- Power Generation
- Others
By Geography
- North America
- Europe
- Germany
- France
- U.K.
- Italy
- Spain
- Rest of Europe
- Asia Pacific
- China
- Japan
- India
- South Korea
- South-east Asia
- Rest of Asia Pacific
- Latin America
- Brazil
- Argentina
- Rest of Latin America
- Middle East & Africa
- GCC Countries
- South Africa
- Rest of the Middle East and Africa
Competitive Landscape
The Industrial Wireless Instrumentation Market is shaped by major players such as NXP Semiconductors, Intel Corporation, Honeywell International Inc., ABB, Advantech Co., Ltd., Texas Instruments Incorporated, Cisco Systems, Inc., Sensirion AG, Huawei Technologies Co., Ltd., and Analog Devices, Inc. The competitive landscape reflects strong focus on advanced wireless platforms, rugged sensor technology, and secure communication systems tailored for industrial environments. Companies invest in enhanced connectivity solutions that support large-scale IIoT deployment, low-power device performance, and integration with predictive analytics tools. Vendors strengthen partnerships with automation firms and industrial operators to expand system interoperability. Rising demand for remote operations, network reliability, and improved data accuracy drives continuous product upgrades. Competitors also focus on cybersecurity enhancements and scalable architectures that fit diverse plant layouts. With industries moving toward digital transformation and smart manufacturing, competition intensifies around innovation, energy efficiency, and long-term service capabilities.
Shape Your Report to Specific Countries or Regions & Enjoy 30% Off!
Key Player Analysis
Recent Developments
- In 2025, Advantech showcased AMAX IoT control platforms at SPS 2025, integrating PLC, HMI, and IoT for enhanced wireless ecosystems in manufacturing.
- In 2024, Honeywell Launched a new Wireless Sensing Solution for process industries to improve real-time monitoring and predictive maintenance.
- In 2024, NXP Semiconductors announced the expansion of its Edge portfolio by introducing the new Advanced Connected MCX W Wireless MCU series
Report Coverage
The research report offers an in-depth analysis based on Type, Application, End-Use and Geography. It details leading market players, providing an overview of their business, product offerings, investments, revenue streams, and key applications. Additionally, the report includes insights into the competitive environment, SWOT analysis, current market trends, as well as the primary drivers and constraints. Furthermore, it discusses various factors that have driven market expansion in recent years. The report also explores market dynamics, regulatory scenarios, and technological advancements that are shaping the industry. It assesses the impact of external factors and global economic changes on market growth. Lastly, it provides strategic recommendations for new entrants and established companies to navigate the complexities of the market.
Future Outlook
- The market will expand as industries increase adoption of IIoT and digital tools.
- Wireless sensor networks will grow with higher demand for real-time plant visibility.
- Advanced wireless standards will support wider device connectivity and stable performance.
- Predictive maintenance will strengthen adoption across aging industrial facilities.
- Remote operations will rise as plants reduce on-site workforce in hazardous areas.
- Cybersecure wireless platforms will gain priority due to rising digital threats.
- Edge analytics and AI-enabled devices will improve decision-making at equipment level.
- Energy, chemicals, and manufacturing sectors will lead long-term deployment.
- Smart factories will drive strong investment in integrated wireless systems.
- Expansion of large industrial projects in Asia Pacific will accelerate global growth.


