
Market Overview
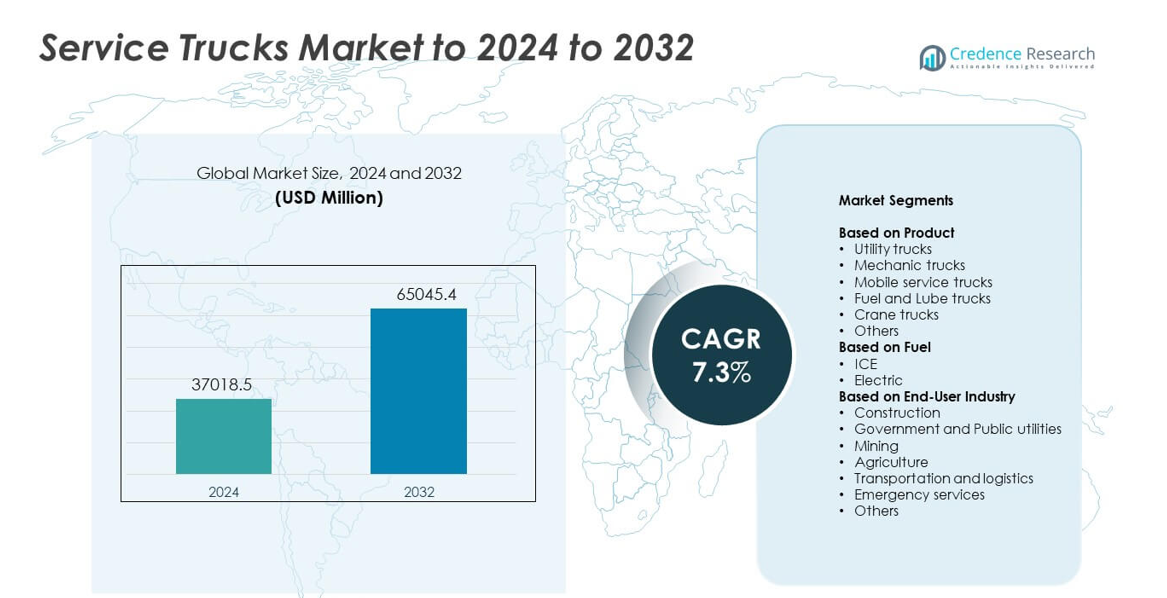
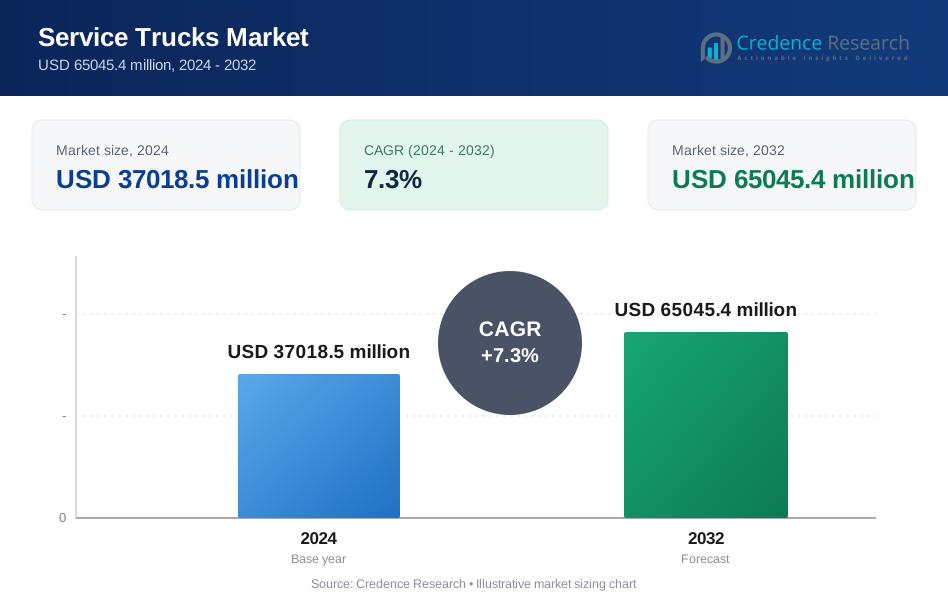
Service Trucks Market size was valued USD 37018.5 million in 2024 and is anticipated to reach USD 65045.4 million by 2032, at a CAGR of 7.3% during the forecast period.
| REPORT ATTRIBUTE | DETAILS |
|---|---|
| Historical Period | 2020-2023 |
| Base Year | 2024 |
| Forecast Period | 2025-2032 |
| Service Trucks Market Size 2024 | USD 37018.5 million |
| Service Trucks Market, CAGR | 7.3% |
| Service Trucks Market Size 2032 | USD 65045.4 million |
The Service Trucks Market includes major players such as Mercedes-Benz, Reading Truck, Scania AB, Dongfeng Motor Corporation, General Motors Company, Volvo Trucks, Mack Trucks, Ford Motor Company, Oshkosh Corporation, Isuzu Motors Limited, and Altec Industries Inc. These companies strengthen their presence through advanced chassis platforms, improved service bodies, and greater integration of telematics and fleet management tools. Demand continues to rise across construction, mining, utilities, and logistics. North America led the market in 2024 with about 36% share, supported by strong infrastructure activity, high fleet replacement rates, and rapid adoption of customized utility and mechanic trucks suited for field operations.
Market Insights
- Service Trucks Market reached USD 37018.5 million in 2024 and is projected to hit USD 65045.4 million by 2032 at a CAGR of 7.3%. • Growing construction and utility activities drive strong demand as utility trucks held the dominant 31% share due to broad field maintenance use. • Electric service trucks and telematics-enabled fleets emerge as key trends as operators shift toward cleaner and smarter maintenance solutions. • Leading players enhance chassis strength, service bodies, and fleet management tools to stay competitive, while high initial investment remains a major restraint for small operators. • North America led with 36% share in 2024, followed by Asia Pacific at 29% and Europe at 27%, while construction remained the top end-user segment with about 34% share.
Market Segmentation Analysis:
By Product
Utility trucks led the Service Trucks Market in 2024 with about 31% share. Strong demand came from construction, utilities, and fleet maintenance due to their flexible setups and wide tool-carrying capacity. These trucks support daily operations across many field tasks, which boosts their use across large projects. Mechanic trucks and mobile service trucks also saw solid demand as more firms adopt field-based repair models to cut downtime. Fuel and lube trucks grew with rising off-road equipment fleets, while crane trucks gained traction in heavy lifting and remote job sites.
- For instance, Manitowoc’s National Crane NBT40-2 boom truck is rated to lift 36.3 metric tons (40 US tons) at a 1.83-meter radius and offers a five-section boom up to 43.3 meters in length, supporting heavy service work on construction and utility sites.
By Fuel
ICE-powered service trucks dominated the market in 2024 with about 89% share. High torque output, long driving range, and wide refueling availability supported their use in mining, construction, and logistics. Many fleets retain diesel platforms because they handle heavy payloads and long-duty cycles. Electric service trucks grew fast in urban zones due to cleaner operation and lower running costs. Growth improved as more charging stations and OEM electric platforms entered the market, but adoption stayed limited in heavy off-road work.
- For instance, Ford’s 6.7-liter High-Output Power Stroke V8 turbo-diesel engine in the 2024 Super Duty line delivers 500 horsepower and 1,200 pound-feet of torque, giving service fleets the pulling power needed for fully equipped trucks and trailers.
By End-User Industry
Construction remained the top end-user in 2024 with nearly 34% share. Demand stayed high due to heavy on-site equipment use and constant repair needs across highways, bridges, and commercial sites. These trucks cut downtime and support 24/7 project schedules, which keeps adoption strong. Government and public utilities expanded due to growing investment in power grids and water systems. Mining, agriculture, and transportation sectors relied on service trucks for remote maintenance, while emergency services increased use for rescue, recovery, and field support operations.
Key Growth Drivers
Rising Construction and Infrastructure Projects
Global construction activity continues to expand due to large-scale road, rail, and commercial development. This growth increases the need for field maintenance fleets that support heavy machinery and daily operations. Service trucks offer on-site repair, tool storage, and equipment handling, which reduces downtime on active job sites. Many contractors invest in advanced utility and mechanic trucks to improve project speed and safety. This rising demand from ongoing infrastructure upgrades makes construction activity a major growth driver for the market.
- For instance, Bechtel states that it has completed more than 25,000 projects in 160 countries, including over 17,200 miles of roadway and 300 subway and rail projects, highlighting the scale of global infrastructure work that requires dedicated service truck fleets.
Expansion of Mining, Agriculture, and Off-Road Operations
Mining and agriculture rely on continuous equipment use in remote and rugged environments. Service trucks help maintain haul trucks, tractors, and drilling units far from service stations. The growth of metal mining, large farms, and energy extraction increases the need for mobile repair vehicles with fuel, lubrication, and lifting tools. These industries value service trucks because they support long duty cycles and reduce costly outages. Off-road sector expansion therefore stands as a leading driver for market growth.
- For instance, Komatsu confirms that commercial deployments of its FrontRunner Autonomous Haulage System have surpassed 700 trucks as of February 2024, including more than 100 980E-AT units capable of carrying 400 tons each, reflecting the intensity of large, remote mining operations.
Shift Toward Fleet Efficiency and Reduced Downtime
Companies across logistics, utilities, and construction focus on improving fleet uptime. Service trucks support preventive maintenance and emergency repairs, which lowers operating costs. The adoption of telematics, remote diagnostics, and better load-handling systems further enhances efficiency. Firms prefer custom-built service bodies that fit specific tools and equipment, improving task accuracy in the field. The wider push for operational efficiency across industries makes fleet uptime optimization a key driver for the market.
Key Trends & Opportunities
Growing Adoption of Electric and Hybrid Service Trucks
Many fleet operators explore electric and hybrid service trucks to meet emission rules and reduce fuel costs. Urban projects, utility firms, and government fleets drive this shift as clean-energy mandates tighten. Advances in battery range, fast charging, and lightweight bodies make electric units more practical. OEMs expand offerings for light and medium-duty applications, opening a strong opportunity for greener service fleets. This transition to low-emission trucks remains a major trend in the market.
- For instance, BYD reported that in 2023 it sold over 3 million new energy vehicles worldwide, underscoring how battery-electric and plug-in platforms are scaling into mainstream fleets for commercial and service roles.
Integration of Telematics and Smart Fleet Technologies
Digital tools such as telematics, predictive diagnostics, and fleet management software are becoming common. These systems help operators track vehicle health, schedule maintenance, and monitor tool usage. Smart control systems also support real-time field decisions and improve safety. Growth in IoT-enabled service bodies and crane systems expands opportunities for advanced truck platforms. This technology-driven shift strengthens productivity and creates a major trend shaping the market.
- For instance, Trimble noted in 2023 that its connected location ecosystem includes about 4.9 million geofenced locations in its database, giving fleets detailed telematics data for routing, dwell time, and site-specific performance analysis.
Key Challenges
High Initial Investment and Customization Costs
Service trucks require specialized components such as cranes, compressors, tool storage, power units, and reinforced truck bodies. These features increase upfront costs, especially for small contractors and independent operators. Custom builds further raise expenses and slow delivery timelines. Many firms delay upgrades due to budget limits, which reduces fleet renewal rates. High capital requirements therefore form a major challenge for broader market expansion.
Limited Electric Adoption in Heavy-Duty Segments
Although electric trucks are growing, adoption remains slow in heavy-duty and off-road operations. These tasks demand long range, high payload capacity, and continuous power for tools and cranes. Current battery technology struggles to match diesel performance in remote sites with limited charging access. Higher purchase prices also discourage buyers in price-sensitive sectors. This gap between performance needs and electric capabilities stands as a key challenge for the market.
Regional Analysis
North America
North America held about 36% share of the Service Trucks Market in 2024, driven by strong construction, mining, and utility sector activity. The United States led demand as large fleets upgraded to advanced utility and mechanic trucks for field maintenance. Canada supported growth through investments in energy extraction and public infrastructure programs. High adoption of telematics and custom truck bodies also improved operational efficiency for regional operators. Continuous fleet replacement cycles, large service networks, and rising infrastructure spending kept North America the leading regional market.
Europe
Europe accounted for nearly 27% share in 2024, supported by strong demand from construction, municipal services, and public utilities. Countries such as Germany, the United Kingdom, and France invested in advanced service fleets as part of broader infrastructure and urban renewal programs. Adoption of electric service trucks increased due to strict emission targets and fleet sustainability goals. The region also saw growing use of mobile service units in transport and logistics operations. Steady regulatory pressure and modernization initiatives helped maintain strong market performance across Europe.
Asia Pacific
Asia Pacific captured about 29% share in 2024, driven by rapid industrialization, urban expansion, and strong construction activity across China, India, and Southeast Asia. Mining operations in Australia and Indonesia further supported demand for heavy-duty service trucks. Growing manufacturing output and expansion of logistics networks also increased fleet maintenance needs. Government investments in highways, smart cities, and energy projects raised the use of specialized service bodies. Rising adoption of mobile repair units and fleet upgrades positioned Asia Pacific as one of the fastest-growing regional markets.
Latin America
Latin America held nearly 5% share in 2024, with growth led by construction, agriculture, and mining activities across Brazil, Mexico, and Chile. Service trucks gained traction as companies sought to reduce field downtime and improve equipment reliability in remote operations. Expanding road development and infrastructure upgrades further supported adoption. However, economic fluctuations and higher import costs limited widespread fleet modernization. Despite these constraints, rising investment in energy and mining projects kept demand steady and created opportunities for long-term regional expansion.
Middle East and Africa
Middle East and Africa accounted for about 3% share in 2024, supported by strong construction and infrastructure development across the Gulf states. Mining operations in South Africa and rising oil and gas field maintenance needs in Saudi Arabia and the UAE boosted demand. Service trucks helped improve efficiency in remote desert and industrial environments. Adoption remained moderate due to budget constraints in several African nations, but ongoing mega-projects and logistics expansion supported market growth. Regional investments in utilities and industrial projects continued to create new opportunities.
Market Segmentations:
By Product
- Utility trucks
- Mechanic trucks
- Mobile service trucks
- Fuel and Lube trucks
- Crane trucks
- Others
By Fuel
- ICE
- Electric
By End-User Industry
- Construction
- Government and Public utilities
- Mining
- Agriculture
- Transportation and logistics
- Emergency services
- Others
By Geography
- North America
- U.S.
- Canada
- Mexico
- Europe
- Germany
- France
- U.K.
- Italy
- Spain
- Rest of Europe
- Asia Pacific
- China
- Japan
- India
- South Korea
- South-east Asia
- Rest of Asia Pacific
- Latin America
- Brazil
- Argentina
- Rest of Latin America
- Middle East & Africa
- GCC Countries
- South Africa
- Rest of the Middle East and Africa
Competitive Landscape
The Service Trucks Market features key players such as Mercedes-Benz, Reading Truck, Scania AB, Dongfeng Motor Corporation, General Motors Company, Volvo Trucks, Mack Trucks, Ford Motor Company, Oshkosh Corporation, Isuzu Motors Limited, and Altec Industries Inc. Competition remains strong as manufacturers focus on enhancing payload capacity, improving chassis strength, and integrating advanced service bodies for field operations. Many companies invest in telematics, remote diagnostics, and safety systems to support fleet efficiency and reduce downtime. Customization capabilities also play a central role, with clients demanding tailored tool storage, cranes, compressors, and power systems. Growing interest in electric and hybrid service platforms encourages innovation in lightweight materials and energy-efficient designs. Global expansion strategies include partnerships with distributors, regional production enhancements, and aftersales service improvements. As infrastructure, mining, utilities, and logistics sectors grow, vendors strengthen product portfolios to meet rising demand for versatile and durable service trucks.
Key Player Analysis
- Mercedes-Benz
- Reading Truck
- Scania AB
- Dongfeng Motor Corporation
- General Motors Company
- Volvo Trucks
- Mack Trucks
- Ford Motor Company
- Oshkosh Corporation
- Isuzu Motors Limited
- Altec Industries Inc.
Recent Developments
- In 2025, Reading Truck expanded its crane body line-up with the introduction of two new models, the RM-25 and RM-35 Crane Bodies, offering enhanced lifting capabilities for mid-weight class chassis.
- In 2024, GM announced 2025 Silverado EV updates with expanded LT trim and enhanced towing for fleet service applications.
- In 2023, Mack Trucks introduced its second battery-electric vehicle, the MD Electric, a service truck available in Class 6 and Class 7 ratings designed for a range of up to 230 miles
Report Coverage
The research report offers an in-depth analysis based on Product, Fuel, End-Use Industry and Geography. It details leading market players, providing an overview of their business, product offerings, investments, revenue streams, and key applications. Additionally, the report includes insights into the competitive environment, SWOT analysis, current market trends, as well as the primary drivers and constraints. Furthermore, it discusses various factors that have driven market expansion in recent years. The report also explores market dynamics, regulatory scenarios, and technological advancements that are shaping the industry. It assesses the impact of external factors and global economic changes on market growth. Lastly, it provides strategic recommendations for new entrants and established companies to navigate the complexities of the market.
Future Outlook
- The market will grow as construction and infrastructure projects expand worldwide.
- Demand will rise for advanced utility and mechanic trucks with higher payload capability.
- Electric and hybrid service trucks will gain share in urban and municipal fleets.
- Telematics and smart fleet tools will enhance uptime and improve field performance.
- Custom-built service bodies will see higher adoption across specialized industries.
- Mining and agriculture sectors will drive strong demand for heavy-duty service trucks.
- Fleet operators will focus on reducing downtime through predictive maintenance systems.
- OEMs will expand offerings with lighter materials and more efficient power systems.
- Governments will influence fleet upgrades through emission rules and safety standards.
- Long-term adoption will increase as service trucks become key assets for field operations.
Request a Free Sample
Fill in your details and we'll send you a free sample report.
- Sample data tables & charts
- Research methodology
Need a Custom Version of This Report?
Tailor the scope, geography, or segments to your exact requirements.
- Custom geography or segment scope
- Direct access to our analyst team
Frequently Asked Questions
What is the current market size for Service Trucks Market, and what is its projected size in 2032?
At what Compound Annual Growth Rate is the Service Trucks Market projected to grow between 2024 and 2032?
Which Service Trucks Market segment held the largest share in 2024?
What are the primary factors fueling the growth of the Service Trucks Market?
Who are the leading companies in the Service Trucks Market?
Table of Content
Chapter 1. Report Introduction
- 1.1 Report Description & Purpose
- 1.1.1 Report Title & Market Definition
- 1.1.2 Unique Selling Propositions (USP) & Key Differentiators
- 1.1.3 Value Proposition for Stakeholders
- 1.2 Research Objectives
- 1.2.1 Market Sizing Objectives (Volume & Revenue)
- 1.2.2 Segmentation Objectives
- 1.2.3 Competitive Intelligence Objectives
- 1.2.4 Forecast & Scenario Objectives
- 1.3 Report Scope
- 1.3.1 Service Trucks Scope – Types & Subtypes Covered
- 1.3.2 Geographic Scope – Regions & Countries Covered
- 1.3.3 Historical Period, Base Year & Forecast Period (2024; forecast to 2032)
- 1.3.4 Inclusions & Exclusions
- 1.4 HS Code & Classification Framework
- 1.5 Currency, Units & Pricing Basis
- 1.6 Target Stakeholders
- 1.7 Limitations & Assumptions
Chapter 2. Executive Summary
- 2.1 Global Service Trucks Market Snapshot
- 2.1.1 Market Size – Historical (2024) & Forecast (2024-2032) (2024: USD 37018.5 million → 2032: USD 65045.4 million)
- 2.1.2 Volume & Revenue – Global Totals
- 2.1.3 Key Market Highlights – Top Five Facts
- 2.2 Service Trucks Market Segmentation Snapshot
- 2.2.1 Market Split by Region – 2024 vs. 2032
- 2.3 Competitive Snapshot
- 2.3.1 Top 10 Players by Revenue Share – 2024
- 2.3.2 Top 10 Players by Volume Share – 2024
- 2.3.3 Recent Strategic Developments (18-Month Summary)
- 2.4 Key Investment Highlights & Strategic Conclusions
Chapter 3. Service Trucks Market Dynamics & Industry Analysis
- 3.1 Market Overview & Context
- 3.1.1 Service Trucks Market Position in the Broader Automotive Value Chain
- 3.1.2 OEM vs. Replacement Market Dynamics
- 3.1.3 Market Maturity & Development Stage by Region
- 3.2 Service Trucks Market Drivers
- 3.3 Service Trucks Market Restraints & Challenges
- 3.4 Service Trucks Market Opportunities
- 3.5 Porter's Five Forces Analysis
- 3.5.1 Threat of New Entrants
- 3.5.2 Bargaining Power of Suppliers
- 3.5.3 Bargaining Power of Buyers
- 3.5.4 Threat of Substitutes
- 3.5.5 Competitive Rivalry – Intensity Assessment
- 3.6 Service Trucks Value Chain Analysis
- 3.6.1 Upstream – Raw Material/Input Suppliers
- 3.6.1.1 Raw Material/Input 1
- 3.6.1.2 Raw Material/Input 2
- 3.6.1.3 Raw Material/Input 3
- 3.6.2 Midstream – Production/Manufacturing/Service Delivery
- 3.6.2.1 Production/Process Overview
- 3.6.2.2 Key Facility Locations & Capacity by Manufacturer
- 3.6.3 Downstream – Distribution & End Consumer
- 3.6.3.1 Primary Channel – B2B/OEM
- 3.6.3.2 Secondary Channels – Dealer, Retail, Online, Direct
- 3.6.4 Value Chain Profitability Analysis
- 3.6.1 Upstream – Raw Material/Input Suppliers
- 3.7 PESTEL Analysis
- 3.7.1 Political Factors
- 3.7.2 Economic Factors
- 3.7.3 Social Factors
- 3.7.4 Technological Factors
- 3.7.5 Environmental Factors
- 3.7.6 Legal Factors
- 3.8 Service Trucks Supply Chain Analysis
- 3.8.1 Raw Material/Input Supply Risk Assessment
- 3.8.2 Manufacturing Concentration Risk (Geographic Exposure)
- 3.8.3 Trade Disruption Impact Analysis
- 3.9 Regulatory & Policy Landscape
Note: The regulatory and policy landscape section covers regulations based on their applicability to the market, Service Trucks category, geography, and scope of the study. Only regulatory frameworks with a material impact on operations, compliance, trade, sustainability, or market access are analyzed in detail.
Chapter 4. Key Investment Pockets & Opportunity Analysis
- 4.1 Service Trucks Market Attractiveness Analysis
- 4.1.1 By Region – Investment Attractiveness Matrix (Volume × CAGR)
- 4.2 Absolute Revenue Growth Opportunity
- 4.2.1 By Region – Absolute USD Growth Through 2032
- 4.3 Incremental Volume Opportunity
- 4.3.1 By Region – Incremental Volume Through 2032
- 4.3.2 Segment – Incremental Volume
- 4.4 Emerging Submarket Opportunity Deep Dive (Subject to Applicability)
- 4.5 Emerging Market Opportunity Scorecards
- 4.5.1 United States
- 4.5.2 Europe
- 4.5.3 Asia
- 4.5.4 Middle East & Africa
Note: Emerging Market Opportunity Scorecards will be included based on relevance and strategic importance. Regions listed are indicative and may vary depending on data availability and market dynamics.
Chapter 5. Service Trucks Import-Export Analysis & Trade Flows
- 5.1 Global Trade Overview
- 5.1.1 Global Export Value by Country (2024)
- 5.1.2 Global Export Volume by Country (2024)
- 5.1.3 Global Import Value by Country (2024)
- 5.1.4 Global Import Volume by Country (2024)
- 5.1.5 Net Trade Balance by Country (2024)
- 5.2 Export Analysis – Segment
- 5.2.1 Type 1 (HS Code)
- 5.2.2 Type 2 (HS Code)
- 5.2.3 Type 3 (HS Code)
- 5.2.4 Type 4 (HS Code)
- 5.2.5 Type 5 (HS Code)
- 5.3 Import Analysis – Segment
- 5.3.1 Type 1 (HS Code)
- 5.3.2 Type 2 (HS Code)
- 5.3.3 Type 3 (HS Code)
- 5.3.4 Type 4 (HS Code)
- 5.3.5 Type 5 (HS Code)
- 5.4 Average Unit Trade Prices
- 5.4.1 Average Export Price – Segment & Country
- 5.4.2 Average Import Price – Segment & Source Country
- 5.4.3 Price Trends (2024)
- 5.5 Key Trade Route Analysis
- 5.5.1 Trade Route 1
- 5.5.2 Trade Route 2
- 5.5.3 Trade Route 3
- 5.5.4 Trade Route 4
- 5.5.5 Trade Route 5
- 5.6 Trade Policy Impact Assessment
- 5.6.1 US Anti-Dumping & Section 301 Tariffs
- 5.6.2 EU Customs Union Impact
- 5.6.3 Major Free Trade Agreements
- 5.6.4 USMCA Rules of Origin
Note: Trade policy analysis will be included only where relevant to the Service Trucks market.
Chapter 6. Competitive Landscape & Company Benchmarking
- 6.1 Service Trucks Market Concentration & Structure
- 6.1.1 Herfindahl-Hirschman Index (HHI) – vs. 2024
- 6.1.2 Tier 1, Tier 2 & Tier 3 Market Structure
- 6.1.3 Global, Regional & Local Player Dynamics
- 6.2 Service Trucks Market Share Analysis – 2024
- 6.2.1 Global Revenue Share by Company
- 6.2.2 Global Volume Share by Company
- 6.2.3 Regional Revenue Share
- 6.2.4 Market Share Evolution ( vs. 2024)
- 6.2.5 OEM Segment Share by Company
- 6.2.6 Replacement Segment Share by Company
- 6.3 Production/Delivery Capacity & Facility Analysis
- 6.3.1 Global Installed Capacity
- 6.3.2 Capacity Utilization Rates
- 6.3.3 Production/Output Volume
- 6.3.4 Facility Locations & Capacity Map
- 6.3.5 Planned Capacity Additions
- 6.4 Service Trucks Competitive Benchmarking Matrix
- 6.4.1 Revenue, Volume, CAGR & Profitability Comparison
- 6.4.2 Channel Revenue Mix
- 6.4.3 Geographic Revenue Exposure
- 6.4.4 R&D Intensity
- 6.4.5 Sustainability Maturity
- 6.5 Strategic Developments in Service Trucks (Last 24 Months)
- 6.5.1 Mergers, Acquisitions & Divestments
- 6.5.2 New Service Trucks Launches
- 6.5.3 Facility Expansions
- 6.5.4 Strategic Alliances, Joint Ventures & Partnerships
- 6.5.5 Distribution Expansion & Market Entry
- 6.5.6 Sustainability & ESG Initiatives
- 6.6 Competitive Strategy Mapping
- 6.6.1 Leader, Challenger, Follower & Niche Classification
- 6.6.2 Pricing Strategy Comparison
- 6.6.3 Channel Strategy Matrix
Note: Strategic developments are included based on their materiality and the availability of reliable information.
Chapter 7. Global Service Trucks Market – By Distribution Channel
- 7.1 Segment Overview
- 7.1.1 Volume & Revenue Split by Channel (2024 & 2032)
- 7.1.2 Channel Mix Evolution (2024-2032)
Chapter 8. Regional Market Analysis – Global Overview
- 8.1 Global Regional Overview
- 8.1.1 Regional Volume Share
- 8.1.2 Regional Revenue Share
- 8.1.3 Regional Volume by Region
- 8.1.4 Regional Revenue by Region
- 8.1.5 Regional Forecast Through 2032
- 8.2 Cross-Regional Segment Analysis
- 8.2.1 By Distribution Channel
- 8.2.2 By Brand/Price Tier
Chapter 9. North America Service Trucks Market
- 9.1 United States
- 9.2 Canada
- 9.3 Mexico
Chapter 10. Europe Service Trucks Market
- 10.1 Germany
- 10.2 France
- 10.3 Italy
- 10.4 United Kingdom
- 10.5 Spain
- 10.6 Poland
- 10.7 Russia
- 10.8 Netherlands
- 10.9 Belgium
- 10.10 Sweden
- 10.11 Denmark
- 10.12 Norway
- 10.13 Rest of Europe
Chapter 11. Asia Pacific Service Trucks Market
- 11.1 China
- 11.2 India
- 11.3 Japan
- 11.4 South Korea
- 11.5 Thailand
- 11.6 Indonesia
- 11.7 Vietnam
- 11.8 Malaysia
- 11.9 Australia
- 11.10 Rest of Asia Pacific
Chapter 12. Latin America Service Trucks Market
- 12.1 Brazil
- 12.2 Argentina
- 12.3 Colombia
- 12.4 Chile
- 12.5 Rest of Latin America
Chapter 13. Middle East Service Trucks Market
- 13.1 Saudi Arabia
- 13.2 United Arab Emirates
- 13.3 Turkey
- 13.4 Israel
- 13.5 Iran
- 13.6 Rest of the Middle East
Chapter 14. Africa Service Trucks Market
- 14.1 South Africa
- 14.2 Egypt
- 14.3 Nigeria
- 14.4 Morocco
- 14.5 Rest of Africa
Chapter 15. Service Trucks Company Profiles
- 15.1 [Company 01]
- 15.1.1 Company Overview
- 15.1.2 Key Management Personnel
- 15.1.3 Products & Services Portfolio
- 15.1.4 Financial Performance
- 15.1.5 Key Market Focus & Geographic Presence
- 15.1.6 Recent Developments & Strategic Initiatives
Note: The company profile list is preliminary and may change based on research findings, market developments, data availability, and client requirements.
Chapter 16. Appendices
- Appendix A – List of Abbreviations & Acronyms
- Appendix B – Industry Classification Code Reference – Full Series
- Appendix C – Production & Capacity Data Tables
- Appendix D – End-Use & Demand Base Tables
- Appendix E – Consumption & Replacement Rate Assumptions
- Appendix F – ASP Reference Tables
- Appendix G – Manufacturing & Facility Database
- Appendix H – Import-Export Data Tables
- Appendix I – Regulatory Summary Tables
- Appendix J – Primary Research Participant List (Anonymized)
- Appendix K – Primary Research Questionnaire Framework
- Appendix L – Data Sources & Bibliography
- Appendix M – Market Size Divergence & Source Comparison
Chapter 17. Research Methodology
- 17.1 Research Framework & Philosophy
- 17.2 Secondary Research – Sources, Hierarchy & Data Extraction
- 17.3 Data Modeling – Bottom-Up & Top-Down Market Sizing
- 17.4 Primary Research – Stakeholder Framework, LOI & Sample Sizes
- 17.5 Forecast Methodology – Regression, Scenario & Sensitivity Analysis
- 17.6 Quality Control – Four-Layer Validation Framework
- 17.7 Limitations & Standard Assumptions
- 17.8 Disclaimer
