
Market Overview
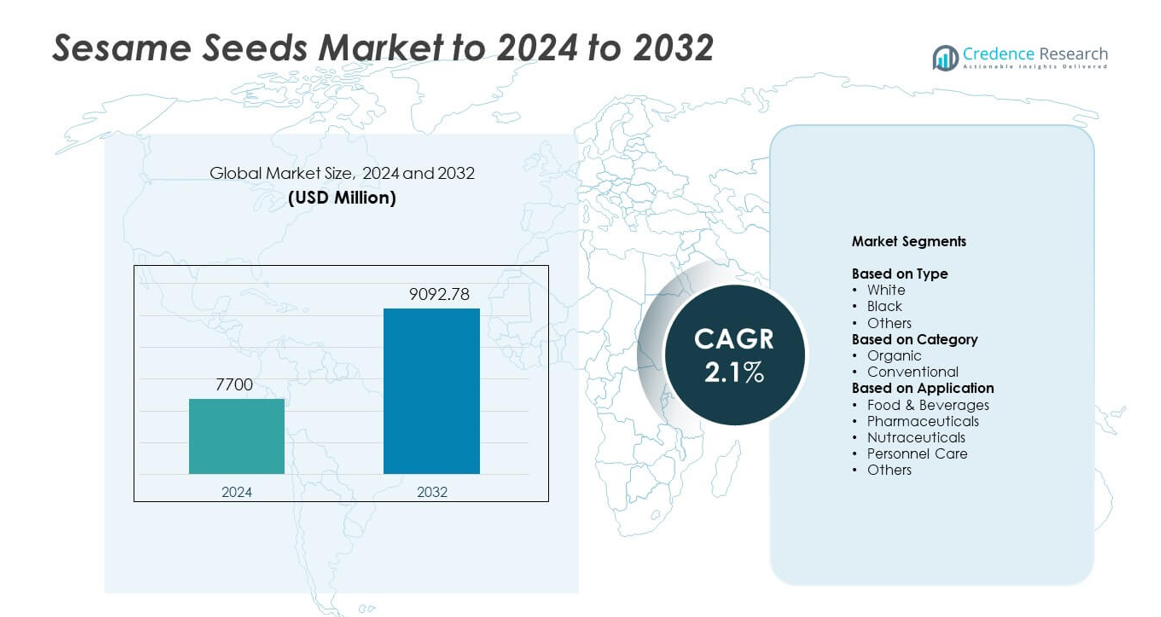
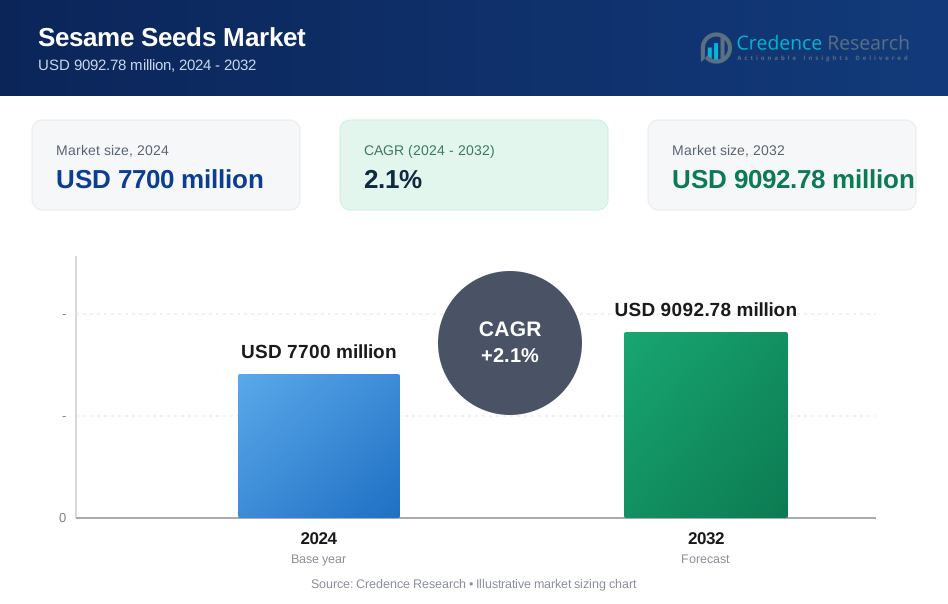
Sesame Seeds Market size was valued at USD 7700 million in 2024 and is anticipated to reach USD 9092.78 million by 2032, at a CAGR of 2.1% during the forecast period.
| REPORT ATTRIBUTE | DETAILS |
|---|---|
| Historical Period | 2020-2023 |
| Base Year | 2024 |
| Forecast Period | 2025-2032 |
| Sesame Seeds Market Size 2024 | USD 7700 million |
| Sesame Seeds Market, CAGR | 2.1% |
| Sesame Seeds Market Size 2032 | USD 9092.78 million |
The Sesame Seeds Market includes major players such as Shyam Industries, Triangle Wholefoods, Olam International, Dipasa USA, Inc., HL Agro Products, SHREEJI EXPELLER INDUSTRIES, Ami Enterprise, Fuerst Day Lawson, Kadoya Sesame Mills, ECOM Agroindustrial Corporation, Tradin Organic, and ETICO Group. These companies compete through large-scale sourcing, strict quality control, and expanding organic and traceable seed portfolios. Asia Pacific led the market in 2024 with about 42% share due to strong production and heavy use in food, oil, and export processing. Europe followed with nearly 24% share, driven by high demand from bakery, confectionery, and premium food categories.
Market Insights
- The Sesame Seeds Market reached USD 7700 million in 2024 and is projected to hit USD 9092.78 million by 2032, registering a CAGR of 2.1%.
- Market growth is driven by rising use in bakery, snacks, sesame oil processing, and health-focused products, with strong demand from food and beverage makers.
- Key trends include expanding organic seed adoption, higher use in nutraceuticals, and growing inclusion of sesame extracts in personal care products.
- Competitive activity remains strong as leading companies focus on traceability, premium-grade processing, and wider export networks to meet strict global standards.
- Asia Pacific dominated the market with 42% share in 2024, followed by Europe at 24%, while the food and beverages segment held the largest application share at 71%.
Market Segmentation Analysis:
By Type
White sesame seeds held the dominant position in 2024 with about 63% share. Strong demand came from bakery, confectionery, and packaged food makers that rely on white seeds for uniform taste and consistent texture. These seeds also support large export volumes due to wide use in tahini, toppings, and ready meals. Black sesame seeds grew at a steady pace due to rising interest in premium and traditional foods. Other types gained limited traction in regional cuisines but remained smaller due to low commercial processing demand.
- For instance, Kadoya Sesame Mills Inc. is a publicly listed company and its operational disclosures confirm an annual sesame seed processing capacity of over 48,000 tons.
By Category
Conventional sesame seeds led the market in 2024 with nearly 82% share. High adoption came from extensive farming acreage, lower production costs, and wide use in processed foods. Food manufacturers prefer conventional seeds because they offer stable supply and predictable pricing for bulk procurement. Organic sesame seeds expanded due to rising clean-label demand in snacks, health foods, and premium consumer products. Growth in sustainability-led sourcing and higher disposable income supported organic adoption, though the segment remained smaller due to higher certification and cultivation costs.
- For instance, Selit Hulling PLC is described as a certified organic hulled sesame exporter that worked with development partners on a plan targeting 20,000 tons per year of
- quality sesame.
By Application
Food and beverages accounted for the largest share in 2024 with about 71% share. Strong usage in bakery toppings, confectionery, tahini, sesame oil extraction, and packaged meals drove demand across global markets. The nutraceutical sector grew as brands used sesame for mineral-rich blends and antioxidant-focused products. Pharmaceuticals used sesame in traditional formulations, while personal care saw rising use in skin-nourishing oils and scrubs. Other applications expanded slowly due to limited industrial use, but steady demand remained through regional cuisines and household consumption
Key Growth Drivers
Rising Use in Packaged Foods
Demand increased as sesame seeds became more common in bakery products, snacks, sauces, and ready meals. Food brands value sesame for flavor, texture, and clean-label appeal, which supports steady adoption. Strong growth in tahini-based spreads and Asian cuisine also boosted global usage. Expansion in commercial baking and higher consumption of fortified products further strengthened demand across both developed and emerging markets.
- For instance, Olam’s Nigerian operations reported purchasing over 100,000 metric tons of sesame from about 150,000 farmers in one year for processing and export, feeding into snack, oil, and packaged food chains.
Expansion in Health and Nutraceutical Products
Sesame seeds gained traction due to rising interest in mineral-rich and antioxidant-focused foods. Nutraceutical makers use sesame in powders, bars, and functional blends targeting better digestion and heart wellness. Global consumers show stronger preference for natural additives, which supports higher inclusion in health products. Broader awareness of calcium and healthy fats also lifted demand across retail and supplement channels.
- For instance, Bioven Sesame Seed Extract Capsule is positioned as a nutraceutical and contains 450 mg of sesame seed extract per capsule, directly using standardized sesame actives in supplement formats.
Growth in Sesame Oil Processing
Rising sesame oil production increased seed consumption across Asia, the Middle East, and Africa. Oil processors prefer stable supply and high-yield seed varieties, which expanded large-scale sourcing. Growth in household cooking oils and rising exports of premium cold-pressed oils further supported demand. Wider acceptance of sesame oil in packaged foods kept processing segments strong.
Key Trends & Opportunities
Shift Toward Organic and Traceable Supply Chains
Buyers now prefer seeds with certified origins and transparent sourcing due to rising safety concerns. Organic cultivation creates strong growth opportunities as consumers choose chemical-free ingredients in snacks and home cooking. Export markets reward traceability, encouraging producers to adopt digital monitoring and quality testing. This trend supports premium pricing and expands opportunities in high-value food and nutraceutical channels.
- For instance, ETG Group handles more than 7 million metric tons of agricultural commodities annually around the world
Growing Demand from Personal Care Formulations
Cosmetic brands increased the use of sesame extracts and oils for moisturizers, hair products, and natural skin-care lines. The trend supports producers able to supply refined, high-purity seeds suited for cosmetic processing. Rising demand for plant-based ingredients helped sesame gain ground in clean-beauty products. Expanding personal care manufacturing across Asia and Europe created new growth avenues for suppliers.
- For instance, NOW Solutions markets a certified organic sesame seed oil body oil in a 237 ml pack as a natural moisturizer for skin and hair, integrating cosmetic-grade sesame oil into personal care product lines.
Key Challenges
Supply Instability and Weather Sensitivity
Sesame seed farming remains vulnerable to drought, floods, and inconsistent rainfall patterns. Major producing regions, including India and parts of Africa, face frequent yield swings, which disrupt global availability. Price volatility increases when weather issues tighten supply, creating challenges for food processors that need stable volumes. Limited irrigation and smallholder dominance add further instability in annual output.
Quality Variability Across Producing Regions
Differences in cleaning, sorting, and post-harvest handling lead to inconsistent seed grades. Importing countries often reject shipments that fail to meet purity or pesticide standards, which affects trade flows. Smaller producers struggle to invest in modern processing, causing gaps in color uniformity and moisture control. These quality issues limit access to premium markets and increase compliance costs for exporters.
Regional Analysis
North America
North America held about 18% share in 2024, supported by strong demand from bakery, snacks, and health-food producers. Growth came from rising use in clean-label products and higher imports for sesame oil processing. The region benefits from stable regulatory systems that promote quality sourcing and residue-free supply. Expanding vegan and natural food trends also supported steady consumption. The United States remained the main importer due to wide industrial use, while Canada showed rising demand in specialty and ethnic food categories, keeping overall growth stable.
Europe
Europe accounted for nearly 24% share in 2024, driven by high consumption in bakery, confectionery, and tahini-based foods. Strong import dependence keeps demand steady as food brands seek consistent grades for large-scale processing. Growth in organic and traceable seeds supported premium markets in Germany, the Netherlands, and the United Kingdom. Mediterranean countries also drove usage through traditional cuisines. Expanding clean-label rules and strict residue limits increased demand for high-quality sesame, reinforcing Europe’s position as a key consumer region.
Asia Pacific
Asia Pacific dominated the market in 2024 with about 42% share, driven by large production and strong domestic consumption in India, China, Japan, and South Korea. The region leads due to wide use in cooking oils, snacks, traditional foods, and export-oriented processing. India and China act as major producers, supporting both local needs and international shipments. Rising interest in sesame-based condiments and expanding packaged food markets strengthened demand. Increased investment in modern cleaning, hulling, and sorting facilities helped improve export competitiveness.
Middle East and Africa
Middle East and Africa held around 13% share in 2024, supported by strong production in Ethiopia, Sudan, Nigeria, and Tanzania. High export activity positions the region as one of the largest global suppliers. Demand within the Middle East grew through expanding use in tahini, halva, and premium sesame oils. Africa’s role remains vital due to extensive cultivation and rising contract farming. However, variability in yields and post-harvest practices created challenges, though ongoing investments aim to raise quality and supply stability.
South America
South America captured nearly 3% share in 2024, with Paraguay and Bolivia acting as key producers for export markets. The region benefits from suitable climate conditions and rising interest from global buyers seeking stable supply alternatives. Brazil showed expanding demand in bakery and snack segments, supporting modest growth. Improvements in seed cleaning and export quality processes helped regional suppliers access higher-value markets. Overall consumption stays limited, but export-driven production keeps South America a growing contributor to global trade.
Market Segmentations:
By Type
- White
- Black
- Others
By Category
- Organic
- Conventional
By Application
- Food & Beverages
- Pharmaceuticals
- Nutraceuticals
- Personnel Care
- Others
By Geography
- North America
- U.S.
- Canada
- Mexico
- Europe
- Germany
- France
- U.K.
- Italy
- Spain
- Rest of Europe
- Asia Pacific
- China
- Japan
- India
- South Korea
- South-east Asia
- Rest of Asia Pacific
- Latin America
- Brazil
- Argentina
- Rest of Latin America
- Middle East & Africa
- GCC Countries
- South Africa
- Rest of the Middle East and Africa
Competitive Landscape
The Sesame Seeds Market is shaped by key players such as Shyam Industries, Triangle Wholefoods, Olam International, Dipasa USA, Inc., HL Agro Products, SHREEJI EXPELLER INDUSTRIES, Ami Enterprise, Fuerst Day Lawson, Kadoya Sesame Mills, ECOM Agroindustrial Corporation, Tradin Organic, and ETICO Group. These companies strengthen their presence through large-scale sourcing, advanced cleaning and hulling facilities, and long-term supply partnerships across major producing regions. Many players invest in traceability systems and residue-controlled processing to meet strict global standards. Expansion into organic, specialty, and high-purity grades supports premium market demand. Firms also focus on logistics efficiency and diversified export networks to reduce supply risks. Growing interest in sustainable farming and contract-based cultivation further helps companies secure reliable volumes and stable quality.
Key Player Analysis
- Shyam Industries
- Triangle Wholefoods
- Olam International
- Dipasa USA, Inc.
- HL Agro Products
- SHREEJI EXPELLER INDUSTRIES
- Ami Enterprise
- Fuerst Day Lawson
- Kadoya Sesame Mills
- ECOM Agroindustrial Corporation
- Tradin Organic
- ETICO Group
Recent Developments
- In 2025, Olam International launched a sustainable sesame supply initiative in Nigeria, partnering with Kadoya Sesame Mills, IFAD, and MC Agri Alliance to support smallholder farmers, enhance productivity and quality, and promote environmentally responsible practices.
- In 2025, Kadoya Sesame Mills participated in a sustainable sesame supply initiative launched by Olam International in Nigeria, supporting the global push for ethically sourced sesame seeds.
- In 2024, Tradin Organic partnered with Osapiens, a leading ESG solutions company, to enhance compliance with the European Union Deforestation Regulation (EUDR), emphasizing sustainable sourcing and traceability in its sesame seed supply chain
Report Coverage
The research report offers an in-depth analysis based on Type, Category, Application and Geography. It details leading market players, providing an overview of their business, product offerings, investments, revenue streams, and key applications. Additionally, the report includes insights into the competitive environment, SWOT analysis, current market trends, as well as the primary drivers and constraints. Furthermore, it discusses various factors that have driven market expansion in recent years. The report also explores market dynamics, regulatory scenarios, and technological advancements that are shaping the industry. It assesses the impact of external factors and global economic changes on market growth. Lastly, it provides strategic recommendations for new entrants and established companies to navigate the complexities of the market.
Future Outlook
- Demand will grow as packaged food makers expand sesame use in bakery and snack lines.
- Nutraceutical adoption will rise due to higher interest in mineral-rich and antioxidant foods.
- Organic sesame will gain share as clean-label and traceable sourcing become mainstream.
- Sesame oil processing will expand in Asia and the Middle East due to rising culinary demand.
- Personal care brands will increase use of sesame-based ingredients in natural product lines.
- Export markets will strengthen as buyers seek consistent, high-quality seed grades.
- Digital traceability tools will improve supply transparency and reduce rejection rates.
- Climate-resilient seed varieties will help stabilize yields across major producing regions.
- Processing upgrades will improve cleaning, sorting, and hulling efficiency in key exporters.
- Global cuisine trends will support broader retail adoption across sauces, toppings, and condiments.
Request a Free Sample
Fill in your details and we'll send you a free sample report.
- Sample data tables & charts
- Research methodology
Need a Custom Version of This Report?
Tailor the scope, geography, or segments to your exact requirements.
- Custom geography or segment scope
- Direct access to our analyst team
Frequently Asked Questions
What is the current market size for Sesame Seeds Market, and what is its projected size in 2032?
At what Compound Annual Growth Rate is the Sesame Seeds Market projected to grow between 2024 and 2032?
Which Sesame Seeds Market segment held the largest share in 2024?
What are the primary factors fueling the growth of the Sesame Seeds Market?
Who are the leading companies in the Sesame Seeds Market?
Table of Content
Chapter 1. Report Introduction
- 1.1 Report Description & Purpose
- 1.1.1 Report Title & Market Definition
- 1.1.2 Unique Selling Propositions (USP) & Key Differentiators
- 1.1.3 Value Proposition for Stakeholders
- 1.2 Research Objectives
- 1.2.1 Market Sizing Objectives (Volume & Revenue)
- 1.2.2 Segmentation Objectives
- 1.2.3 Competitive Intelligence Objectives
- 1.2.4 Forecast & Scenario Objectives
- 1.3 Report Scope
- 1.3.1 Sesame Seeds Scope – Types & Subtypes Covered
- 1.3.2 Geographic Scope – Regions & Countries Covered
- 1.3.3 Historical Period, Base Year & Forecast Period (2024; forecast to 2032)
- 1.3.4 Inclusions & Exclusions
- 1.4 HS Code & Classification Framework
- 1.5 Currency, Units & Pricing Basis
- 1.6 Target Stakeholders
- 1.7 Limitations & Assumptions
Chapter 2. Executive Summary
- 2.1 Global Sesame Seeds Market Snapshot
- 2.1.1 Market Size – Historical (2024) & Forecast (2024-2032) (2024: USD 7700 million → 2032: USD 9092.78 million)
- 2.1.2 Volume & Revenue – Global Totals
- 2.1.3 Key Market Highlights – Top Five Facts
- 2.2 Sesame Seeds Market Segmentation Snapshot
- 2.2.1 Market Split by Region – 2024 vs. 2032
- 2.3 Competitive Snapshot
- 2.3.1 Top 10 Players by Revenue Share – 2024
- 2.3.2 Top 10 Players by Volume Share – 2024
- 2.3.3 Recent Strategic Developments (18-Month Summary)
- 2.4 Key Investment Highlights & Strategic Conclusions
Chapter 3. Sesame Seeds Market Dynamics & Industry Analysis
- 3.1 Market Overview & Context
- 3.1.1 Sesame Seeds Market Position in the Broader Automotive Value Chain
- 3.1.2 OEM vs. Replacement Market Dynamics
- 3.1.3 Market Maturity & Development Stage by Region
- 3.2 Sesame Seeds Market Drivers
- 3.3 Sesame Seeds Market Restraints & Challenges
- 3.4 Sesame Seeds Market Opportunities
- 3.5 Porter's Five Forces Analysis
- 3.5.1 Threat of New Entrants
- 3.5.2 Bargaining Power of Suppliers
- 3.5.3 Bargaining Power of Buyers
- 3.5.4 Threat of Substitutes
- 3.5.5 Competitive Rivalry – Intensity Assessment
- 3.6 Sesame Seeds Value Chain Analysis
- 3.6.1 Upstream – Raw Material/Input Suppliers
- 3.6.1.1 Raw Material/Input 1
- 3.6.1.2 Raw Material/Input 2
- 3.6.1.3 Raw Material/Input 3
- 3.6.2 Midstream – Production/Manufacturing/Service Delivery
- 3.6.2.1 Production/Process Overview
- 3.6.2.2 Key Facility Locations & Capacity by Manufacturer
- 3.6.3 Downstream – Distribution & End Consumer
- 3.6.3.1 Primary Channel – B2B/OEM
- 3.6.3.2 Secondary Channels – Dealer, Retail, Online, Direct
- 3.6.4 Value Chain Profitability Analysis
- 3.6.1 Upstream – Raw Material/Input Suppliers
- 3.7 PESTEL Analysis
- 3.7.1 Political Factors
- 3.7.2 Economic Factors
- 3.7.3 Social Factors
- 3.7.4 Technological Factors
- 3.7.5 Environmental Factors
- 3.7.6 Legal Factors
- 3.8 Sesame Seeds Supply Chain Analysis
- 3.8.1 Raw Material/Input Supply Risk Assessment
- 3.8.2 Manufacturing Concentration Risk (Geographic Exposure)
- 3.8.3 Trade Disruption Impact Analysis
- 3.9 Regulatory & Policy Landscape
Note: The regulatory and policy landscape section covers regulations based on their applicability to the market, Sesame Seeds category, geography, and scope of the study. Only regulatory frameworks with a material impact on operations, compliance, trade, sustainability, or market access are analyzed in detail.
Chapter 4. Key Investment Pockets & Opportunity Analysis
- 4.1 Sesame Seeds Market Attractiveness Analysis
- 4.1.1 By Region – Investment Attractiveness Matrix (Volume × CAGR)
- 4.2 Absolute Revenue Growth Opportunity
- 4.2.1 By Region – Absolute USD Growth Through 2032
- 4.3 Incremental Volume Opportunity
- 4.3.1 By Region – Incremental Volume Through 2032
- 4.3.2 Segment – Incremental Volume
- 4.4 Emerging Submarket Opportunity Deep Dive (Subject to Applicability)
- 4.5 Emerging Market Opportunity Scorecards
- 4.5.1 United States
- 4.5.2 Europe
- 4.5.3 Asia
- 4.5.4 Middle East & Africa
Note: Emerging Market Opportunity Scorecards will be included based on relevance and strategic importance. Regions listed are indicative and may vary depending on data availability and market dynamics.
Chapter 5. Sesame Seeds Import-Export Analysis & Trade Flows
- 5.1 Global Trade Overview
- 5.1.1 Global Export Value by Country (2024)
- 5.1.2 Global Export Volume by Country (2024)
- 5.1.3 Global Import Value by Country (2024)
- 5.1.4 Global Import Volume by Country (2024)
- 5.1.5 Net Trade Balance by Country (2024)
- 5.2 Export Analysis – Segment
- 5.2.1 Type 1 (HS Code)
- 5.2.2 Type 2 (HS Code)
- 5.2.3 Type 3 (HS Code)
- 5.2.4 Type 4 (HS Code)
- 5.2.5 Type 5 (HS Code)
- 5.3 Import Analysis – Segment
- 5.3.1 Type 1 (HS Code)
- 5.3.2 Type 2 (HS Code)
- 5.3.3 Type 3 (HS Code)
- 5.3.4 Type 4 (HS Code)
- 5.3.5 Type 5 (HS Code)
- 5.4 Average Unit Trade Prices
- 5.4.1 Average Export Price – Segment & Country
- 5.4.2 Average Import Price – Segment & Source Country
- 5.4.3 Price Trends (2024)
- 5.5 Key Trade Route Analysis
- 5.5.1 Trade Route 1
- 5.5.2 Trade Route 2
- 5.5.3 Trade Route 3
- 5.5.4 Trade Route 4
- 5.5.5 Trade Route 5
- 5.6 Trade Policy Impact Assessment
- 5.6.1 US Anti-Dumping & Section 301 Tariffs
- 5.6.2 EU Customs Union Impact
- 5.6.3 Major Free Trade Agreements
- 5.6.4 USMCA Rules of Origin
Note: Trade policy analysis will be included only where relevant to the Sesame Seeds market.
Chapter 6. Competitive Landscape & Company Benchmarking
- 6.1 Sesame Seeds Market Concentration & Structure
- 6.1.1 Herfindahl-Hirschman Index (HHI) – vs. 2024
- 6.1.2 Tier 1, Tier 2 & Tier 3 Market Structure
- 6.1.3 Global, Regional & Local Player Dynamics
- 6.2 Sesame Seeds Market Share Analysis – 2024
- 6.2.1 Global Revenue Share by Company
- 6.2.2 Global Volume Share by Company
- 6.2.3 Regional Revenue Share
- 6.2.4 Market Share Evolution ( vs. 2024)
- 6.2.5 OEM Segment Share by Company
- 6.2.6 Replacement Segment Share by Company
- 6.3 Production/Delivery Capacity & Facility Analysis
- 6.3.1 Global Installed Capacity
- 6.3.2 Capacity Utilization Rates
- 6.3.3 Production/Output Volume
- 6.3.4 Facility Locations & Capacity Map
- 6.3.5 Planned Capacity Additions
- 6.4 Sesame Seeds Competitive Benchmarking Matrix
- 6.4.1 Revenue, Volume, CAGR & Profitability Comparison
- 6.4.2 Channel Revenue Mix
- 6.4.3 Geographic Revenue Exposure
- 6.4.4 R&D Intensity
- 6.4.5 Sustainability Maturity
- 6.5 Strategic Developments in Sesame Seeds (Last 24 Months)
- 6.5.1 Mergers, Acquisitions & Divestments
- 6.5.2 New Sesame Seeds Launches
- 6.5.3 Facility Expansions
- 6.5.4 Strategic Alliances, Joint Ventures & Partnerships
- 6.5.5 Distribution Expansion & Market Entry
- 6.5.6 Sustainability & ESG Initiatives
- 6.6 Competitive Strategy Mapping
- 6.6.1 Leader, Challenger, Follower & Niche Classification
- 6.6.2 Pricing Strategy Comparison
- 6.6.3 Channel Strategy Matrix
Note: Strategic developments are included based on their materiality and the availability of reliable information.
Chapter 7. Global Sesame Seeds Market – By Distribution Channel
- 7.1 Segment Overview
- 7.1.1 Volume & Revenue Split by Channel (2024 & 2032)
- 7.1.2 Channel Mix Evolution (2024-2032)
Chapter 8. Regional Market Analysis – Global Overview
- 8.1 Global Regional Overview
- 8.1.1 Regional Volume Share
- 8.1.2 Regional Revenue Share
- 8.1.3 Regional Volume by Region
- 8.1.4 Regional Revenue by Region
- 8.1.5 Regional Forecast Through 2032
- 8.2 Cross-Regional Segment Analysis
- 8.2.1 By Distribution Channel
- 8.2.2 By Brand/Price Tier
Chapter 9. North America Sesame Seeds Market
- 9.1 United States
- 9.2 Canada
- 9.3 Mexico
Chapter 10. Europe Sesame Seeds Market
- 10.1 Germany
- 10.2 France
- 10.3 Italy
- 10.4 United Kingdom
- 10.5 Spain
- 10.6 Poland
- 10.7 Russia
- 10.8 Netherlands
- 10.9 Belgium
- 10.10 Sweden
- 10.11 Denmark
- 10.12 Norway
- 10.13 Rest of Europe
Chapter 11. Asia Pacific Sesame Seeds Market
- 11.1 China
- 11.2 India
- 11.3 Japan
- 11.4 South Korea
- 11.5 Thailand
- 11.6 Indonesia
- 11.7 Vietnam
- 11.8 Malaysia
- 11.9 Australia
- 11.10 Rest of Asia Pacific
Chapter 12. Latin America Sesame Seeds Market
- 12.1 Brazil
- 12.2 Argentina
- 12.3 Colombia
- 12.4 Chile
- 12.5 Rest of Latin America
Chapter 13. Middle East Sesame Seeds Market
- 13.1 Saudi Arabia
- 13.2 United Arab Emirates
- 13.3 Turkey
- 13.4 Israel
- 13.5 Iran
- 13.6 Rest of the Middle East
Chapter 14. Africa Sesame Seeds Market
- 14.1 South Africa
- 14.2 Egypt
- 14.3 Nigeria
- 14.4 Morocco
- 14.5 Rest of Africa
Chapter 15. Sesame Seeds Company Profiles
- 15.1 [Company 01]
- 15.1.1 Company Overview
- 15.1.2 Key Management Personnel
- 15.1.3 Products & Services Portfolio
- 15.1.4 Financial Performance
- 15.1.5 Key Market Focus & Geographic Presence
- 15.1.6 Recent Developments & Strategic Initiatives
Note: The company profile list is preliminary and may change based on research findings, market developments, data availability, and client requirements.
Chapter 16. Appendices
- Appendix A – List of Abbreviations & Acronyms
- Appendix B – Industry Classification Code Reference – Full Series
- Appendix C – Production & Capacity Data Tables
- Appendix D – End-Use & Demand Base Tables
- Appendix E – Consumption & Replacement Rate Assumptions
- Appendix F – ASP Reference Tables
- Appendix G – Manufacturing & Facility Database
- Appendix H – Import-Export Data Tables
- Appendix I – Regulatory Summary Tables
- Appendix J – Primary Research Participant List (Anonymized)
- Appendix K – Primary Research Questionnaire Framework
- Appendix L – Data Sources & Bibliography
- Appendix M – Market Size Divergence & Source Comparison
Chapter 17. Research Methodology
- 17.1 Research Framework & Philosophy
- 17.2 Secondary Research – Sources, Hierarchy & Data Extraction
- 17.3 Data Modeling – Bottom-Up & Top-Down Market Sizing
- 17.4 Primary Research – Stakeholder Framework, LOI & Sample Sizes
- 17.5 Forecast Methodology – Regression, Scenario & Sensitivity Analysis
- 17.6 Quality Control – Four-Layer Validation Framework
- 17.7 Limitations & Standard Assumptions
- 17.8 Disclaimer
