
Market Overview
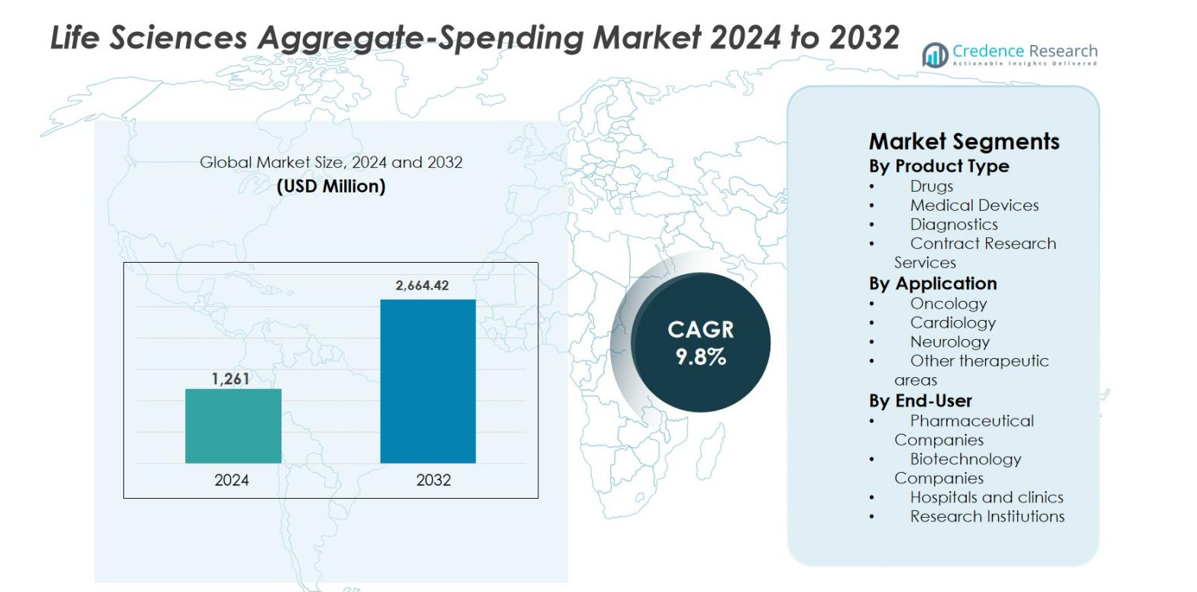
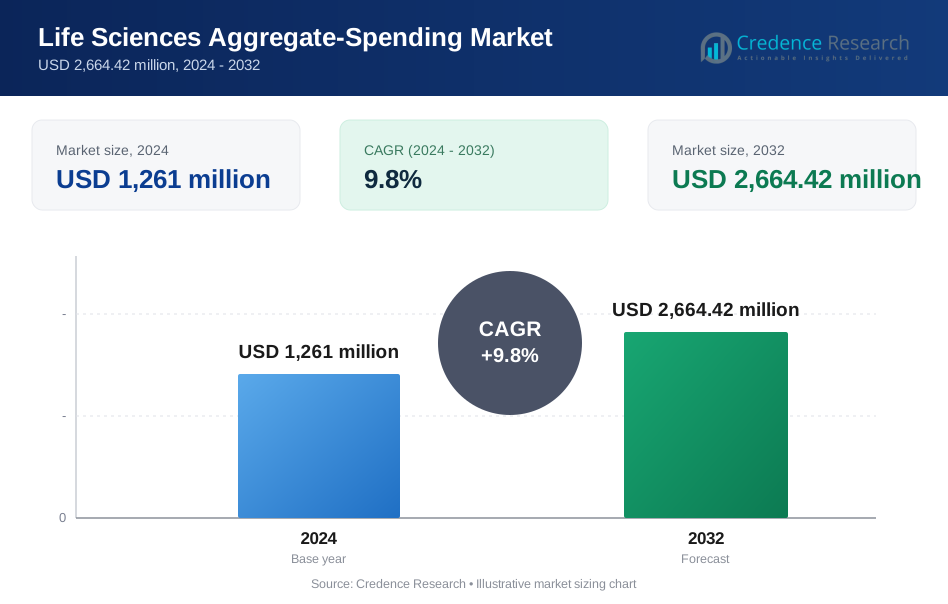
Life Sciences Aggregate-Spending Market size was valued at USD 1,261 million in 2024 and is anticipated to reach USD 2,664.42 million by 2032, growing at a CAGR of 9.8% during the forecast period.
| REPORT ATTRIBUTE | DETAILS |
|---|---|
| Historical Period | 2020-2023 |
| Base Year | 2024 |
| Forecast Period | 2025-2032 |
| Life Sciences Aggregate-Spending Market Size 2024 | USD 1,261 million |
| Life Sciences Aggregate-Spending Market, CAGR | 9.8% |
| Life Sciences Aggregate-Spending Market Size 2032 | USD 2,664.42 million |
Life Sciences Aggregate-Spending Market analysis highlights a competitive environment led by established compliance and transparency solution providers such as IQVIA Inc., MedPro Systems LLC, Qordata, Porzio Life Sciences, Vector Health, Inc., Alanda Software, MediCompli, MMIS, Inc., Pharmagin, and Capgemini. These companies focus on delivering scalable, automated platforms that address complex regulatory reporting, data integration, and audit readiness requirements across global life sciences organizations. North America emerged as the leading region, accounting for 42.6% market share in 2024, driven by stringent transparency regulations, high pharmaceutical spending, and early adoption of advanced compliance technologies. Strong regulatory enforcement and mature IT infrastructure continue to support regional dominance while sustaining demand for sophisticated aggregate-spending solutions.
Market Insights
- Life Sciences Aggregate-Spending market was valued at USD 1,261 million in 2024 and is projected to reach USD 2,664.42 million by 2032, expanding at a CAGR of 9.8% during the forecast period, reflecting rising global compliance and transparency requirements across the life sciences industry.
- Increasing regulatory mandates on financial disclosures between life sciences companies and healthcare professionals act as a major market driver, pushing organizations to adopt automated aggregate-spending solutions to manage high transaction volumes, ensure audit readiness, and minimize compliance risks.
- Market trends highlight growing adoption of cloud-based, analytics-driven platforms that enable real-time monitoring, automated reporting, and predictive risk identification, while the Drugs segment leads by product type with approximately 46.8% share due to high promotional and research-related spending.
- Competitive analysis shows strong presence of specialized compliance solution providers and global consulting firms focusing on automation, integration, and multi-region regulatory coverage to differentiate offerings and strengthen long-term client relationships.
- Regional analysis indicates North America leads with 42.6% market share, followed by Europe at 29.4% and Asia-Pacific at 18.1%, driven by regulatory maturity, expanding pharmaceutical activity, and increasing compliance awareness.
Market Segmentation Analysis:
By Product Type
The Life Sciences Aggregate-Spending market, by product type, is dominated by the Drugs segment, which accounted for 46.8% market share in 2024. High spending intensity in branded pharmaceuticals, specialty drugs, and biologics drives this dominance, as these products involve complex physician engagement, promotional activities, and regulatory reporting requirements. Pharmaceutical manufacturers allocate substantial budgets to track payments related to speaker programs, consulting fees, and research collaborations. Continuous innovation pipelines, rising drug launches, and stricter global transparency regulations further accelerate adoption of aggregate-spending solutions within the drugs segment.
- For instance, BioHaven, a Pfizer subsidiary, paid nearly $60 million from March 2020 to September 2022 for speaker programs tied to its migraine drug Nurtec ODT, involving repeat attendees and improper payments.
By Application
By application, the Oncology segment led the Life Sciences Aggregate-Spending market with an 38.4% share in 2024. Oncology’s dominance stems from high-value therapies, frequent clinical trials, and extensive interactions between life sciences companies and healthcare professionals. Oncology treatments often involve complex treatment pathways, combination therapies, and specialized physician education programs, increasing reportable spend. Growing global cancer prevalence, rapid development of targeted therapies and immuno-oncology drugs, and heightened regulatory scrutiny on financial disclosures continue to drive strong aggregate-spending management demand in oncology applications.
- For instance, IQVIA Transparency Reporting is designed to collect spend from automated/manual sources and consolidate it to unique HCP/HCO profiles while supporting multi-jurisdiction transparency frameworks.
By End-User
Among end-users, Pharmaceutical Companies held the largest share of the Life Sciences Aggregate-Spending market at 51.2% in 2024. These organizations manage extensive financial relationships with healthcare professionals, research institutions, and contract partners, requiring robust compliance and reporting frameworks. Large sales forces, frequent promotional engagements, and global clinical development activities significantly increase data volume and compliance complexity. Ongoing regulatory expansions, rising penalties for non-compliance, and the need for real-time spend visibility strongly drive pharmaceutical companies to invest in advanced aggregate-spending and transparency management platforms.
Key Growth Drivers
Expanding Global Transparency and Compliance Regulations
The Life Sciences Aggregate-Spending market is significantly driven by the expansion of global transparency and compliance regulations governing financial relationships between life sciences companies and healthcare professionals. Governments and regulatory bodies continue to strengthen disclosure mandates to improve accountability, minimize conflicts of interest, and enhance public trust in healthcare systems. These regulations require accurate reporting of payments related to consulting, research funding, speaker engagements, and educational grants. As regulatory coverage expands across countries and therapeutic areas, companies face rising reporting complexity and data volumes. Manual compliance approaches are increasingly inefficient and risky. As a result, organizations invest in automated aggregate-spending solutions that enable standardized data capture, validation, audit readiness, and timely regulatory submissions, making regulatory pressure a sustained growth driver.
- For instance, U.S. CMS Open Payments data shows over 12 million payment records reported annually, highlighting the scale and granularity of disclosures required under federal transparency rules.
Rising Complexity of Commercial and Clinical Engagement Models
Growing complexity in commercial and clinical engagement models strongly fuels demand in the Life Sciences Aggregate-Spending market. Life sciences companies engage healthcare professionals through diverse activities such as advisory boards, speaker programs, consulting services, investigator-initiated trials, and grants. The expansion of digital, hybrid, and omnichannel engagement models further increases transaction frequency and data diversity. Managing spend across products, regions, and therapeutic areas creates operational challenges and compliance risks. Aggregate-spending platforms provide centralized visibility, standardized categorization, and real-time monitoring of financial interactions. Increased collaboration with contract research organizations and external service providers further amplifies data complexity. These factors collectively drive sustained adoption of robust aggregate-spending management solutions across the industry.
- For instance, Vector Health highlights that hybrid congresses and multi-country educational programs generate overlapping spend records across entities, driving demand for centralized visibility, standardized categorization, and real-time monitoring through aggregate-spending solutions.
Heightened Enforcement, Penalties, and Reputational Risk
Stronger regulatory enforcement and increasing penalties for non-compliance are major growth drivers in the Life Sciences Aggregate-Spending market. Regulatory authorities are conducting more frequent audits and imposing substantial fines for inaccurate, incomplete, or delayed disclosures. In addition to financial penalties, public access to disclosed spending data exposes companies to reputational damage and legal scrutiny. Even minor reporting errors can impact brand credibility and stakeholder confidence. To mitigate these risks, organizations prioritize proactive compliance strategies supported by advanced aggregate-spending platforms. These systems ensure data accuracy, maintain detailed audit trails, and enable early identification of reporting gaps. The need to reduce compliance exposure and protect corporate reputation continues to accelerate market growth.
Key Trends & Opportunities
Integration of Advanced Analytics and Intelligent Automation
The integration of advanced analytics and intelligent automation is a key trend shaping the Life Sciences Aggregate-Spending market. Automation streamlines data collection, validation, reconciliation, and regulatory reporting, significantly reducing manual workload and error rates. Advanced analytics provide actionable insights into spending behavior, compliance risks, and regional variations. Predictive tools and anomaly detection help organizations identify potential reporting issues before submission deadlines. These capabilities improve audit readiness and operational efficiency while supporting scalability as transaction volumes grow. Vendors offering analytics-driven solutions can differentiate by transforming aggregate-spending systems from compliance-focused tools into strategic platforms that support risk management, forecasting, and data-driven decision-making, creating long-term value for market participants.
- For instance, MMIS, Inc.’s AggregateSpend platforms incorporate anomaly detection and predictive validation to identify duplicate, out-of-threshold, or misclassified transactions ahead of submission deadlines, improving audit readiness.
Shift Toward Cloud-Based and Modular Compliance Platforms
The growing shift toward cloud-based and modular platforms presents a strong opportunity in the Life Sciences Aggregate-Spending market. Cloud deployment enables scalability, faster implementation, and reduced infrastructure costs while supporting frequent regulatory updates. These platforms allow global accessibility and seamless integration with CRM, ERP, and clinical systems. Modular architectures provide flexibility, enabling organizations to deploy specific functionalities based on regional regulations or business requirements. This approach is particularly attractive to mid-sized and expanding life sciences companies seeking cost-effective compliance solutions. Subscription-based models further improve affordability and adoption, creating sustained growth opportunities for solution providers offering flexible, cloud-native aggregate-spending platforms.
- For instance, MediCompli highlights that its web-based transparency solutions integrate with CRM and financial systems to streamline data ingestion and reporting as organizations expand into new regulated markets.
Key Challenges
Data Integration and Data Quality Management
Data integration and quality management remain major challenges in the Life Sciences Aggregate-Spending market. Aggregate-spending systems rely on data from multiple internal and external sources, including sales platforms, finance systems, clinical databases, and third-party vendors. Variations in data formats, delayed submissions, and incomplete records increase the risk of reporting inaccuracies. Legacy systems and fragmented IT infrastructures further complicate integration and reconciliation processes. Ensuring consistent data quality across regions and engagement types requires strong governance, continuous validation, and cross-functional coordination. These requirements increase operational complexity and compliance costs, making data management a persistent challenge for organizations adopting aggregate-spending solutions.
Managing Regulatory Fragmentation Across Global Markets
Regulatory fragmentation across global markets poses a significant challenge for the Life Sciences Aggregate-Spending market. Transparency requirements vary widely by country in terms of reporting thresholds, data elements, submission timelines, and disclosure formats. Regulations also change frequently, requiring continuous system updates and staff training. Multinational companies must balance local regulatory compliance with the need for consistent global reporting frameworks. Adapting systems to meet diverse requirements without increasing operational burden is complex. Failure to align reporting processes with local regulations can lead to compliance gaps, penalties, and reputational risk, making regulatory variability an ongoing challenge for market participants.
Regional Analysis
North America
North America dominated the Life Sciences Aggregate-Spending market with 42.6% market share in 2024, supported by a highly regulated healthcare environment and strong enforcement of transparency laws. The United States drives regional leadership due to stringent disclosure requirements, high pharmaceutical spending, and widespread adoption of compliance technologies. Large pharmaceutical and biotechnology companies operate complex commercial and clinical engagement models, generating significant volumes of reportable transactions. Advanced IT infrastructure, early adoption of cloud-based compliance platforms, and heightened audit scrutiny further strengthen demand. Continuous regulatory updates and reputational risk management remain key drivers sustaining North America’s market leadership.
Europe
Europe accounted for 29.4% of the Life Sciences Aggregate-Spending market in 2024, driven by expanding transparency frameworks across major economies. Countries such as France, Germany, the UK, and Italy enforce detailed disclosure obligations for interactions between life sciences companies and healthcare professionals. The region’s fragmented regulatory landscape increases compliance complexity, encouraging adoption of centralized aggregate-spending solutions. Strong presence of multinational pharmaceutical companies, growing cross-border clinical research activities, and rising public scrutiny of financial disclosures support market growth. Increasing alignment of regional regulations with global transparency standards further accelerates solution adoption across Europe.
Asia-Pacific
Asia-Pacific represented 18.1% market share in 2024 and is the fastest-growing region in the Life Sciences Aggregate-Spending market. Rapid expansion of pharmaceutical manufacturing, clinical trials, and healthcare infrastructure in countries such as China, Japan, India, and South Korea drives demand. Governments are strengthening transparency and compliance frameworks, increasing reporting obligations for life sciences companies. Rising engagement with healthcare professionals, growing contract research activity, and increasing presence of global pharmaceutical players further boost market adoption. Improving digital infrastructure and rising awareness of compliance risks accelerate the shift toward automated aggregate-spending platforms across the region.
Latin America
Latin America held 6.1% share of the Life Sciences Aggregate-Spending market in 2024, supported by gradual regulatory modernization and expanding pharmaceutical markets. Countries such as Brazil, Mexico, and Argentina are strengthening disclosure requirements related to healthcare professional interactions. Growth in regional pharmaceutical production, clinical research activities, and multinational company presence increases compliance needs. However, varying regulatory maturity and limited digital infrastructure slow adoption compared to developed regions. As governments enhance transparency frameworks and organizations prioritize risk mitigation, demand for scalable and cost-effective aggregate-spending solutions continues to rise steadily across Latin America.
Middle East & Africa
The Middle East & Africa accounted for about 3.8% of the Life Sciences Aggregate-Spending market in 2024, reflecting an emerging but evolving compliance landscape. Growth is driven by healthcare system modernization, expanding pharmaceutical imports, and increasing engagement with global life sciences companies. Gulf countries are gradually introducing transparency and governance frameworks aligned with international standards. In Africa, rising clinical research activity and donor-funded healthcare programs contribute to reporting needs. While adoption remains limited due to regulatory variability and infrastructure constraints, increasing compliance awareness is expected to support long-term market expansion.
Market Segmentations:
By Product Type
- Drugs
- Medical Devices
- Diagnostics
- Contract Research Services
By Application
- Oncology
- Cardiology
- Neurology
- Other therapeutic areas
By End-User
- Pharmaceutical Companies
- Biotechnology Companies
- Hospitals and clinics
- Research Institutions
By Geography
- North America
- U.S.
- Canada
- Mexico
- Europe
- Germany
- France
- U.K.
- Italy
- Spain
- Rest of Europe
- Asia Pacific
- China
- Japan
- India
- South Korea
- South-east Asia
- Rest of Asia Pacific
- Latin America
- Brazil
- Argentina
- Rest of Latin America
- Middle East & Africa
- GCC Countries
- South Africa
- Rest of the Middle East and Africa
Competitive Landscape
The competitive landscape of the Life Sciences Aggregate-Spending market is characterized by the presence of specialized compliance technology providers and global consulting firms offering advanced transparency and reporting solutions. Key players such as IQVIA Inc., MedPro Systems LLC, Qordata, Porzio Life Sciences, Vector Health, Inc., Alanda Software, MediCompli, MMIS, Inc., Pharmagin, and Capgemini focus on delivering scalable platforms that support regulatory compliance, data accuracy, and audit readiness. Competition centers on product functionality, regulatory coverage, analytics capabilities, and ease of integration with CRM, ERP, and clinical systems. Vendors increasingly differentiate through cloud-based deployment, automation, and advanced analytics to manage complex, multi-region reporting requirements. Strategic partnerships, platform enhancements, and expansion into emerging markets remain common strategies, as companies seek to strengthen global presence and address evolving transparency regulations across life sciences value chains.
Key Player Analysis
- MMIS, Inc.
- IQVIA Inc.
- MediCompli
- Vector Health, Inc.
- Cap Gemini
- Pharmagin
- Alanda Software
- Qordata
- Porzio Life Sciencess, LLC
- MedPro Systems LLC
Recent Developments
- In December 2025, Veeva Systems launched Veeva AI Agents for its Vault CRM and PromoMats platforms, introducing industry-specific AI features (e.g., Voice Agent, Free Text Agent) to increase productivity and compliance in life sciences commercial and content workflows
- In August 2025, IQVIA and Flagship Pioneering announced a strategic collaboration to accelerate the development of breakthrough life sciences companies by combining IQVIA’s analytics, data, and clinical execution capabilities with Flagship’s bioplatform ecosystem.
- In August 2025, MediSpend acquired Alucio, an AI-enabled content management and HCP engagement technology provider, expanding its stakeholder engagement and compliance capabilities in the life sciences sector.
Report Coverage
The research report offers an in-depth analysis based on Product Type, Application, End-User and Geography. It details leading market players, providing an overview of their business, product offerings, investments, revenue streams, and key applications. Additionally, the report includes insights into the competitive environment, SWOT analysis, current market trends, as well as the primary drivers and constraints. Furthermore, it discusses various factors that have driven market expansion in recent years. The report also explores market dynamics, regulatory scenarios, and technological advancements that are shaping the industry. It assesses the impact of external factors and global economic changes on market growth. Lastly, it provides strategic recommendations for new entrants and established companies to navigate the complexities of the market.
Future Outlook
- Life Sciences Aggregate-Spending market will continue to expand as global transparency and disclosure regulations become more stringent and comprehensive.
- Increasing enforcement actions and audits will drive sustained demand for automated and auditable compliance platforms.
- Cloud-based aggregate-spending solutions will gain wider adoption due to scalability, flexibility, and faster regulatory updates.
- Integration of artificial intelligence and advanced analytics will enhance risk detection, forecasting, and decision support capabilities.
- Life sciences companies will increasingly centralize global spend data to ensure consistency across regions and business units.
- Growing complexity of commercial and clinical engagement models will require more sophisticated tracking and classification tools.
- Emerging markets will adopt aggregate-spending solutions as regulatory frameworks mature and compliance awareness increases.
- Vendors will focus on modular and configurable platforms to address country-specific regulatory requirements efficiently.
- Strategic partnerships and platform integrations will strengthen end-to-end compliance and reporting ecosystems.
- Continuous innovation in automation and data governance will position aggregate-spending systems as strategic compliance enablers.
Request a Free Sample
Fill in your details and we'll send you a free sample report.
- Sample data tables & charts
- Research methodology
Need a Custom Version of This Report?
Tailor the scope, geography, or segments to your exact requirements.
- Custom geography or segment scope
- Direct access to our analyst team
Frequently Asked Questions
What is the current market size for Life Sciences Aggregate-Spending market, and what is its projected size in 2032?
At what Compound Annual Growth Rate is the Life Sciences Aggregate-Spending market projected to grow between 2024 and 2032?
How Does the Life Sciences Sector Allocate Spending Across Different Segments?
What Role Does Technological Innovation Play in Driving Life Sciences Spending?
Who are the leading companies in the Life Sciences Aggregate-Spending market?
Which region commanded the largest share of the Life Sciences Aggregate-Spending market in 2024?
Table of Content
Chapter 1. Report Introduction
- 1.1 Report Description & Purpose
- 1.1.1 Report Title & Market Definition
- 1.1.2 Unique Selling Propositions (USP) & Key Differentiators
- 1.1.3 Value Proposition for Stakeholders
- 1.2 Research Objectives
- 1.2.1 Market Sizing Objectives (Volume & Revenue)
- 1.2.2 Segmentation Objectives
- 1.2.3 Competitive Intelligence Objectives
- 1.2.4 Forecast & Scenario Objectives
- 1.3 Report Scope
- 1.3.1 Life Sciences Aggregate-Spending Scope – Types & Subtypes Covered
- 1.3.2 Geographic Scope – Regions & Countries Covered
- 1.3.3 Historical Period, Base Year & Forecast Period (2024; forecast to 2032)
- 1.3.4 Inclusions & Exclusions
- 1.4 HS Code & Classification Framework
- 1.5 Currency, Units & Pricing Basis
- 1.6 Target Stakeholders
- 1.7 Limitations & Assumptions
Chapter 2. Executive Summary
- 2.1 Global Life Sciences Aggregate-Spending Market Snapshot
- 2.1.1 Market Size – Historical (2024) & Forecast (2024-2032) (2024: USD 1,261 million → 2032: USD 2,664.42 million)
- 2.1.2 Volume & Revenue – Global Totals
- 2.1.3 Key Market Highlights – Top Five Facts
- 2.2 Life Sciences Aggregate-Spending Market Segmentation Snapshot
- 2.2.1 Market Split by Region – 2024 vs. 2032
- 2.3 Competitive Snapshot
- 2.3.1 Top 10 Players by Revenue Share – 2024
- 2.3.2 Top 10 Players by Volume Share – 2024
- 2.3.3 Recent Strategic Developments (18-Month Summary)
- 2.4 Key Investment Highlights & Strategic Conclusions
Chapter 3. Life Sciences Aggregate-Spending Market Dynamics & Industry Analysis
- 3.1 Market Overview & Context
- 3.1.1 Life Sciences Aggregate-Spending Market Position in the Broader Automotive Value Chain
- 3.1.2 OEM vs. Replacement Market Dynamics
- 3.1.3 Market Maturity & Development Stage by Region
- 3.2 Life Sciences Aggregate-Spending Market Drivers
- 3.3 Life Sciences Aggregate-Spending Market Restraints & Challenges
- 3.4 Life Sciences Aggregate-Spending Market Opportunities
- 3.5 Porter's Five Forces Analysis
- 3.5.1 Threat of New Entrants
- 3.5.2 Bargaining Power of Suppliers
- 3.5.3 Bargaining Power of Buyers
- 3.5.4 Threat of Substitutes
- 3.5.5 Competitive Rivalry – Intensity Assessment
- 3.6 Life Sciences Aggregate-Spending Value Chain Analysis
- 3.6.1 Upstream – Raw Material/Input Suppliers
- 3.6.1.1 Raw Material/Input 1
- 3.6.1.2 Raw Material/Input 2
- 3.6.1.3 Raw Material/Input 3
- 3.6.2 Midstream – Production/Manufacturing/Service Delivery
- 3.6.2.1 Production/Process Overview
- 3.6.2.2 Key Facility Locations & Capacity by Manufacturer
- 3.6.3 Downstream – Distribution & End Consumer
- 3.6.3.1 Primary Channel – B2B/OEM
- 3.6.3.2 Secondary Channels – Dealer, Retail, Online, Direct
- 3.6.4 Value Chain Profitability Analysis
- 3.6.1 Upstream – Raw Material/Input Suppliers
- 3.7 PESTEL Analysis
- 3.7.1 Political Factors
- 3.7.2 Economic Factors
- 3.7.3 Social Factors
- 3.7.4 Technological Factors
- 3.7.5 Environmental Factors
- 3.7.6 Legal Factors
- 3.8 Life Sciences Aggregate-Spending Supply Chain Analysis
- 3.8.1 Raw Material/Input Supply Risk Assessment
- 3.8.2 Manufacturing Concentration Risk (Geographic Exposure)
- 3.8.3 Trade Disruption Impact Analysis
- 3.9 Regulatory & Policy Landscape
Note: The regulatory and policy landscape section covers regulations based on their applicability to the market, Life Sciences Aggregate-Spending category, geography, and scope of the study. Only regulatory frameworks with a material impact on operations, compliance, trade, sustainability, or market access are analyzed in detail.
Chapter 4. Key Investment Pockets & Opportunity Analysis
- 4.1 Life Sciences Aggregate-Spending Market Attractiveness Analysis
- 4.1.1 By Region – Investment Attractiveness Matrix (Volume × CAGR)
- 4.2 Absolute Revenue Growth Opportunity
- 4.2.1 By Region – Absolute USD Growth Through 2032
- 4.3 Incremental Volume Opportunity
- 4.3.1 By Region – Incremental Volume Through 2032
- 4.3.2 Segment – Incremental Volume
- 4.4 Emerging Submarket Opportunity Deep Dive (Subject to Applicability)
- 4.5 Emerging Market Opportunity Scorecards
- 4.5.1 United States
- 4.5.2 Europe
- 4.5.3 Asia
- 4.5.4 Middle East & Africa
Note: Emerging Market Opportunity Scorecards will be included based on relevance and strategic importance. Regions listed are indicative and may vary depending on data availability and market dynamics.
Chapter 5. Life Sciences Aggregate-Spending Import-Export Analysis & Trade Flows
- 5.1 Global Trade Overview
- 5.1.1 Global Export Value by Country (2024)
- 5.1.2 Global Export Volume by Country (2024)
- 5.1.3 Global Import Value by Country (2024)
- 5.1.4 Global Import Volume by Country (2024)
- 5.1.5 Net Trade Balance by Country (2024)
- 5.2 Export Analysis – Segment
- 5.2.1 Type 1 (HS Code)
- 5.2.2 Type 2 (HS Code)
- 5.2.3 Type 3 (HS Code)
- 5.2.4 Type 4 (HS Code)
- 5.2.5 Type 5 (HS Code)
- 5.3 Import Analysis – Segment
- 5.3.1 Type 1 (HS Code)
- 5.3.2 Type 2 (HS Code)
- 5.3.3 Type 3 (HS Code)
- 5.3.4 Type 4 (HS Code)
- 5.3.5 Type 5 (HS Code)
- 5.4 Average Unit Trade Prices
- 5.4.1 Average Export Price – Segment & Country
- 5.4.2 Average Import Price – Segment & Source Country
- 5.4.3 Price Trends (2024)
- 5.5 Key Trade Route Analysis
- 5.5.1 Trade Route 1
- 5.5.2 Trade Route 2
- 5.5.3 Trade Route 3
- 5.5.4 Trade Route 4
- 5.5.5 Trade Route 5
- 5.6 Trade Policy Impact Assessment
- 5.6.1 US Anti-Dumping & Section 301 Tariffs
- 5.6.2 EU Customs Union Impact
- 5.6.3 Major Free Trade Agreements
- 5.6.4 USMCA Rules of Origin
Note: Trade policy analysis will be included only where relevant to the Life Sciences Aggregate-Spending market.
Chapter 6. Competitive Landscape & Company Benchmarking
- 6.1 Life Sciences Aggregate-Spending Market Concentration & Structure
- 6.1.1 Herfindahl-Hirschman Index (HHI) – vs. 2024
- 6.1.2 Tier 1, Tier 2 & Tier 3 Market Structure
- 6.1.3 Global, Regional & Local Player Dynamics
- 6.2 Life Sciences Aggregate-Spending Market Share Analysis – 2024
- 6.2.1 Global Revenue Share by Company
- 6.2.2 Global Volume Share by Company
- 6.2.3 Regional Revenue Share
- 6.2.4 Market Share Evolution ( vs. 2024)
- 6.2.5 OEM Segment Share by Company
- 6.2.6 Replacement Segment Share by Company
- 6.3 Production/Delivery Capacity & Facility Analysis
- 6.3.1 Global Installed Capacity
- 6.3.2 Capacity Utilization Rates
- 6.3.3 Production/Output Volume
- 6.3.4 Facility Locations & Capacity Map
- 6.3.5 Planned Capacity Additions
- 6.4 Life Sciences Aggregate-Spending Competitive Benchmarking Matrix
- 6.4.1 Revenue, Volume, CAGR & Profitability Comparison
- 6.4.2 Channel Revenue Mix
- 6.4.3 Geographic Revenue Exposure
- 6.4.4 R&D Intensity
- 6.4.5 Sustainability Maturity
- 6.5 Strategic Developments in Life Sciences Aggregate-Spending (Last 24 Months)
- 6.5.1 Mergers, Acquisitions & Divestments
- 6.5.2 New Life Sciences Aggregate-Spending Launches
- 6.5.3 Facility Expansions
- 6.5.4 Strategic Alliances, Joint Ventures & Partnerships
- 6.5.5 Distribution Expansion & Market Entry
- 6.5.6 Sustainability & ESG Initiatives
- 6.6 Competitive Strategy Mapping
- 6.6.1 Leader, Challenger, Follower & Niche Classification
- 6.6.2 Pricing Strategy Comparison
- 6.6.3 Channel Strategy Matrix
Note: Strategic developments are included based on their materiality and the availability of reliable information.
Chapter 7. Global Life Sciences Aggregate-Spending Market – By Distribution Channel
- 7.1 Segment Overview
- 7.1.1 Volume & Revenue Split by Channel (2024 & 2032)
- 7.1.2 Channel Mix Evolution (2024-2032)
Chapter 8. Regional Market Analysis – Global Overview
- 8.1 Global Regional Overview
- 8.1.1 Regional Volume Share
- 8.1.2 Regional Revenue Share
- 8.1.3 Regional Volume by Region
- 8.1.4 Regional Revenue by Region
- 8.1.5 Regional Forecast Through 2032
- 8.2 Cross-Regional Segment Analysis
- 8.2.1 By Distribution Channel
- 8.2.2 By Brand/Price Tier
Chapter 9. North America Life Sciences Aggregate-Spending Market
- 9.1 United States
- 9.2 Canada
- 9.3 Mexico
Chapter 10. Europe Life Sciences Aggregate-Spending Market
- 10.1 Germany
- 10.2 France
- 10.3 Italy
- 10.4 United Kingdom
- 10.5 Spain
- 10.6 Poland
- 10.7 Russia
- 10.8 Netherlands
- 10.9 Belgium
- 10.10 Sweden
- 10.11 Denmark
- 10.12 Norway
- 10.13 Rest of Europe
Chapter 11. Asia Pacific Life Sciences Aggregate-Spending Market
- 11.1 China
- 11.2 India
- 11.3 Japan
- 11.4 South Korea
- 11.5 Thailand
- 11.6 Indonesia
- 11.7 Vietnam
- 11.8 Malaysia
- 11.9 Australia
- 11.10 Rest of Asia Pacific
Chapter 12. Latin America Life Sciences Aggregate-Spending Market
- 12.1 Brazil
- 12.2 Argentina
- 12.3 Colombia
- 12.4 Chile
- 12.5 Rest of Latin America
Chapter 13. Middle East Life Sciences Aggregate-Spending Market
- 13.1 Saudi Arabia
- 13.2 United Arab Emirates
- 13.3 Turkey
- 13.4 Israel
- 13.5 Iran
- 13.6 Rest of the Middle East
Chapter 14. Africa Life Sciences Aggregate-Spending Market
- 14.1 South Africa
- 14.2 Egypt
- 14.3 Nigeria
- 14.4 Morocco
- 14.5 Rest of Africa
Chapter 15. Life Sciences Aggregate-Spending Company Profiles
- 15.1 [Company 01]
- 15.1.1 Company Overview
- 15.1.2 Key Management Personnel
- 15.1.3 Products & Services Portfolio
- 15.1.4 Financial Performance
- 15.1.5 Key Market Focus & Geographic Presence
- 15.1.6 Recent Developments & Strategic Initiatives
Note: The company profile list is preliminary and may change based on research findings, market developments, data availability, and client requirements.
Chapter 16. Appendices
- Appendix A – List of Abbreviations & Acronyms
- Appendix B – Industry Classification Code Reference – Full Series
- Appendix C – Production & Capacity Data Tables
- Appendix D – End-Use & Demand Base Tables
- Appendix E – Consumption & Replacement Rate Assumptions
- Appendix F – ASP Reference Tables
- Appendix G – Manufacturing & Facility Database
- Appendix H – Import-Export Data Tables
- Appendix I – Regulatory Summary Tables
- Appendix J – Primary Research Participant List (Anonymized)
- Appendix K – Primary Research Questionnaire Framework
- Appendix L – Data Sources & Bibliography
- Appendix M – Market Size Divergence & Source Comparison
Chapter 17. Research Methodology
- 17.1 Research Framework & Philosophy
- 17.2 Secondary Research – Sources, Hierarchy & Data Extraction
- 17.3 Data Modeling – Bottom-Up & Top-Down Market Sizing
- 17.4 Primary Research – Stakeholder Framework, LOI & Sample Sizes
- 17.5 Forecast Methodology – Regression, Scenario & Sensitivity Analysis
- 17.6 Quality Control – Four-Layer Validation Framework
- 17.7 Limitations & Standard Assumptions
- 17.8 Disclaimer
