Market Overview
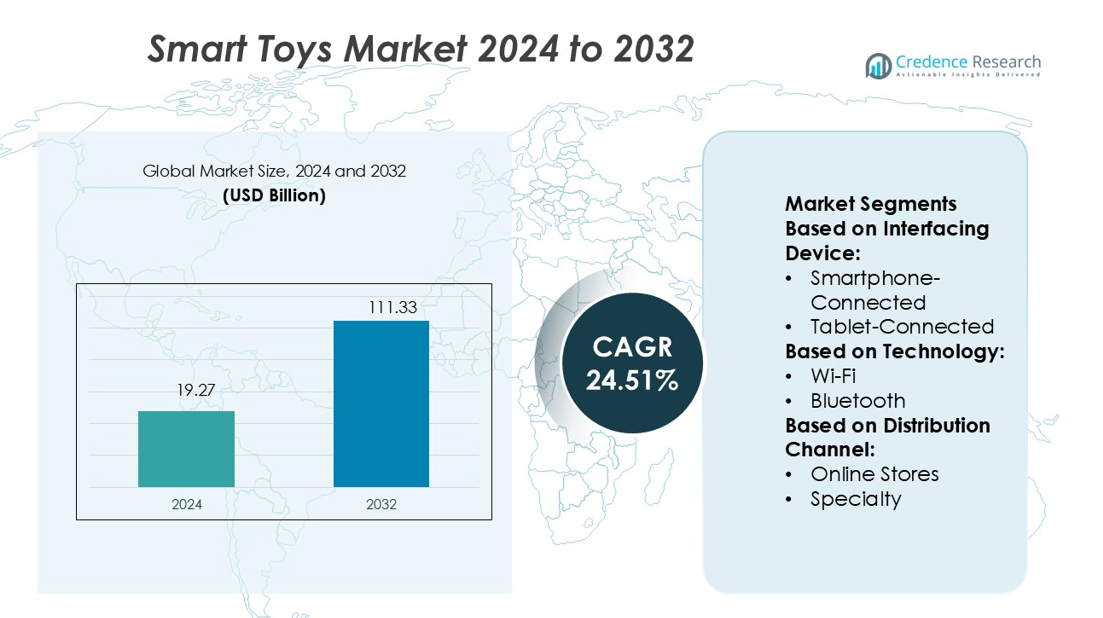
Smart Toys Market size was valued USD 19.27 billion in 2024 and is anticipated to reach USD 111.33 billion by 2032, at a CAGR of 24.51% during the forecast period.
| REPORT ATTRIBUTE |
DETAILS |
| Historical Period |
2020-2023 |
| Base Year |
2024 |
| Forecast Period |
2025-2032 |
| Smart Toys Market Size 2024 |
USD 19.27 billion |
| Smart Toys Market, CAGR |
24.51% |
| Smart Toys Market Size 2032 |
USD 111.33 billion |
The smart toys market is highly competitive, with top players such as Lego System A/S, Mattel Inc., Hasbro Inc., LeapFrog Enterprises Inc., Sega Toys Co. Ltd., Playmobil, Tomy Co. Ltd., Robofi LLC, Pillar Learning, and Doctor’s Associates Inc. driving innovation and consumer engagement. These companies focus on integrating AI, robotics, and STEM-based designs to enhance learning outcomes while strengthening global distribution through both offline and online channels. North America leads the global market with a 36% share, supported by advanced digital infrastructure, high consumer spending, and early adoption of connected learning solutions, positioning the region at the forefront of market growth.
Market Insights
- The Smart Toys Market was valued at USD 19.27 billion in 2024 and is projected to reach USD 111.33 billion by 2032, growing at a CAGR of 24.51% during the forecast period.
- Growing demand for interactive and STEM-based learning solutions, supported by AI and robotics integration, is driving market expansion across both developed and emerging economies.
- Key players such as Lego System A/S, Mattel Inc., and Hasbro Inc. compete by enhancing digital features, investing in R&D, and expanding through global online and offline distribution networks.
- High product costs and rising concerns about data privacy and security pose restraints, limiting adoption in price-sensitive and regulation-driven markets.
- North America leads with 36% market share due to strong digital infrastructure and consumer spending, while Asia Pacific emerges as the fastest-growing region; smartphone-connected toys and Bluetooth-enabled products dominate their respective segments, reinforcing the shift toward interactive, connected play solutions.
Access crucial information at unmatched prices!
Request your sample report today & start making informed decisions powered by Credence Research Inc.!
Download Sample
Market Segmentation Analysis:
By Interfacing Device
In the smart toys market, smartphone-connected toys dominate the segment, holding the largest share due to their strong compatibility with widely used mobile ecosystems. Parents and children favor these toys for seamless integration with interactive applications, real-time updates, and customizable learning modules. Their ability to link with cloud-based content enhances engagement and provides adaptive learning experiences. The growing penetration of smartphones globally, coupled with app-based innovation in educational and entertainment functions, continues to drive adoption, making smartphone-connected toys the leading choice over tablet-connected and console/other-connected alternatives.
- For instance, LeapFrog’s LeapFrog Epic tablet includes 1.3 GHz quad-core ARM Cortex-A7. Some later Academy Edition models used a 1.5 GHz ARM Cortex-A35 processor. The tablet came with 16 GB of flash memory and a microSD slot for expansion.
By Technology
Bluetooth-enabled smart toys lead the technology segment, capturing the highest share due to low power consumption, cost efficiency, and strong device connectivity. Bluetooth allows toys to connect easily with smartphones and tablets without requiring constant internet access, making them convenient for both indoor and outdoor use. Enhanced features like secure pairing and multi-device connectivity further support their widespread acceptance. While Wi-Fi technology is expanding with advanced interactive capabilities, Bluetooth remains dominant, driven by affordability, stable performance, and the increasing preference for secure offline interaction in children’s smart toys.
- For instance, LEGO’s Technic Hub 88012 connects via Bluetooth Low Energy (BLE) and supports 4 input/output ports, enabling control of multiple motors and sensors simultaneously. It also integrates a 3-axis tilt sensor for precise motion feedback.
By Distribution Channel
Online stores hold the dominant share in the distribution channel segment, supported by growing e-commerce adoption and the convenience of doorstep delivery. Parents increasingly prefer digital platforms for broader product variety, competitive pricing, and access to verified customer reviews. The integration of advanced recommendation systems and bundled offers enhances online sales of smart toys. Specialty and convenience stores remain relevant for personalized advice and immediate availability, but the shift toward digital-first purchasing habits and frequent promotional campaigns by leading e-commerce platforms continue to reinforce the leadership of online stores in the market.
Market Overview
Rising Demand for Interactive Learning
Smart toys are increasingly adopted as tools for interactive education, blending entertainment with structured learning. Parents and educators prefer these toys for their ability to enhance cognitive skills, problem-solving abilities, and language development. With growing emphasis on STEM-based education, smart toys equipped with coding, robotics, and AI-driven features are gaining traction. The focus on personalized and adaptive learning experiences strengthens adoption across both developed and emerging markets, making interactive learning a central driver for the expansion of the smart toys market.
- For instance, Sega’s Pico / Advanced Pico Beena platform included adaptive difficulty in some titles, altering problem sets based on previous player performance. Sega reports that over 3.4 million Pico consoles were sold globally during its lifetime.
Growing Smartphone and Internet Penetration
The rapid growth of smartphones and internet connectivity is fueling the adoption of smart toys worldwide. These devices act as primary interfaces, enabling seamless integration between toys, applications, and cloud-based learning platforms. Increased accessibility to affordable internet services allows wider consumer bases to use connected and app-driven toys. Parents also value the convenience of remote monitoring and content updates through smart devices. As smartphone ownership and digital ecosystems expand, the compatibility and versatility of smart toys become a critical factor driving market growth.
- For instance,TOSY UltraLED Flying Disc incorporates 360 LEDs across its rim, supports 6 brightness levels / timer modes, and is rechargeable via USB Type-C for repeated use.
Parental Focus on Child Development
Parents are increasingly prioritizing toys that contribute to overall child development, beyond traditional entertainment. Smart toys offering features such as emotion recognition, voice interaction, and adaptive learning attract attention for their ability to build social, emotional, and communication skills. The rising awareness of the importance of early childhood development further boosts demand for toys that combine play with learning outcomes. As parents look for solutions that balance fun with educational value, smart toys offering measurable developmental benefits emerge as strong drivers of sustained market adoption.
Key Trends & Opportunities
Integration of Artificial Intelligence
Artificial intelligence is transforming smart toys by enabling real-time personalization, interactive communication, and adaptive responses. AI-driven toys analyze user behavior and learning patterns, offering customized activities that evolve with the child’s growth. These advancements not only increase engagement but also provide parents with valuable insights into developmental progress. Companies are investing heavily in AI algorithms to differentiate products and capture consumer trust. As AI becomes more sophisticated, opportunities will emerge for creating advanced, emotionally intelligent toys with stronger learning outcomes and deeper interactive experiences.
- For instance, one Playmobil set—the USS Enterprise NCC-1701 (42-inch length, 150 pieces)—features a smart-device command app that connects via Bluetooth to control lights and sounds. The set can be powered by 3x AAA batteries or via its USB Type-C port.
Expansion of E-commerce Channels
E-commerce continues to reshape the sales landscape for smart toys, offering broader reach and higher accessibility. Online platforms provide parents with extensive product comparisons, bundled offers, and discounts, making them the preferred purchase channel. Integration of augmented reality for virtual product trials and AI-driven recommendation systems further enhances consumer experiences. As leading e-commerce platforms expand into emerging economies, opportunities to tap underserved markets grow significantly. This trend strengthens the dominance of digital distribution and opens avenues for manufacturers to diversify their online strategies.
- For instance, Pillar Learning builds interactive educational toys blending AI with storytelling and early learning. Their flagship device Codi supports over 200 songs, 200 stories, and 200 lessons via onboard content.
Key Challenges
High Product Costs and Affordability Issues
Smart toys often come with advanced sensors, connectivity features, and AI-driven capabilities, raising production costs. These higher prices limit accessibility for middle- and low-income households, especially in developing regions. Affordability challenges also restrict large-scale adoption in schools and community programs that could otherwise benefit from interactive learning solutions. While premium consumers sustain demand, broader market penetration requires innovation in cost optimization and scalable production. Addressing price sensitivity remains a pressing challenge for manufacturers aiming to expand reach beyond affluent segments.
Data Privacy and Security Concerns
The collection of user data, voice inputs, and behavioral analytics by smart toys raises significant privacy concerns. Parents are increasingly cautious about data breaches, unauthorized tracking, and misuse of sensitive information involving children. Stringent regulations, such as GDPR and COPPA, put additional pressure on manufacturers to ensure compliance and safeguard user data. Failure to address security vulnerabilities can damage brand reputation and consumer trust. Developing secure, transparent, and compliant systems remains a major challenge for companies striving to balance interactivity with user safety.
Regional Analysis
North America
North America leads the smart toys market with a 36% share, supported by strong consumer spending and advanced digital infrastructure. The region benefits from high adoption of educational technology, rising awareness of child development tools, and established distribution networks through both retail and e-commerce. The United States dominates demand, driven by innovation from leading toy manufacturers and strong parental inclination toward interactive learning solutions. Canada contributes steadily with government-backed early childhood programs promoting educational toys. The presence of global brands and early integration of AI and robotics further strengthen North America’s leadership in this market.
Europe
Europe accounts for 28% of the smart toys market, reflecting widespread adoption across technologically advanced economies. Countries such as Germany, the UK, and France drive demand, supported by high awareness of STEM education and regulatory emphasis on safe, child-friendly connected devices. Strong retail networks and growing online sales enhance market accessibility across the region. European parents increasingly value eco-friendly smart toys, creating opportunities for sustainable product development. Rising integration of digital education into school curriculums further boosts adoption. Europe’s focus on innovation, coupled with consumer preference for quality and safety, positions it as a strong growth hub.
Asia Pacific
Asia Pacific holds a 24% market share and is the fastest-growing region, driven by rapid digital adoption and expanding middle-class populations. China leads with robust manufacturing capabilities and growing demand for AI-powered learning toys. Japan and South Korea contribute with advanced robotics and strong investments in child-focused technology. India and Southeast Asian nations present rising opportunities as internet penetration and e-commerce adoption accelerate. The region’s expanding emphasis on early childhood development, combined with government-backed digital learning initiatives, supports sustained growth. Increasing affordability and rising smartphone penetration further establish Asia Pacific as a dynamic market for smart toys.
Latin America
Latin America represents a 7% share of the smart toys market, with Brazil and Mexico driving regional demand. Rising internet connectivity and expanding smartphone penetration support adoption of connected learning solutions. Middle-class families increasingly seek interactive toys that blend education with entertainment, boosting sales through online platforms. However, affordability challenges remain a barrier, with high costs restricting access among lower-income households. E-commerce expansion and international brand entry create new opportunities for manufacturers to expand reach. Government initiatives promoting digital literacy and early learning are also likely to enhance adoption across Latin America in the coming years.
Middle East & Africa
The Middle East & Africa hold a 5% share in the global smart toys market, characterized by gradual adoption and emerging opportunities. Wealthier economies such as the UAE and Saudi Arabia drive growth through high consumer spending and strong retail presence. South Africa leads demand in Africa, supported by rising internet access and growing middle-class interest in interactive learning products. Despite challenges of affordability and limited digital infrastructure in several countries, increasing government focus on education and expansion of e-commerce platforms are expected to improve market penetration. The region presents long-term opportunities for global toy manufacturers.
Market Segmentations:
By Interfacing Device:
- Smartphone-Connected
- Tablet-Connected
By Technology:
By Distribution Channel:
By Geography
- North America
- Europe
- UK
- France
- Germany
- Italy
- Spain
- Russia
- Belgium
- Netherlands
- Austria
- Sweden
- Poland
- Denmark
- Switzerland
- Rest of Europe
- Asia Pacific
- China
- Japan
- South Korea
- India
- Australia
- Thailand
- Indonesia
- Vietnam
- Malaysia
- Philippines
- Taiwan
- Rest of Asia Pacific
- Latin America
- Brazil
- Argentina
- Peru
- Chile
- Colombia
- Rest of Latin America
- Middle East
- UAE
- KSA
- Israel
- Turkey
- Iran
- Rest of Middle East
- Africa
- Egypt
- Nigeria
- Algeria
- Morocco
- Rest of Africa
Competitive Landscape
The competitive landscape of the smart toys market is shaped by key players including Doctor’s Associates Inc., LeapFrog Enterprises Inc., Lego System A/S, Sega Toys Co. Ltd., Hasbro Inc., Robofi LLC, Mattel Inc., Playmobil, Tomy Co. Ltd., and Pillar Learning. The competitive landscape of the smart toys market is characterized by strong innovation, technological integration, and evolving consumer preferences. Companies in this space focus on combining traditional play concepts with advanced features such as AI, robotics, voice recognition, and app connectivity to enhance engagement and learning outcomes. Strategic emphasis is placed on developing STEM-focused products, interactive designs, and safe digital ecosystems to appeal to both parents and children. Growing e-commerce penetration and digital-first retail strategies have intensified competition, with brands leveraging online platforms for broader reach. Continuous R&D investments, collaborations with tech providers, and sustainability-driven initiatives further define the market, ensuring that smart toys remain at the intersection of entertainment, education, and digital transformation.
Shape Your Report to Specific Countries or Regions & Enjoy 30% Off!
Key Player Analysis
- Doctor’s Associates Inc.
- LeapFrog Enterprises Inc.
- Lego System A/S
- Sega Toys Co. Ltd.
- Hasbro Inc.
- Robofi LLC
- Mattel Inc.
- Playmobil
- Tomy Co. Ltd.
- Pillar Learning
Recent Developments
- In June 2025, Mattel launched a series of AI-powered educational toys under the Fisher-Price brand. These toys are designed to adapt to the learning pace of children, offering personalized educational content.
- In February 2024, Sega Toys launched KIMIT Ragdoll, a cat-like robot pet that uses AI technology to act like a real cat. It was developed in collaboration with Elephant Robotics, an industrial robot manufacturer. The robot cat has cat-like movements, such as wagging its tail and looking up in response to sound.
- In June 2023, Hasbro launched the Furby interactive toy, a highly engaging companion with five voice-activated modes and over 600 responses, including lights, sounds, and ten distinct songs. Furby reacts to gestures, such as hugs and pats. Children can nurture Furby by providing virtual food, styling its furhawk, and enhancing its appearance with the included clip-on beads and fashionable accessories.
- In June 2023, PunToon Kids, a popular children’s YouTube channel, launched a direct-to-consumer line of educational toys. This new range includes interactive kits and toys aimed at children up to seven years old, emphasizing safe, high-quality materials.
Report Coverage
The research report offers an in-depth analysis based on Interfacing Device, Technology, Distribution Channel and Geography. It details leading market players, providing an overview of their business, product offerings, investments, revenue streams, and key applications. Additionally, the report includes insights into the competitive environment, SWOT analysis, current market trends, as well as the primary drivers and constraints. Furthermore, it discusses various factors that have driven market expansion in recent years. The report also explores market dynamics, regulatory scenarios, and technological advancements that are shaping the industry. It assesses the impact of external factors and global economic changes on market growth. Lastly, it provides strategic recommendations for new entrants and established companies to navigate the complexities of the market.
Future Outlook
- The market will see wider adoption of AI-powered smart toys for personalized learning.
- E-commerce will remain the dominant sales channel, supported by digital-first retail strategies.
- STEM-focused smart toys will gain strong demand as education systems embrace digital learning.
- Integration of AR and VR technologies will enhance immersive play experiences.
- Manufacturers will expand into emerging economies driven by rising internet and smartphone penetration.
- Data privacy and security compliance will remain central to product development strategies.
- Sustainable and eco-friendly smart toys will grow in popularity among environmentally conscious consumers.
- Partnerships with tech firms will accelerate innovation in interactive and adaptive toys.
- Home-based learning will boost demand for educational smart toys among parents.
- Continuous R&D investment will drive product differentiation and strengthen global competitiveness.


