
Market Overviews
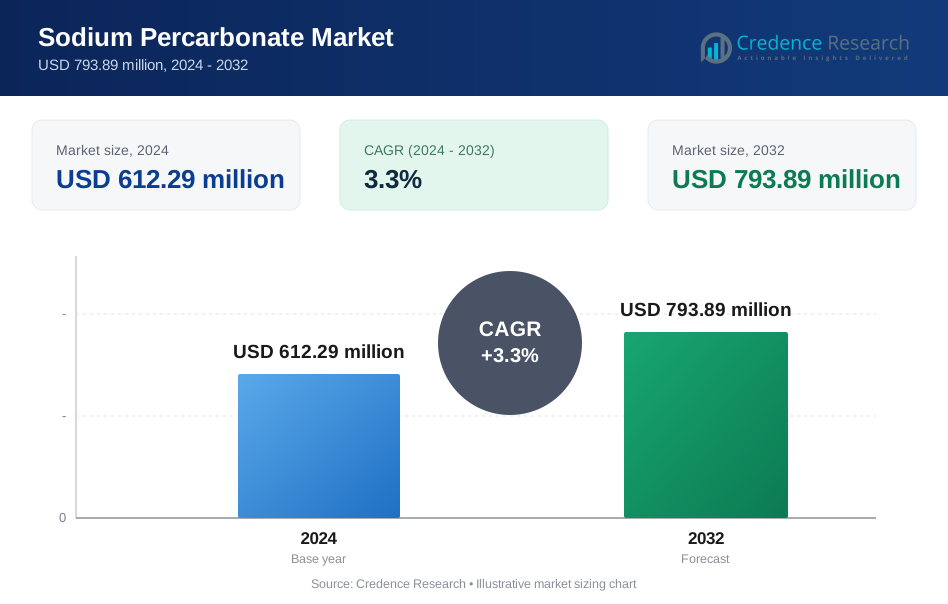
Sodium Percarbonate Market was valued at USD 612.29 million in 2024 and is anticipated to reach USD 793.89 million by 2032, growing at a CAGR of 3.3 % during the forecast period.
| REPORT ATTRIBUTE | DETAILS |
|---|---|
| Historical Period | 2020-2023 |
| Base Year | 2024 |
| Forecast Period | 2025-2032 |
| Sodium Percarbonate Market Size 2024 | USD 612.29 Million |
| Sodium Percarbonate Market, CAGR | 3.3 % |
| Sodium Percarbonate Market Size 2032 | USD 793.89 Million |
The Sodium Percarbonate Market is characterized by strong competition among global and regional manufacturers focusing on innovation, capacity expansion, and sustainability. Leading companies include Solvay AG, Hodogaya Chemical Co., Ltd., HOGYE HOLDING GROUP CORPORATION LIMITED, Evonik Industries AG, JINKE Company Limited, Wuxi Wanma Chemical Co., Ltd., OCI Peroxygens LLC, Kemira Khimprom, and Jiangxi Boholy Chemicals Co., Ltd. These players invest in advanced coating technologies to enhance product stability and shelf life, catering to industrial and household cleaning applications. Strategic alliances, eco-certifications, and production efficiency remain central to maintaining market presence. North America dominates the global Sodium Percarbonate Market with a 34.56% share, supported by strong detergent and water treatment demand, while Europe follows with 30%, driven by strict environmental regulations and sustainable manufacturing initiatives.
Market Insights
- The Sodium Percarbonate Market was valued at USD 612.29 million in 2024 and is projected to reach USD 793.89 million by 2032, growing at a CAGR of 3.3% during the forecast period.
- Rising demand for eco-friendly and chlorine-free cleaning agents drives market growth, supported by increasing use in detergents, textile processing, and water treatment applications.
- Technological advancements in coated formulations enhance product stability, promoting adoption in automatic washing and industrial cleaning systems.
- The market features strong competition among major players such as Solvay AG, Evonik Industries AG, and Hodogaya Chemical Co., Ltd., focusing on sustainable production and regional expansion.
- North America leads with a 34.56% market share, followed by Europe at 30%, while coated sodium percarbonate dominates the type segment due to superior moisture resistance and extended shelf life.
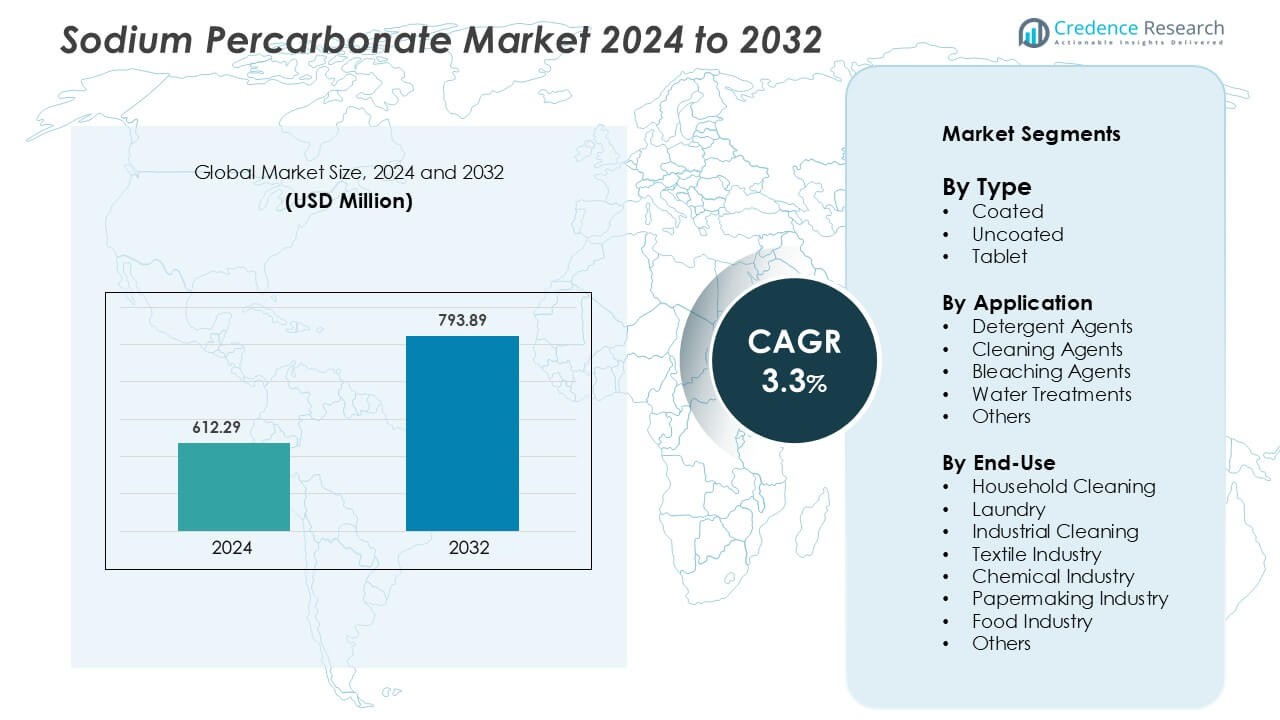
Market Segmentation Analysis:
By Type
The coated segment dominates the Sodium Percarbonate Market with the largest share. Coated variants provide enhanced stability and moisture resistance, making them suitable for long-term storage and use in humid conditions. Their protective layer prevents premature decomposition, improving shelf life and performance in detergents and cleaning formulations. The uncoated type serves cost-sensitive applications, while tablets cater to compact and controlled dosing requirements. Demand for coated sodium percarbonate continues to rise due to its superior durability and compatibility with modern washing machines and automatic cleaning systems.
- For instance, Solvay S.A. markets its Oxyper SHC grade (a granular coated sodium percarbonate) with a solubility of 150 g per litre at 20 °C and pH around 10.4 in a 1 % solution.
By Application
Detergent agents hold the dominant market share in the application segment, driven by their extensive use in household and industrial cleaning products. Sodium percarbonate’s strong oxygen-releasing properties make it a preferred eco-friendly bleaching and cleaning additive. Cleaning agents and bleaching agents follow closely, supported by growth in hygiene and surface disinfection products. Its use in water treatment systems is increasing due to effective organic contaminant removal. The rising preference for sustainable cleaning formulations drives further adoption in multiple application areas.
- For instance, a supplier specification lists a bulk density of 800-1 050 g/L and a pH of 10.0-11.0 in a 3 % solution of sodium percarbonate granules used in disinfectant laundry blends.
By End-Use
Household cleaning leads the end-use segment, accounting for the largest market share. Increasing consumer preference for environmentally friendly and non-chlorine-based cleaning products supports sodium percarbonate’s prominence. Laundry and industrial cleaning sectors also show strong demand due to its high bleaching efficiency and safety profile. The textile and paper industries benefit from its use in color stabilization and fiber whitening. Expanding applications in the food and chemical industries highlight sodium percarbonate’s versatility as a safe oxidizing agent across diverse industrial processes.
Key Growth Drivers
Rising Demand for Eco-Friendly Cleaning Products
Growing consumer awareness of sustainable cleaning solutions is driving sodium percarbonate adoption. As a chlorine-free bleaching and oxidizing agent, it decomposes into water, oxygen, and soda ash—making it an environmentally safe alternative to traditional bleach. The rise in green household and industrial cleaning products fuels its demand across detergents, surface cleaners, and personal care formulations. Major detergent manufacturers are reformulating products using sodium percarbonate to meet eco-label standards and government regulations promoting biodegradable ingredients. This shift toward sustainability continues to strengthen its market position globally.
- For instance, one patent (EP0759969A1) describes a detergent powder composition where sodium percarbonate is stabilized using a cogranulate blend; the stabilizer water-to-silicate mass ratio is specified as 33:100 to 120:100 for enhanced stability.
Expanding Applications in Industrial and Textile Sectors
The industrial and textile sectors are key contributors to sodium percarbonate market growth. In textile processing, it acts as an effective bleaching and desizing agent, replacing harmful chlorine-based chemicals. Industrial cleaning applications benefit from its strong oxidizing properties and safety profile, especially in food and beverage facilities. Moreover, increasing automation in textile production demands efficient, residue-free bleaching agents compatible with modern equipment. The chemical’s versatility and cost efficiency enhance its appeal across paper, pulp, and water treatment industries, ensuring steady market expansion.
- For instance, the STPP Group specification confirms suitability in water-treatment contexts by listing the molecular formula of sodium percarbonate as 2Na₂CO₃·3H₂O₂ and noting it decomposes into soda ash, hydrogen peroxide and oxygen gas, making it compatible with pulp bleaching and wastewater systems.
Regulatory Support for Sustainable Chemical Substitutes
Governmental policies promoting low-toxicity and biodegradable chemicals support the sodium percarbonate market. Stringent environmental regulations in regions like Europe and North America are driving manufacturers to replace traditional chlorine-based agents. Agencies such as the U.S. Environmental Protection Agency (EPA) and the European Chemicals Agency (ECHA) classify sodium percarbonate as a safe oxygen bleach, encouraging its use in household and industrial formulations. The ongoing regulatory shift towards circular economy practices further enhances its adoption across consumer and industrial applications. These favorable standards reinforce its long-term market potential.
- For instance, Evonik Industries highlights that its stabilized coated sodium percarbonate product offers improved storage stability, pourability and bulk density, making it suitable for compact detergents with cold-water wash at 12% active oxygen content.
Key Trends & Opportunities
Growth of Compact and Tablet-Based Formulations
The trend toward compact and easy-to-use cleaning products is creating strong opportunities for sodium percarbonate tablets. Tablet forms offer controlled dosage, easy handling, and reduced packaging waste, aligning with sustainability goals. Manufacturers are developing slow-dissolving coatings to ensure consistent oxygen release and enhanced cleaning efficiency. This trend is particularly notable in automatic dishwashing, laundry capsules, and industrial sanitation products. As consumers prioritize convenience and eco-friendly formulations, tablet-based sodium percarbonate products are expected to capture increasing market share globally.
- For instance, a study by L Xing et al. coated sodium percarbonate particles with a 2.35 R sodium silicate shell at a coating/core ratio of 53 wt.% and achieved a dissolution delay of approximately 7 minutes compared to uncoated particles.
Rising Adoption in Water and Wastewater Treatment
Sodium percarbonate’s use in water treatment is expanding due to its powerful oxidation capacity and minimal residue. It effectively removes organic pollutants, algae, and odor-causing compounds without harmful by-products. Municipal and industrial wastewater facilities are adopting this compound as a safer, more sustainable alternative to chlorine. Its compatibility with advanced oxidation processes enhances treatment efficiency in large-scale systems. Growing concerns over water quality and tighter discharge standards are expected to fuel significant opportunities for sodium percarbonate in environmental management applications.
Technological Advancements in Coated Formulations
Innovations in coated sodium percarbonate technology are enhancing product stability and performance. Advanced coatings prevent moisture absorption, extend shelf life, and enable controlled oxygen release during storage and application. Manufacturers are investing in polymer and silica-based coating systems that ensure product integrity even in high-humidity environments. These advancements improve compatibility with enzyme-based detergents and automatic washing machines. As research focuses on improving particle stability and reducing degradation rates, coated formulations will continue to dominate premium cleaning and bleaching applications.
Key Challenges
Sensitivity to Moisture and Temperature
Sodium percarbonate’s high reactivity poses storage and handling challenges. The compound decomposes when exposed to moisture or elevated temperatures, leading to oxygen release and reduced effectiveness. Maintaining stability requires specialized packaging and controlled environmental conditions during transport and storage. These factors increase logistical costs for manufacturers and distributors. In humid regions, degradation risks remain a major concern, limiting its shelf life in uncoated forms. Overcoming these stability issues is crucial to ensuring consistent performance and expanding global supply chains.
Competition from Alternative Bleaching Agents
The availability of alternative oxidizing agents such as hydrogen peroxide, sodium perborate, and peracetic acid challenges sodium percarbonate adoption. Many of these substitutes offer lower costs or higher solubility under certain processing conditions. Additionally, hydrogen peroxide-based systems already have established infrastructure and widespread industrial usage. The competition intensifies in applications like textile bleaching and water treatment, where performance efficiency and cost balance are key factors. To remain competitive, producers must invest in process innovation, coating improvements, and application-specific product differentiation.
Regional Analysis
North America
North America holds approximately 34.56% of the global sodium percarbonate market as of 2023. The region benefits from strong consumer demand for eco-friendly cleaning and bleaching agents, driven by stringent environmental regulation and a mature household cleaning market. The U.S. and Canada lead in adoption across laundry, surface cleaning and industrial uses. Established manufacturing infrastructure and innovation in coated sodium percarbonate variants further support the region’s dominance.
Europe
Europe accounts for around 30% of the global sodium percarbonate market share. The region’s growth is underpinned by vigorous regulatory frameworks (such as REACH) and strong demand for sustainable chemicals in detergents, textile processing and water treatment. Key markets include Germany, France and the U.K., where consumer preference for green cleaning products is high. Advances in product coating technologies and recycling initiatives further strengthen Europe’s position.
Asia-Pacific
Asia-Pacific commands roughly 25% of the global market share for sodium percarbonate. The region shows the fastest growth, supported by rapidly expanding detergent, textile and household cleaning sectors in China, India and Southeast Asia. Urbanisation, rising disposable income and increasing hygiene awareness drive demand. Local manufacturing and raw material availability also facilitate competitive pricing and supply scalability.
Latin America
Latin America accounts for approximately 5% of the global sodium percarbonate market share. Growth in the region stems from rising consumer interest in sustainable cleaning solutions and expanding industrial and textile sectors in Brazil and Mexico. However, market penetration remains limited due to less mature supply chains and lower per-capita consumption. Improvements in distribution infrastructure and green product awareness are expected to enhance future uptake.
Middle East & Africa
The Middle East & Africa region holds about 5% of the global sodium percarbonate market share. Growth is driven by increasing urbanisation, improving hygiene standards and rising demand for sustainable water treatment and cleaning agents in Gulf countries and South Africa. Nonetheless, the region faces barriers from limited local production and high import dependency. Infrastructure investments and regulatory shifts toward eco-friendly chemicals could accelerate expansion.
Market Segmentations
By Type
- Coated
- Uncoated
- Tablet
By Application
- Detergent Agents
- Cleaning Agents
- Bleaching Agents
- Water Treatments
- Others
By End-Use
- Household Cleaning
- Laundry
- Industrial Cleaning
- Textile Industry
- Chemical Industry
- Papermaking Industry
- Food Industry
- Others
By Geography
- North America
- U.S.
- Canada
- Mexico
- Europe
- Germany
- France
- U.K.
- Italy
- Spain
- Rest of Europe
- Asia Pacific
- China
- Japan
- India
- South Korea
- South-east Asia
- Rest of Asia Pacific
- Latin America
- Brazil
- Argentina
- Rest of Latin America
- Middle East & Africa
- GCC Countries
- South Africa
- Rest of the Middle East and Africa
Competitive Landscape
The sodium percarbonate market is moderately consolidated, with leading companies emphasizing product stability, eco-friendly formulations, and large-scale production efficiency. Solvay AG and Evonik Industries AG dominate through advanced manufacturing processes that enhance oxygen yield and improve detergent performance. OCI Peroxygens LLC and Kemira Khimprom strengthen their market position with high-purity grades tailored for industrial cleaning, pulp bleaching, and water treatment applications. Asian manufacturers such as JINKE Company Limited, Wuxi Wanma Chemical Co., Ltd., and Jiangxi Boholy Chemicals Co., Ltd. focus on cost-effective mass production and expanding exports to Europe and North America. Hodogaya Chemical Co., Ltd. and HOGYE HOLDING GROUP CORPORATION LIMITED invest in innovation for stable coating technologies that extend shelf life and minimize dust formation. Companies are increasingly prioritizing automation, closed-loop production systems, and green chemistry practices to improve operational sustainability and comply with stringent environmental and safety regulations across global markets.
Key Player Analysis
- Solvay AG
- Hodogaya Chemical Co., Ltd.
- HOGYE HOLDING GROUP CORPORATION LIMITED
- Evonik Industries AG
- JINKE Company Limited
- Wuxi Wanma Chemical Co., Ltd.
- OCI Peroxygens LLC
- Kemira Khimprom
- Jiangxi Boholy Chemicals Co., Ltd.
Recent Developments
- In 2024, Solvay SA Belgium, launched a new line of high-stability coated sodium percarbonate products targeted at humid markets in Southeast Asia.
- In 2023, OCI Company Ltd. expanded sodium percarbonate production capacity by 80,000 tons annually to meet rising detergent demand in Asia.
- In June 2022, TATA Chemicals Ltd. will open its biggest Carbon Capture Facility in the United Kingdom in June 2022. This facility will absorb carbon dioxide (CO2) from the environment and eventually be able to produce sodium goods like Sodium Percarbonate, having a minimally feasible carbon footprint.
Report Coverage
The research report offers an in-depth analysis based on Type, Application, End-Use and Geography. It details leading market players, providing an overview of their business, product offerings, investments, revenue streams, and key applications. Additionally, the report includes insights into the competitive environment, SWOT analysis, current market trends, as well as the primary drivers and constraints. Furthermore, it discusses various factors that have driven market expansion in recent years. The report also explores market dynamics, regulatory scenarios, and technological advancements that are shaping the industry. It assesses the impact of external factors and global economic changes on market growth. Lastly, it provides strategic recommendations for new entrants and established companies to navigate the complexities of the market.
Future Outlook
- Growing consumer demand for eco-friendly and chlorine-free cleaning products will drive sustained market expansion.
- Technological advancements in coated formulations will enhance product stability and extend shelf life.
- Increasing adoption of tablet-based sodium percarbonate will support compact and convenient cleaning solutions.
- Rising application in water and wastewater treatment will strengthen industrial demand across emerging economies.
- Expansion of the textile and paper industries will boost consumption of sodium percarbonate as a bleaching agent.
- Regulatory support for sustainable chemicals will encourage replacement of chlorine-based oxidizers.
- Partnerships between detergent manufacturers and chemical producers will foster product innovation and efficiency.
- Growth in e-commerce and private-label cleaning products will widen distribution channels.
- Continued R&D investment will improve moisture resistance and oxygen release efficiency in advanced formulations.
- Increasing global emphasis on circular economy practices will promote long-term market sustainability.
Request a Free Sample
Fill in your details and we'll send you a free sample report.
- Sample data tables & charts
- Research methodology
Need a Custom Version of This Report?
Tailor the scope, geography, or segments to your exact requirements.
- Custom geography or segment scope
- Direct access to our analyst team
Frequently Asked Questions
What is the current market size for the Sodium Percarbonate Market, and what is its projected size in 2032?
At what Compound Annual Growth Rate is the Sodium Percarbonate Market projected to grow between 2025 and 2032?
Which Sodium Percarbonate Market segment held the largest share in 2024?
What are the primary factors fueling the growth of the Sodium Percarbonate Market?
Who are the leading companies in the Sodium Percarbonate Market?
Which region commanded the largest share of the Sodium Percarbonate Market in 2024?
Table of Content
Chapter 1. Report Introduction
- 1.1 Report Description & Purpose
- 1.1.1 Report Title & Market Definition
- 1.1.2 Unique Selling Propositions (USP) & Key Differentiators
- 1.1.3 Value Proposition for Stakeholders
- 1.2 Research Objectives
- 1.2.1 Market Sizing Objectives (Volume & Revenue)
- 1.2.2 Segmentation Objectives
- 1.2.3 Competitive Intelligence Objectives
- 1.2.4 Forecast & Scenario Objectives
- 1.3 Report Scope
- 1.3.1 Sodium Percarbonate Scope – Types & Subtypes Covered
- 1.3.2 Geographic Scope – Regions & Countries Covered
- 1.3.3 Historical Period, Base Year & Forecast Period (2024; forecast to 2032)
- 1.3.4 Inclusions & Exclusions
- 1.4 HS Code & Classification Framework
- 1.5 Currency, Units & Pricing Basis
- 1.6 Target Stakeholders
- 1.7 Limitations & Assumptions
Chapter 2. Executive Summary
- 2.1 Global Sodium Percarbonate Market Snapshot
- 2.1.1 Market Size – Historical (2024) & Forecast (2024-2032) (2024: USD 612.29 million → 2032: USD 793.89 million)
- 2.1.2 Volume & Revenue – Global Totals
- 2.1.3 Key Market Highlights – Top Five Facts
- 2.2 Sodium Percarbonate Market Segmentation Snapshot
- 2.2.1 Market Split by Region – 2024 vs. 2032
- 2.3 Competitive Snapshot
- 2.3.1 Top 10 Players by Revenue Share – 2024
- 2.3.2 Top 10 Players by Volume Share – 2024
- 2.3.3 Recent Strategic Developments (18-Month Summary)
- 2.4 Key Investment Highlights & Strategic Conclusions
Chapter 3. Sodium Percarbonate Market Dynamics & Industry Analysis
- 3.1 Market Overview & Context
- 3.1.1 Sodium Percarbonate Market Position in the Broader Automotive Value Chain
- 3.1.2 OEM vs. Replacement Market Dynamics
- 3.1.3 Market Maturity & Development Stage by Region
- 3.2 Sodium Percarbonate Market Drivers
- 3.3 Sodium Percarbonate Market Restraints & Challenges
- 3.4 Sodium Percarbonate Market Opportunities
- 3.5 Porter's Five Forces Analysis
- 3.5.1 Threat of New Entrants
- 3.5.2 Bargaining Power of Suppliers
- 3.5.3 Bargaining Power of Buyers
- 3.5.4 Threat of Substitutes
- 3.5.5 Competitive Rivalry – Intensity Assessment
- 3.6 Sodium Percarbonate Value Chain Analysis
- 3.6.1 Upstream – Raw Material/Input Suppliers
- 3.6.1.1 Raw Material/Input 1
- 3.6.1.2 Raw Material/Input 2
- 3.6.1.3 Raw Material/Input 3
- 3.6.2 Midstream – Production/Manufacturing/Service Delivery
- 3.6.2.1 Production/Process Overview
- 3.6.2.2 Key Facility Locations & Capacity by Manufacturer
- 3.6.3 Downstream – Distribution & End Consumer
- 3.6.3.1 Primary Channel – B2B/OEM
- 3.6.3.2 Secondary Channels – Dealer, Retail, Online, Direct
- 3.6.4 Value Chain Profitability Analysis
- 3.6.1 Upstream – Raw Material/Input Suppliers
- 3.7 PESTEL Analysis
- 3.7.1 Political Factors
- 3.7.2 Economic Factors
- 3.7.3 Social Factors
- 3.7.4 Technological Factors
- 3.7.5 Environmental Factors
- 3.7.6 Legal Factors
- 3.8 Sodium Percarbonate Supply Chain Analysis
- 3.8.1 Raw Material/Input Supply Risk Assessment
- 3.8.2 Manufacturing Concentration Risk (Geographic Exposure)
- 3.8.3 Trade Disruption Impact Analysis
- 3.9 Regulatory & Policy Landscape
Note: The regulatory and policy landscape section covers regulations based on their applicability to the market, Sodium Percarbonate category, geography, and scope of the study. Only regulatory frameworks with a material impact on operations, compliance, trade, sustainability, or market access are analyzed in detail.
Chapter 4. Key Investment Pockets & Opportunity Analysis
- 4.1 Sodium Percarbonate Market Attractiveness Analysis
- 4.1.1 By Region – Investment Attractiveness Matrix (Volume × CAGR)
- 4.2 Absolute Revenue Growth Opportunity
- 4.2.1 By Region – Absolute USD Growth Through 2032
- 4.3 Incremental Volume Opportunity
- 4.3.1 By Region – Incremental Volume Through 2032
- 4.3.2 Segment – Incremental Volume
- 4.4 Emerging Submarket Opportunity Deep Dive (Subject to Applicability)
- 4.5 Emerging Market Opportunity Scorecards
- 4.5.1 United States
- 4.5.2 Europe
- 4.5.3 Asia
- 4.5.4 Middle East & Africa
Note: Emerging Market Opportunity Scorecards will be included based on relevance and strategic importance. Regions listed are indicative and may vary depending on data availability and market dynamics.
Chapter 5. Sodium Percarbonate Import-Export Analysis & Trade Flows
- 5.1 Global Trade Overview
- 5.1.1 Global Export Value by Country (2024)
- 5.1.2 Global Export Volume by Country (2024)
- 5.1.3 Global Import Value by Country (2024)
- 5.1.4 Global Import Volume by Country (2024)
- 5.1.5 Net Trade Balance by Country (2024)
- 5.2 Export Analysis – Segment
- 5.2.1 Type 1 (HS Code)
- 5.2.2 Type 2 (HS Code)
- 5.2.3 Type 3 (HS Code)
- 5.2.4 Type 4 (HS Code)
- 5.2.5 Type 5 (HS Code)
- 5.3 Import Analysis – Segment
- 5.3.1 Type 1 (HS Code)
- 5.3.2 Type 2 (HS Code)
- 5.3.3 Type 3 (HS Code)
- 5.3.4 Type 4 (HS Code)
- 5.3.5 Type 5 (HS Code)
- 5.4 Average Unit Trade Prices
- 5.4.1 Average Export Price – Segment & Country
- 5.4.2 Average Import Price – Segment & Source Country
- 5.4.3 Price Trends (2024)
- 5.5 Key Trade Route Analysis
- 5.5.1 Trade Route 1
- 5.5.2 Trade Route 2
- 5.5.3 Trade Route 3
- 5.5.4 Trade Route 4
- 5.5.5 Trade Route 5
- 5.6 Trade Policy Impact Assessment
- 5.6.1 US Anti-Dumping & Section 301 Tariffs
- 5.6.2 EU Customs Union Impact
- 5.6.3 Major Free Trade Agreements
- 5.6.4 USMCA Rules of Origin
Note: Trade policy analysis will be included only where relevant to the Sodium Percarbonate market.
Chapter 6. Competitive Landscape & Company Benchmarking
- 6.1 Sodium Percarbonate Market Concentration & Structure
- 6.1.1 Herfindahl-Hirschman Index (HHI) – vs. 2024
- 6.1.2 Tier 1, Tier 2 & Tier 3 Market Structure
- 6.1.3 Global, Regional & Local Player Dynamics
- 6.2 Sodium Percarbonate Market Share Analysis – 2024
- 6.2.1 Global Revenue Share by Company
- 6.2.2 Global Volume Share by Company
- 6.2.3 Regional Revenue Share
- 6.2.4 Market Share Evolution ( vs. 2024)
- 6.2.5 OEM Segment Share by Company
- 6.2.6 Replacement Segment Share by Company
- 6.3 Production/Delivery Capacity & Facility Analysis
- 6.3.1 Global Installed Capacity
- 6.3.2 Capacity Utilization Rates
- 6.3.3 Production/Output Volume
- 6.3.4 Facility Locations & Capacity Map
- 6.3.5 Planned Capacity Additions
- 6.4 Sodium Percarbonate Competitive Benchmarking Matrix
- 6.4.1 Revenue, Volume, CAGR & Profitability Comparison
- 6.4.2 Channel Revenue Mix
- 6.4.3 Geographic Revenue Exposure
- 6.4.4 R&D Intensity
- 6.4.5 Sustainability Maturity
- 6.5 Strategic Developments in Sodium Percarbonate (Last 24 Months)
- 6.5.1 Mergers, Acquisitions & Divestments
- 6.5.2 New Sodium Percarbonate Launches
- 6.5.3 Facility Expansions
- 6.5.4 Strategic Alliances, Joint Ventures & Partnerships
- 6.5.5 Distribution Expansion & Market Entry
- 6.5.6 Sustainability & ESG Initiatives
- 6.6 Competitive Strategy Mapping
- 6.6.1 Leader, Challenger, Follower & Niche Classification
- 6.6.2 Pricing Strategy Comparison
- 6.6.3 Channel Strategy Matrix
Note: Strategic developments are included based on their materiality and the availability of reliable information.
Chapter 7. Global Sodium Percarbonate Market – By Distribution Channel
- 7.1 Segment Overview
- 7.1.1 Volume & Revenue Split by Channel (2024 & 2032)
- 7.1.2 Channel Mix Evolution (2024-2032)
Chapter 8. Regional Market Analysis – Global Overview
- 8.1 Global Regional Overview
- 8.1.1 Regional Volume Share
- 8.1.2 Regional Revenue Share
- 8.1.3 Regional Volume by Region
- 8.1.4 Regional Revenue by Region
- 8.1.5 Regional Forecast Through 2032
- 8.2 Cross-Regional Segment Analysis
- 8.2.1 By Distribution Channel
- 8.2.2 By Brand/Price Tier
Chapter 9. North America Sodium Percarbonate Market
- 9.1 United States
- 9.2 Canada
- 9.3 Mexico
Chapter 10. Europe Sodium Percarbonate Market
- 10.1 Germany
- 10.2 France
- 10.3 Italy
- 10.4 United Kingdom
- 10.5 Spain
- 10.6 Poland
- 10.7 Russia
- 10.8 Netherlands
- 10.9 Belgium
- 10.10 Sweden
- 10.11 Denmark
- 10.12 Norway
- 10.13 Rest of Europe
Chapter 11. Asia Pacific Sodium Percarbonate Market
- 11.1 China
- 11.2 India
- 11.3 Japan
- 11.4 South Korea
- 11.5 Thailand
- 11.6 Indonesia
- 11.7 Vietnam
- 11.8 Malaysia
- 11.9 Australia
- 11.10 Rest of Asia Pacific
Chapter 12. Latin America Sodium Percarbonate Market
- 12.1 Brazil
- 12.2 Argentina
- 12.3 Colombia
- 12.4 Chile
- 12.5 Rest of Latin America
Chapter 13. Middle East Sodium Percarbonate Market
- 13.1 Saudi Arabia
- 13.2 United Arab Emirates
- 13.3 Turkey
- 13.4 Israel
- 13.5 Iran
- 13.6 Rest of the Middle East
Chapter 14. Africa Sodium Percarbonate Market
- 14.1 South Africa
- 14.2 Egypt
- 14.3 Nigeria
- 14.4 Morocco
- 14.5 Rest of Africa
Chapter 15. Sodium Percarbonate Company Profiles
- 15.1 [Company 01]
- 15.1.1 Company Overview
- 15.1.2 Key Management Personnel
- 15.1.3 Products & Services Portfolio
- 15.1.4 Financial Performance
- 15.1.5 Key Market Focus & Geographic Presence
- 15.1.6 Recent Developments & Strategic Initiatives
Note: The company profile list is preliminary and may change based on research findings, market developments, data availability, and client requirements.
Chapter 16. Appendices
- Appendix A – List of Abbreviations & Acronyms
- Appendix B – Industry Classification Code Reference – Full Series
- Appendix C – Production & Capacity Data Tables
- Appendix D – End-Use & Demand Base Tables
- Appendix E – Consumption & Replacement Rate Assumptions
- Appendix F – ASP Reference Tables
- Appendix G – Manufacturing & Facility Database
- Appendix H – Import-Export Data Tables
- Appendix I – Regulatory Summary Tables
- Appendix J – Primary Research Participant List (Anonymized)
- Appendix K – Primary Research Questionnaire Framework
- Appendix L – Data Sources & Bibliography
- Appendix M – Market Size Divergence & Source Comparison
Chapter 17. Research Methodology
- 17.1 Research Framework & Philosophy
- 17.2 Secondary Research – Sources, Hierarchy & Data Extraction
- 17.3 Data Modeling – Bottom-Up & Top-Down Market Sizing
- 17.4 Primary Research – Stakeholder Framework, LOI & Sample Sizes
- 17.5 Forecast Methodology – Regression, Scenario & Sensitivity Analysis
- 17.6 Quality Control – Four-Layer Validation Framework
- 17.7 Limitations & Standard Assumptions
- 17.8 Disclaimer
