
Market Overview:
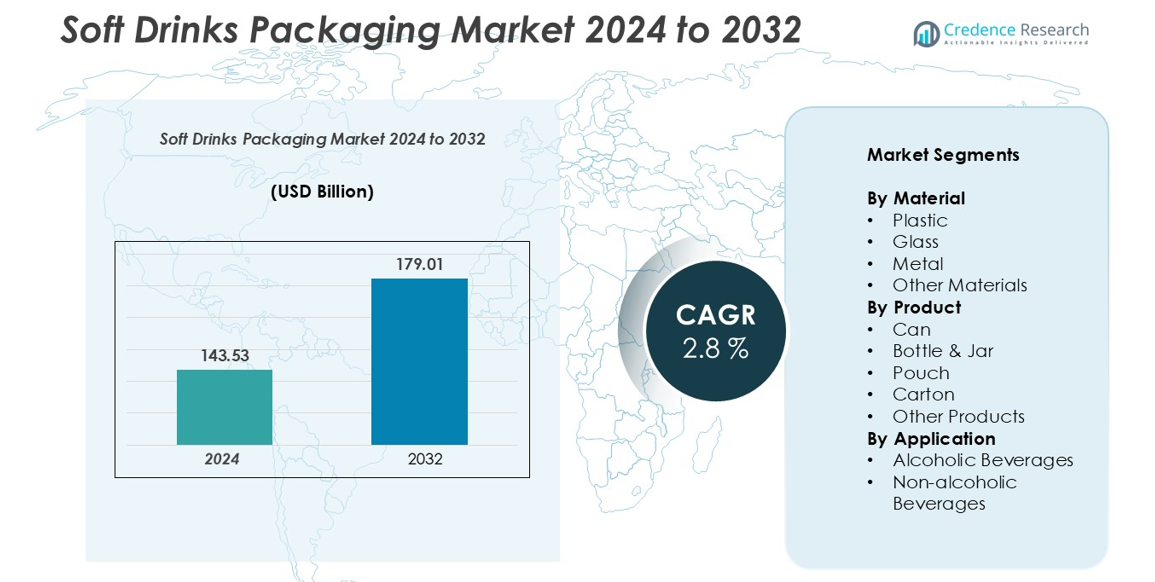
The Soft Drinks Packaging market size was valued at USD 143.53 billion in 2024 and is anticipated to reach USD 179.01 billion by 2032, at a CAGR of 2.8% during the forecast period.
| REPORT ATTRIBUTE | DETAILS |
|---|---|
| Historical Period | 2020-2023 |
| Base Year | 2024 |
| Forecast Period | 2025-2032 |
| Soft Drinks Packaging Market Size 2024 | USD 143.53 billion |
| Soft Drinks Packaging Market, CAGR | 2.8% |
| Soft Drinks Packaging Market Size 2032 | USD 179.01 billion |
The global soft drinks packaging market is led by major players such as Ball Corporation, WestRock Company, Berry Global Inc., Tetra Laval International S.A., Stora Enso, SIG, Crown, Graham Packaging, and Amber Packaging. These companies dominate through their broad product portfolios, global manufacturing presence, and focus on sustainable, high-performance packaging solutions. Technological innovation, lightweight designs, and recyclable materials remain central to their strategies. Asia-Pacific emerged as the leading regional market, accounting for approximately 35% of the global market share in 2024, driven by rapid urbanization, growing disposable incomes, and increased beverage consumption across emerging economies such as China, India, and Indonesia.
Market Insights
- The global soft drinks packaging market was valued at USD 143.53 billion in 2024 and is projected to reach USD 179.01 billion by 2032, registering a CAGR of 2.8% during the forecast period.
- Increasing demand for convenient, lightweight, and on-the-go beverage packaging is driving market growth, with plastic dominating the material segment due to its cost-effectiveness and versatility.
- Sustainability and smart packaging trends are reshaping the market, as manufacturers adopt recyclable PET bottles, aluminum cans, and interactive digital labels to enhance consumer engagement.
- Key players such as Ball Corporation, WestRock Company, Berry Global Inc., and Tetra Laval International S.A. are investing in eco-friendly innovations amid challenges like fluctuating raw material prices and strict environmental regulations.
- Regionally, Asia-Pacific leads with 35% market share, followed by North America (28%) and Europe (26%), driven by rising beverage consumption, advanced manufacturing infrastructure, and sustainability initiatives.
Market Segmentation Analysis:
By Material:
The soft drinks packaging market, by material, is dominated by plastic, which accounted for the largest market share in 2024. Plastic packaging remains the preferred choice due to its lightweight, durability, and cost-effectiveness, enabling efficient transportation and extended shelf life. The rising use of PET bottles for carbonated and non-carbonated drinks continues to boost demand. Additionally, ongoing innovations in recyclable and biodegradable plastics are enhancing sustainability. Glass and metal packaging maintain niche applications, particularly for premium beverages, while other materials, including paper-based composites, are gaining traction in eco-conscious markets.
- For instance, in 2021, Coca-Cola introduced 100% recycled PET (rPET) bottles for its 500 ml or smaller range in Great Britain, a move estimated to save 29,000 tons of virgin plastic annually.
By Product:
Based on product type, bottles and jars held the largest share of the soft drinks packaging market in 2024. The dominance of this segment stems from its widespread use in both carbonated and non-carbonated beverages, offering convenience, resealability, and strong brand visibility. Plastic PET bottles lead within this category, supported by advancements in lightweighting and recyclability. Cans also represent a significant portion, driven by growing demand for energy drinks and alcoholic beverages. Meanwhile, pouches and cartons are witnessing increased adoption in ready-to-drink (RTD) and on-the-go product segments due to their portability and reduced material usage.
- For instance, Amcor, a leader in lightweight packaging, has implemented advanced technologies like PowerPost and Quantum to create lighter PET bottle designs. Through these innovations, Amcor has helped its clients achieve substantial material reductions, with company case studies indicating savings of thousands of tons of resin annually across all its projects. Amcor has developed designs that have reduced the weight of its bottles by 35% to 50%
By Application:
In terms of application, the non-alcoholic beverages segment accounted for the major share of the soft drinks packaging market in 2024. This segment includes carbonated drinks, juices, flavored waters, and sports beverages, where packaging innovation focuses on convenience, freshness retention, and sustainability. The increasing consumption of functional and low-sugar drinks is spurring demand for flexible and recyclable packaging formats. Conversely, the alcoholic beverages segment, though smaller, is growing steadily with the rising popularity of canned cocktails and craft beers, prompting packaging companies to enhance design appeal and barrier properties.
Key Growth Drivers
Rising Demand for Convenient and On-the-Go Packaging
The growing consumer preference for ready-to-drink and portable beverage formats is driving demand for innovative soft drink packaging solutions. Urbanization, rising disposable incomes, and busy lifestyles have boosted the consumption of single-serve and lightweight packaging options such as PET bottles, pouches, and cans. Manufacturers are increasingly focusing on ergonomic designs and resealable packaging that enhance user convenience and product freshness. The demand for smaller pack sizes in travel-friendly and vending formats further supports this trend. Additionally, the rapid growth of e-commerce and quick-service restaurants (QSRs) has accelerated the need for durable, spill-resistant packaging materials that ensure product integrity during transport and delivery.
- For instance, in October 2023, The Coca-Cola Company launched new 100% recycled PET (rPET) bottles for its carbonated beverages in India, focusing on smaller packs, including 250 ml and 750 ml sizes, to cater to on-the-go consumers. This move aligns with the company's sustainability goals and follows the earlier launch of 1-litre rPET bottles for its Kinley water brand
Technological Advancements in Packaging Materials
Technological innovation in packaging materials is a major growth driver for the soft drinks packaging market. Companies are investing in advanced materials such as biodegradable plastics, lightweight aluminum, and recyclable glass to improve sustainability and reduce carbon footprints. Smart packaging technologies, including QR codes and digital labeling, are being integrated to enhance brand engagement and traceability. Moreover, barrier coatings and multi-layer films are gaining traction to extend shelf life and preserve beverage quality. These advancements are not only meeting regulatory and environmental standards but also offering manufacturers cost efficiencies through reduced material usage and improved production efficiency.
- For instance, Amcor developed its PowerPost™ PET bottle technology, which reduces material weight by up to 30% while maintaining the bottle's strength for hot-fill beverages. This allows beverage producers to achieve significant material and carbon savings compared to traditional designs.
Increasing Focus on Sustainable and Eco-Friendly Solutions
Sustainability has become a key focus area influencing consumer behavior and corporate strategies in the soft drinks packaging industry. Governments and environmental agencies are enforcing stricter regulations on plastic usage and waste management, prompting companies to shift toward recyclable, compostable, and reusable packaging. Brands like Coca-Cola and PepsiCo have committed to achieving 100% recyclable packaging in the coming years, reinforcing industry-wide sustainability initiatives. The demand for plant-based and bio-derived materials is also rising, driven by eco-conscious consumers. This transition not only aligns with global circular economy goals but also enhances brand reputation and customer loyalty in a competitive market.
Key Trends & Opportunities
Growth of Premium and Aesthetic Packaging Designs
The increasing consumer inclination toward premium beverages and differentiated brand experiences is fostering innovation in packaging design. Companies are emphasizing visual appeal, tactile finishes, and unique shapes to create strong shelf impact and brand recognition. Transparent packaging and minimalistic labeling are gaining popularity, highlighting product purity and quality. Additionally, the demand for limited-edition packaging and personalized labeling-supported by digital printing technologies-is creating new marketing opportunities. Premium glass bottles and aluminum cans with embossed logos or matte finishes are being adopted to attract consumers seeking quality and sophistication, particularly in the sparkling water and flavored drink categories.
- For instance, in celebration of its 160th anniversary, Perrier partnered with French designer Philippe Starck to create a limited-edition bottle, which was inspired by a Fresnel optical lens.
Expansion of Smart and Interactive Packaging Technologies
Smart packaging technologies are emerging as a significant opportunity in the soft drinks packaging market. Digital tools such as NFC tags, QR codes, and augmented reality (AR) labels are being integrated to engage consumers and enhance transparency. These technologies allow brands to share product origins, nutritional facts, and promotional content directly through mobile devices. Interactive packaging also facilitates anti-counterfeiting measures and strengthens supply chain traceability. Moreover, data-driven insights collected via connected packaging help companies analyze consumer behavior and tailor marketing campaigns. This convergence of technology and packaging is redefining brand communication and customer loyalty in the beverage industry.
- For instance, In Western Europe, Coca-Cola has used both consumer-facing QR codes and invisible digital watermarks from EVRYTHNG (now Digimarc) to digitize packages. The initiative allows for consumer engagement and enables better sorting in recycling facilities. The digital watermarks, developed through the HolyGrail 2.0 project, provide high-speed, automated sorting of packaging waste.
Key Challenges
Environmental Concerns and Plastic Waste Management
One of the foremost challenges facing the soft drinks packaging market is the growing concern over plastic waste and its environmental impact. Despite recycling initiatives, a significant proportion of plastic bottles and flexible packaging still end up in landfills or oceans. Stricter regulations on single-use plastics and increasing consumer awareness have intensified pressure on manufacturers to adopt sustainable alternatives. However, the transition to biodegradable or recyclable materials often involves higher production costs and supply chain adjustments. Balancing environmental responsibility with affordability and performance remains a key challenge for the industry’s long-term growth.
Fluctuating Raw Material Prices and Supply Chain Disruptions
Volatility in raw material prices, particularly for PET, aluminum, and glass, poses a major challenge for packaging producers. Economic uncertainties, trade restrictions, and geopolitical tensions can disrupt supply chains, leading to delays and increased operational costs. Additionally, the energy-intensive nature of packaging production compounds the impact of rising fuel and electricity prices. Manufacturers are increasingly investing in local sourcing and process automation to mitigate these risks, but consistent cost control remains difficult. These fluctuations not only affect profit margins but also influence pricing strategies across the beverage packaging value chain.
Regional Analysis
North America:
North America held a significant share of the global soft drinks packaging market in 2024, driven by high consumption of carbonated beverages, flavored waters, and energy drinks. The region accounted for around 28% of the global market share, supported by strong demand in the United States and Canada. Sustainability initiatives, such as the adoption of recycled PET and aluminum packaging, are influencing purchasing decisions. Major beverage companies are investing in lightweight, recyclable, and eco-friendly materials to comply with environmental regulations. The region’s advanced manufacturing infrastructure and rising health-conscious trends continue to fuel packaging innovation.
Europe:
Europe accounted for approximately 26% of the global soft drinks packaging market share in 2024, led by countries such as Germany, the U.K., France, and Italy. The region’s market growth is strongly supported by stringent EU packaging waste regulations and the widespread adoption of circular economy models. Glass and aluminum packaging are preferred due to their high recyclability rates. Moreover, growing demand for functional beverages and sugar-free drinks is fostering packaging diversification. European manufacturers are focusing on sustainable labeling, refillable packaging systems, and reduced plastic use to align with the region’s environmental objectives.
Asia-Pacific:
The Asia-Pacific region dominated the soft drinks packaging market in 2024, capturing nearly 35% of the global market share. Rapid urbanization, increasing disposable incomes, and expanding youth populations in China, India, and Southeast Asian countries are driving beverage consumption. The demand for lightweight and cost-efficient plastic bottles remains high, particularly for carbonated soft drinks and bottled water. Moreover, the growing influence of Western lifestyle habits and the rise of convenience stores have accelerated packaging innovations. Manufacturers in the region are investing in recyclable PET and flexible pouches to meet evolving consumer preferences and sustainability goals.
Latin America:
Latin America represented about 7% of the global soft drinks packaging market share in 2024, with Brazil and Mexico being key contributors. Rising demand for flavored beverages, juices, and energy drinks is stimulating the adoption of flexible and PET packaging. Economic development and urban population growth are expanding retail beverage sales. However, environmental challenges related to waste management are pushing brands to incorporate recycled materials and biodegradable packaging options. The growing influence of international beverage companies and increased investment in regional production facilities are expected to strengthen the market outlook.
Middle East & Africa:
The Middle East and Africa accounted for around 4% of the global soft drinks packaging market share in 2024. The market is growing steadily due to rising soft drink consumption in Gulf countries and expanding urban centers across Africa. Increasing adoption of bottled water and carbonated beverages is fueling demand for plastic and metal packaging. The region’s developing packaging infrastructure presents opportunities for local and international manufacturers. Additionally, the growing awareness of sustainable packaging solutions, coupled with government initiatives promoting recycling, is expected to support moderate but consistent market growth over the forecast period.
Market Segmentations:
By Material
- Plastic
- Glass
- Metal
- Other Materials
By Product
- Can
- Bottle & Jar
- Pouch
- Carton
- Other Products
By Application
- Alcoholic Beverages
- Non-alcoholic Beverages
By Geography
- North America
- U.S.
- Canada
- Mexico
- Europe
- Germany
- France
- U.K.
- Italy
- Spain
- Rest of Europe
- Asia Pacific
- China
- Japan
- India
- South Korea
- South-east Asia
- Rest of Asia Pacific
- Latin America
- Brazil
- Argentina
- Rest of Latin America
- Middle East & Africa
- GCC Countries
- South Africa
- Rest of the Middle East and Africa
Competitive Landscape
The competitive landscape of the soft drinks packaging market is characterized by the presence of several global and regional players focusing on innovation, sustainability, and cost efficiency. Leading companies such as Ball Corporation, WestRock Company, Berry Global Inc., Tetra Laval International S.A., and Stora Enso dominate the market with strong product portfolios and extensive distribution networks. These players are investing in eco-friendly materials, lightweight packaging solutions, and advanced manufacturing technologies to meet evolving consumer and regulatory demands. Strategic collaborations, mergers, and acquisitions are common, enabling firms to expand their geographical reach and enhance technological capabilities. Additionally, companies like SIG, Crown, Graham Packaging, and Amber Packaging are focusing on recyclable and renewable packaging formats to strengthen their market presence. The competition remains intense as manufacturers strive to balance sustainability goals with cost-effectiveness and operational efficiency in an increasingly dynamic beverage packaging environment.
Key Player Analysis
- Ball Corporation
- WestRock Company
- Berry Global Inc.
- Tetra Laval International S.A.
- Stora Enso
- SIG
- Crown
- Graham Packaging
- Amber Packaging
Recent Developments
- In May 2025, Anheuser-Busch committed USD 300 million to U.S. facilities, expanding its Technical Excellence Center model and workforce training.
- In February 2025, Amcor completed its USD 8.4 billion all-stock merger with Berry Global, creating a global flexible- and rigid-packaging leader.
- In February 2025, Ball Corporation acquired Florida Can Manufacturing to strengthen its North American aluminium can network.
- In January 2025, ALPLA launched HDPE recycling operations in Brazil, boosting South American circular-economy infrastructure
Report Coverage
The research report offers an in-depth analysis based on Material, Product, Application, End-User and Geography. It details leading market players, providing an overview of their business, product offerings, investments, revenue streams, and key applications. Additionally, the report includes insights into the competitive environment, SWOT analysis, current market trends, as well as the primary drivers and constraints. Furthermore, it discusses various factors that have driven market expansion in recent years. The report also explores market dynamics, regulatory scenarios, and technological advancements that are shaping the industry. It assesses the impact of external factors and global economic changes on market growth. Lastly, it provides strategic recommendations for new entrants and established companies to navigate the complexities of the market.
Future Outlook
- The soft drinks packaging market will continue to grow steadily, driven by rising global beverage consumption.
- Manufacturers will increasingly adopt recyclable, biodegradable, and reusable packaging materials.
- PET bottles and aluminum cans will remain dominant due to their cost efficiency and recyclability.
- Digital and smart packaging technologies will enhance brand engagement and traceability.
- Lightweight and flexible packaging formats will gain popularity for on-the-go consumption.
- Sustainability commitments from major beverage brands will shape future packaging strategies.
- Automation and advanced manufacturing processes will improve production efficiency.
- Regional players will expand through mergers, partnerships, and technological collaborations.
- Regulatory pressure will encourage innovation in eco-friendly and circular packaging solutions.
- Asia-Pacific will maintain its leadership position, supported by rapid urbanization and consumer demand.

Request a Free Sample
Fill in your details and we'll send you a free sample report.
- Sample data tables & charts
- Research methodology
Need a Custom Version of This Report?
Tailor the scope, geography, or segments to your exact requirements.
- Custom geography or segment scope
- Direct access to our analyst team
Frequently Asked Questions
What is the current market size for the Soft Drinks Packaging market, and what is its projected size in 2032?
At what Compound Annual Growth Rate is the Soft Drinks Packaging market projected to grow between 2025 and 2032?
Which Soft Drinks Packaging market segment held the largest share in 2024?
What are the primary factors fueling the growth of the Soft Drinks Packaging market?
Who are the leading companies in the Soft Drinks Packaging market?
Which region commanded the largest share of the Soft Drinks Packaging market in 2024?
Table of Content
Chapter 1 Market Segmentation
- 1.1 Segmentation Framework
- 1.1.1 Product and Service Classification
- 1.1.2 Application and End-Use Classification
- 1.1.3 Technology and Solution Classification
- 1.1.4 Customer and Distribution Channel Classification
- 1.1.5 Geographic Segmentation
- 1.1.6 Market Segment Definitions and Boundaries
Chapter 2 Introduction
- 2.1 Report Objectives and Scope
- 2.2 Product Definition and Industry Terminology
- 2.3 Market Inclusions and Exclusions
- 2.4 Research Process
- 2.4.1 Primary Research and Expert Interviews
- 2.4.2 Secondary Research and Source Review
- 2.4.3 Top-Down and Bottom-Up Estimation
- 2.4.4 Data Triangulation and Verification
- 2.5 Market Size Measurement Basis
- 2.5.1 2024: USD 143.53 billion → 2032: USD 179.01 billion
- 2.6 Historical and Forecast Reference Periods
- 2.6.1 Base Year: 2024
- 2.6.2 Forecast Period: 2024-2032
- 2.7 Research Assumptions and Limitations
Chapter 3 Executive Summary
- 3.1 Market Snapshot and Key Findings
- 3.2 Base-Year Market Size, 2024
- 3.3 Forecast Market Size, 2032
- 3.4 Revenue and Volume Growth Outlook
- 3.5 Key Demand and Supply Indicators
- 3.6 Leading Market Segments
- 3.7 Fastest-Growing Market Opportunities
- 3.8 Regional Performance Highlights
- 3.9 Technology and Industry Transformation
- 3.10 Competitive Landscape Summary
- 3.11 Analyst View and Strategic Implications
Chapter 4 Global Soft Drinks Packaging Market Trends and Developments
- 4.1 Historical Industry Development
- 4.2 Recent Market Trends and Developments
- 4.3 Demand and Customer Behavior Trends
- 4.4 Technology and Product Innovation
- 4.5 Artificial Intelligence, Automation and Digitalization
- 4.6 Local Manufacturing and Supply Chain Realignment
- 4.7 Industry Partnerships, Mergers and Acquisitions
- 4.8 Sustainability and Circular Economy Developments
- 4.9 Government and Private Sector Investment Trends
- 4.10 Emerging Business Models and Commercialization
- 4.11 Industry Developments and Announcements
Chapter 5 Global Soft Drinks Packaging Market Production, Supply and Demand Analysis
- 5.1 Demand Trend and Consumption Analysis
- 5.2 Demand Forecast, 2024-2032
- 5.3 Production and Output Trend
- 5.4 Production and Output Forecast, 2024-2032
- 5.5 Installed Capacity and Capacity Utilization
- 5.6 Company-Wise Production Plants and Statistics
- 5.6.1 Installed Production Capacity
- 5.6.2 Actual Production
- 5.6.3 Planned Capacity and Expansion Targets
- 5.7 Supply Chain Structure and Procurement Trends
- 5.8 Supply-Demand Gap and Bottlenecks
- 5.9 Import Dependence and Sourcing Structure
- 5.10 Contract Manufacturing and Outsourcing
- 5.11 Regional Supply and Demand Concentration
Chapter 6 Global Soft Drinks Packaging Market Pricing Analysis
- 6.1 Pricing Structure and Measurement
- 6.2 Historical Pricing Trends
- 6.3 Pricing Outlook, 2024-2032
- 6.4 Average Selling Price and Unit Economics
- 6.5 Pricing by Product and Market Segment
- 6.6 Geographic Pricing Differences
- 6.7 Key Input, Energy, Labor and Logistics Costs
- 6.8 Contract Pricing and Purchasing Models
- 6.9 Pricing Sensitivity and Competitive Positioning
- 6.10 Price, Margin and Profitability Implications
Chapter 7 Global Soft Drinks Packaging Market Dynamics
- 7.1 Market Growth Drivers
- 7.1.1 Demand-Side Drivers
- 7.1.2 Technology and Innovation Drivers
- 7.1.3 Infrastructure and Investment Drivers
- 7.1.4 Regulatory and Policy Drivers
- 7.2 Market Restraints
- 7.2.1 Cost and Affordability Constraints
- 7.2.2 Technology and Adoption Barriers
- 7.2.3 Supply Chain and Operational Constraints
- 7.3 Market Challenges
- 7.3.1 Competitive Pressure and Margin Erosion
- 7.3.2 Skills, Infrastructure and Implementation Gaps
- 7.4 Emerging Market Opportunities
- 7.5 Market Dynamics Impact and Time-Horizon Assessment
Chapter 8 Global Soft Drinks Packaging Value Chain Analysis
- 8.1 Industry Value Chain Overview
- 8.2 Upstream Suppliers and Critical Inputs
- 8.3 Technology and Component Providers
- 8.4 Manufacturing or Service Delivery
- 8.5 Distribution, Channel Partners and Integrators
- 8.6 Downstream Applications and End Users
- 8.7 Value Addition and Profit Pools
- 8.8 Vertical Integration and Outsourcing
- 8.9 Supplier Concentration and Risk
- 8.10 Supply Chain Localization and Resilience
Chapter 9 Global Soft Drinks Packaging Market Regulations and Policies
- 9.1 Relevant Laws, Standards and Compliance Frameworks
- 9.2 Product, Service, Safety and Quality Requirements
- 9.3 Government Policies, Incentives and Subsidies
- 9.4 Imports, Exports and Trade Barriers
- 9.5 Public Procurement and Local Content Requirements
- 9.6 Environmental and Sustainability Compliance
- 9.7 Upcoming Policy Changes and Market Implications
Chapter 10 Global Soft Drinks Packaging Market Hotspots and Opportunities
- 10.1 Market Opportunity Mapping and Growth Hotspots
- 10.2 High-Growth Applications and Customer Groups
- 10.3 Underserved Markets and White-Space Opportunities
- 10.4 Emerging Technology and Product Opportunities
- 10.5 New Capacity and Investment Hotspots
- 10.6 Market Entry and Expansion Opportunities
- 10.7 Distribution and Partnership Opportunities
- 10.8 Near-Term and Long-Term Commercial Potential
- 10.9 Opportunity Attractiveness and Execution Risks
Chapter 11 Global Soft Drinks Packaging Market Outlook, 2024-2032
- 11.1 Market Size and Analysis
- 11.1.1 Revenue (Market Measurement: 2024: USD 143.53 billion → 2032: USD 179.01 billion)
- 11.1.2 Market Volume and Quantity Sold
- 11.1.3 Historical Market Size
- 11.1.4 Base-Year Market Size, 2024
- 11.2 Market Forecast, 2024-2032
- 11.2.1 Revenue Forecast to 2032
- 11.2.2 Volume Forecast to 2032
- 11.2.3 CAGR and Year-on-Year Growth
- 11.2.4 Incremental Revenue Opportunity
- 11.3 Forecast Assumptions and Scenario Analysis
- 11.3.1 Base-Case Forecast
- 11.3.2 Optimistic and Conservative Scenarios
- 11.3.3 Technology, Pricing and Policy Sensitivities
- 11.4 Market Attractiveness and Growth Outlook
Chapter 12 Global Soft Drinks Packaging Market Segmentation and Outlook
- 12.1 Segmentation Summary and Market Shares, 2024
- 12.2 Largest and Fastest-Growing Segments
- 12.3 Segment Growth Comparison
- 12.4 Segment Attractiveness and Priority Matrix
Chapter 13 Global Soft Drinks Packaging Geographic Market Outlook, 2024-2032
- 13.1 Regional Market Size and Share, 2024
- 13.2 Regional Market Forecast, 2024-2032
- 13.3 Regional Pricing, Production and Demand Differences
- 13.4 North America
- 13.4.1 United States
- 13.4.2 Canada
- 13.4.3 Mexico
- 13.5 Europe
- 13.5.1 Germany
- 13.5.2 France
- 13.5.3 Italy
- 13.5.4 United Kingdom
- 13.5.5 Spain
- 13.5.6 Poland
- 13.5.7 Russia
- 13.5.8 Netherlands
- 13.5.9 Belgium
- 13.5.10 Sweden
- 13.5.11 Denmark
- 13.5.12 Norway
- 13.5.13 Rest of Europe
- 13.6 Asia Pacific
- 13.6.1 China
- 13.6.2 India
- 13.6.3 Japan
- 13.6.4 South Korea
- 13.6.5 Thailand
- 13.6.6 Indonesia
- 13.6.7 Vietnam
- 13.6.8 Malaysia
- 13.6.9 Australia
- 13.6.10 Rest of Asia Pacific
- 13.7 Latin America
- 13.7.1 Brazil
- 13.7.2 Argentina
- 13.7.3 Colombia
- 13.7.4 Chile
- 13.7.5 Rest of Latin America
- 13.8 Middle East
- 13.8.1 Saudi Arabia
- 13.8.2 United Arab Emirates
- 13.8.3 Turkey
- 13.8.4 Israel
- 13.8.5 Iran
- 13.8.6 Rest of the Middle East
- 13.9 Africa
- 13.9.1 South Africa
- 13.9.2 Egypt
- 13.9.3 Nigeria
- 13.9.4 Morocco
- 13.9.5 Rest of Africa
- 13.10 Regional Investment, Policy and Supply Chain Differences
- 13.11 Regional Competitive Landscape
- 13.12 Geographic Growth Hotspots
Chapter 14 Global Soft Drinks Packaging Technology, Innovation and Sustainability Outlook
- 14.1 Technology Landscape and Maturity
- 14.2 Product, Process and Service Innovation
- 14.3 AI, Automation and Digital Tools in the Industry
- 14.4 Technology Adoption and Performance Benchmarking
- 14.5 Innovation Pipeline and R&D Investment
- 14.6 Patent and Intellectual Property Trends
- 14.7 Energy Efficiency and Resource Management
- 14.8 Sustainability, Recycling and Circularity
- 14.9 Technology Roadmap, 2024-2032
- 14.10 Risks of Obsolescence and Technology Substitution
Chapter 15 Global Soft Drinks Packaging Market Key Strategic Imperatives
- 15.1 Growth and Market Entry Priorities
- 15.2 High-Return Products and Segments
- 15.3 Pricing, Profitability and Cost Optimization
- 15.4 Technology Investment and Product Differentiation
- 15.5 Supply Chain Localization and Resilience
- 15.6 Distribution and Customer Acquisition
- 15.7 Partnership, Acquisition and Capacity Strategy
- 15.8 Regional Expansion Priorities
- 15.9 Short-, Medium- and Long-Term Actions
Chapter 16 Competition Outlook
- 16.1 Industry Competition Characteristics
- 16.2 Market Structure and Concentration
- 16.3 Market Share and Competitive Positioning, 2024
- 16.4 Company-Wise Revenue and Product Benchmarking
- 16.5 Production and Service Capacity Benchmarking
- 16.6 Technology, Pricing and Differentiation
- 16.7 Regional Footprint and Distribution Strength
- 16.8 Mergers, Acquisitions and Strategic Alliances
- 16.9 New Entrants and Competitive Threats
- 16.10 Porter's Five Forces and Industry Attractiveness
- 16.11 Competitive Outlook, 2024-2032
Chapter 17 Company Profiles
- 17.1 Company Coverage and Selection Criteria
- 17.2 Leading Market Participants – Standard Profile Structure
- 17.2.1 Business Description
- 17.2.2 Company Ownership and Geographic Presence
- 17.2.3 Product and Service Portfolio
- 17.2.4 Manufacturing and Operating Footprint
- 17.2.5 Production Capacity and Expansion Plans
- 17.2.6 Financial Performance and Investment
- 17.2.7 Market Share and Competitive Position
- 17.2.8 Technology and Innovation Capabilities
- 17.2.9 Strategic Alliances or Partnerships
- 17.2.10 Recent Developments
- 17.2.11 Growth Strategy and Outlook
- 17.3 Other Relevant Market Participants
Note: Every listed company is profiled on the structure shown under the first company. The company list is preliminary and may change based on research findings, market developments, data availability and client requirements.
Chapter 18 Disclaimer
- 18.1 Research and Forecast Disclaimer
- 18.2 Data Source and Estimation Limitations
Note: The depth of individual sections depends on data availability for this market. Volume, capacity, trade and other unit-based metrics are included where applicable.

