Market Overview
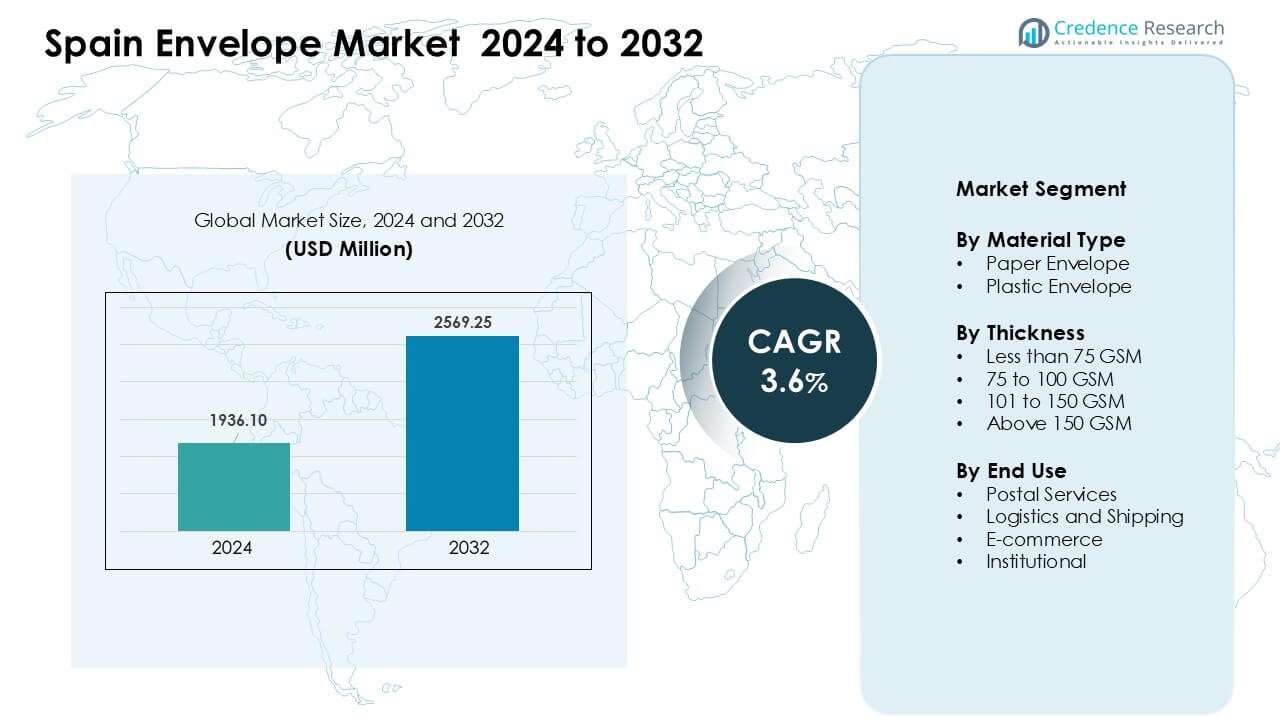
Spain Envelope Market was valued at USD 1936.10 million in 2024 and is anticipated to reach USD 2569.25 million by 2032, growing at a CAGR of 3.6% during the forecast period.
| REPORT ATTRIBUTE |
DETAILS |
| Historical Period |
2020-2023 |
| Base Year |
2024 |
| Forecast Period |
2025-2032 |
| Spain Envelope Market Size 2024 |
USD 1936.10 Million |
| Spain Envelope Market, CAGR |
3.6% |
| Spain Envelope Market Size 2032 |
USD 2569.25 Million |
The Spain Envelope Market is shaped by key players such as Fuji Seal International, Ennis, Macfarlane, 3M Company, Glatfelter, Coveris Holdings, Bong, International Paper, Blake Envelopes, and Cenveo. These companies compete through strong product portfolios, sustainable paper solutions, secure envelope formats, and customized printing services that support both institutional and commercial communication. Many suppliers also expand digital printing capacity to meet rising demand from SMEs and e-commerce users. Urban centers remained the leading region in 2024 with about 63% share, driven by dense corporate activity, strong postal networks, and higher consumption of branded and administrative envelopes.
Access crucial information at unmatched prices!
Request your sample report today & start making informed decisions powered by Credence Research Inc.!
Download Sample
Market Insights
- The Spain Envelope Market reached USD 1936.10 million in 2024 and is projected to reach USD 2569.25 million by 2032, growing at a CAGR of 3.6%.
- Demand grew due to strong use across postal services, logistics, institutions, and e-commerce, with paper envelopes holding about 71% share in 2024.
- Trends include a shift toward customizable, branded, and eco-friendly envelopes, along with rising adoption of tamper-proof and secure formats for regulated communication.
- Top competitors such as Fuji Seal International, Ennis, Macfarlane, 3M Company, and International Paper expand capabilities in sustainable materials and digital printing, though price pressure from imports remains a restraint.
- Urban centers led the market with nearly 63% share in 2024, supported by dense corporate activity, while the 75–100 GSM thickness segment dominated with about 46% share, reflecting strong demand for everyday administrative communication.
 Market Segmentation Analysis:
By Material Type
Paper envelopes held the dominant share in the Spain Envelope Market in 2024 with about 71% share. Demand stayed strong due to wide use in offices, government units, and branded communication. Many firms prefer paper formats because they support printing, stamping, and eco-friendly goals. Plastic envelopes grew in shipping and e-commerce due to moisture resistance and stronger tear strength. Growth in the plastic type came from rising parcel returns and protective packaging needs. Both materials saw steady demand from expanding business communication and compliance needs across Spain.
- For instance, Mayer-Kuvert-network a major European envelope manufacturer supplying to multiple EU countries produces around 15-16 billion paper envelopes annually in its core business, underscoring how large‑scale paper‑based production continues to anchor envelope supply in Europe.
By Thickness
The 75 to 100 GSM segment led the Spain Envelope Market in 2024 with nearly 46% share. Firms favored this range for daily letters, billing documents, and formal communication. This thickness offers balanced stiffness, print clarity, and suitable mailing weight. Less than 75 GSM types served bulk mailers with cost goals, while 101 to 150 GSM envelopes gained traction in premium segments. Above 150 GSM formats grew in gift cards and secure document handling. Growth across all thickness levels came from rising institutional mail volume and brand-focused packaging.
- For instance, Packaging and envelope suppliers do commonly offer and use kraft papers within the 70 GSM to 120 GSM range for envelopes and mailers.
By End Use
Postal services held the largest share in 2024 with about 39% of the Spain Envelope Market. National and regional mail networks kept envelope demand steady due to legal notices, government letters, and financial communication. Logistics and shipping expanded envelope use for document pouches and shipping labels. E-commerce drove higher use of durable envelopes for returns, invoices, and product papers. Institutional users such as schools, hospitals, and legal offices supported recurring demand. Growth across end uses came from Spain’s stable mail workflows and expanding hybrid communication systems.
Key Growth Drivers
Rising Institutional and Administrative Communication
Institutional communication continues to drive strong envelope demand across Spain. Government bodies, banks, insurance firms, and educational institutions rely on envelopes for regulatory notices, legal papers, billing cycles, and exam-related communication. Many agencies still require sealed physical documents for compliance, which supports steady annual volume. The rise in hybrid communication, where digital alerts are paired with hard-copy records, further strengthens this driver. Schools and universities also depend on envelopes for certificates, admission kits, and formal correspondence. This broad institutional base keeps envelope consumption stable and reinforces long-term market resilience despite growing digital alternatives.
- For instance, Correos is the state-owned national carrier responsible for providing the universal postal service across Spain underpinning institutional delivery flows; the entire Spanish postal market’s postal and parcel operations accounted for over 1,087.3 million items processed by all operators in 2021.
Expansion of Logistics, Shipping, and E-commerce Activity
Spain’s expanding logistics and e-commerce ecosystem boosts demand for durable envelopes across shipping workflows. Parcel networks require envelopes for invoices, return labels, fragile document pouches, and branded packaging. As online orders rise, reverse logistics also increases the need for secure and tamper-resistant envelopes. Many courier companies prefer lightweight, durable formats to reduce transport cost while protecting documents during transit. Growth in cross-border trade strengthens this trend by driving higher use of tear-resistant and water-resistant envelope varieties. These factors collectively build strong demand for envelopes within Spain’s fast-growing e-commerce and delivery sectors.
- For instance, leading global logistics operator UPS opened a new sorting and delivery center in Zaragoza (Spain) in 2024 a facility covering over 4,000 m² and capable of processing 3,000 packages per hour, significantly increasing the capacity of domestic parcel flows.
Growing Preference for Sustainable and Recyclable Packaging
Sustainability goals play a key role in boosting paper envelope demand. Spanish businesses increasingly shift toward recyclable and biodegradable packaging to meet internal ESG commitments and regulatory expectations. Many companies choose paper envelopes as a low-impact alternative to plastic-based formats. Public tenders also favor eco-friendly supplies, encouraging institutional buyers to adopt sustainable envelope options. The rise of green branding encourages firms to select envelopes with certified recycled content or FSC-certified paper. This shift aligns with Spain’s broader national sustainability programs and supports long-term growth in environmentally responsible envelope solutions.
Key Trend & Opportunity
Growth of Customized and Branded Envelopes
Businesses in Spain increasingly use envelopes as low-cost brand touchpoints across customer-facing communication. Customized printing, security features, and premium textures help firms project brand identity and build trust. This trend opens new opportunities for envelope manufacturers offering short-run digital printing, variable data printing, and high-quality finishes. E-commerce sellers also use branded envelopes for invoices, thank-you notes, and promotional inserts. The rise in SME marketing activity boosts demand for customizable envelope formats. As firms seek stronger differentiation in crowded markets, customized envelope production becomes a promising growth avenue.
- For instance, Mayer‑Kuvert‑network a major European envelope manufacturer produces around 15 billion envelopes annually through its 136 reel‑fed and 59 blank‑fed machines.
Adoption of High-Security and Tamper-Proof Envelope Designs
Higher demand for secure document exchange creates new opportunities for advanced envelope solutions. Banks, legal offices, hospitals, and logistics firms prefer tamper-proof, tear-resistant, and opaque envelopes for sensitive papers. Growth in identity verification processes and regulated communication boosts the adoption of security features such as watermarks, security tints, and reinforced seams. E-commerce returns also increase the need for durable envelopes with improved closure systems. As data protection rules tighten, the market has room to expand into premium security-grade envelope categories designed to safeguard confidential information.
- For instance, in Europe the market for security/tamper‑evident paper and envelopes is seeing increased adoption many papers now incorporate tear‑resistant fibers, security threads or chemical‑sensitive coatings to prevent tampering or forgery, especially for legal documents, diplomas and financial correspondence.
Key Challenge
Rising Digital Substitution in Administrative and Corporate Communication
Digital transformation continues to reduce envelope use within many corporate and administrative functions. Bills, statements, notices, and general communication increasingly move to email, app-based alerts, and automated digital mailing systems. Companies adopt paperless workflows to reduce cost and improve operational speed, decreasing routine envelope volumes. Government digitalization programs also support this shift by promoting e-signatures, online portals, and digital certificate systems. While envelopes remain essential in compliance-heavy tasks, the long-term reduction in mass mailing presents a structural challenge that restrains overall market growth.
Price Pressure from Raw Material Costs and Import Competition
Envelope manufacturers face rising cost pressure due to fluctuations in paper pulp pricing, energy costs, and import competition. Local producers struggle to maintain margins when raw material prices rise faster than selling prices. Imported envelopes from low-cost manufacturing hubs add further pricing tension in Spain’s competitive market. Many institutional buyers award large contracts based on lowest bid, leaving limited room for price flexibility. These conditions make cost control difficult and challenge smaller manufacturers who lack scale advantages. As competition grows, sustaining profitability becomes a major challenge for the Spain Envelope Market.
Regional Analysis
Urban Centers
Urban centers accounted for about 63% share of the Spain Envelope Market in 2024, driven by strong demand from corporate offices, government agencies, banks, and large service institutions. These areas maintain high volumes of administrative communication, formal notices, and branded correspondence. E-commerce hubs in major cities also use envelopes for billing inserts, returns, and shipping documents. The presence of well-established logistics networks supports steady envelope circulation. Growing adoption of customized and premium printed envelopes further strengthens demand in urban regions, keeping them the leading contributor to Spain’s overall envelope consumption.
Smaller Cities and Rural Areas
Smaller cities and rural areas held nearly 37% share of the Spain Envelope Market in 2024, supported by widespread postal activity and community-level administrative communication. Local governments, schools, and healthcare units rely on envelopes for notices, certificates, and essential records. Rural logistics routes still use physical documentation for transport and delivery confirmation, which sustains steady demand. Many SMEs in smaller towns continue to prefer paper-based communication for billing and customer outreach. Although digital adoption is rising, the slower shift toward paperless systems helps maintain consistent envelope usage across Spain’s non-urban regions.
Market Segmentations:
By Material Type
- Paper Envelope
- Plastic Envelope
By Thickness
- Less than 75 GSM
- 75 to 100 GSM
- 101 to 150 GSM
- Above 150 GSM
By End Use
- Postal Services
- Logistics and Shipping
- E-commerce
- Institutional
By Geography
- Smaller Cities and Rural Areas
- Urban Centers
Competitive Landscape
The competitive landscape of the Spain Envelope Market features a mix of global manufacturers and regional suppliers that compete through material quality, customization services, and distribution reach. Key players such as Fuji Seal International, Ennis, Macfarlane, 3M Company, Glatfelter, Coveris Holdings, Bong, International Paper, Blake Envelopes, and Cenveo strengthen the market by offering a wide range of paper and specialty envelopes. Many companies focus on sustainable materials, security features, and lightweight formats to match rising institutional and e-commerce needs across Spain. Manufacturers also expand short-run digital printing capabilities to support branded communication for SMEs and corporate clients. Competitive pressure remains high due to pricing sensitivity and growing demand for eco-friendly packaging.
Key Player Analysis
- Fuji Seal International
- Ennis
- Macfarlane
- 3M Company
- Glatfelter
- Coveris Holdings
- Bong
- International Paper
- Blake Envelopes
- Cenveo
Recent Developments
- In July 2025, International Paper completed the divestiture of five corrugated box plants to PALM Group. The deal included a plant in Bilbao, Spain, reshaping packaging capacity that serves regional mail and envelope users.
- In April 2025, Ennis, Inc.: acquisition to expand envelope capacity (indirect impact on Spain) Ennis announced the acquisition of Northeastern Envelope in April 2025 (U.S. trade manufacturer). That acquisition increases Ennis’s manufacturing and inventory footprint for envelopes and window/envelope SKUs, which improves the company’s global supply flexibility.
Shape Your Report to Specific Countries or Regions & Enjoy 30% Off!
Report Coverage
The research report offers an in-depth analysis based on Material Type, Thickness, End-Use and Geography. It details leading market players, providing an overview of their business, product offerings, investments, revenue streams, and key applications. Additionally, the report includes insights into the competitive environment, SWOT analysis, current market trends, as well as the primary drivers and constraints. Furthermore, it discusses various factors that have driven market expansion in recent years. The report also explores market dynamics, regulatory scenarios, and technological advancements that are shaping the industry. It assesses the impact of external factors and global economic changes on market growth. Lastly, it provides strategic recommendations for new entrants and established companies to navigate the complexities of the market.
Future Outlook
- Spain will see steady envelope demand from institutions that continue using physical documents.
- E-commerce growth will boost use of durable envelopes for returns and shipping paperwork.
- Paper envelope consumption will rise as more firms adopt recyclable and eco-friendly packaging.
- Custom printed envelopes will expand as SMEs invest in low-cost branding tools.
- Security envelopes will gain traction due to stricter rules for confidential communication.
- Digital printing will grow as buyers prefer short-run, personalized envelope batches.
- Logistics networks will drive demand for tear-resistant and moisture-protected envelopes.
- Rural regions will maintain stable volumes due to slower digital replacement.
- Competition will increase as global suppliers offer cheaper sustainable materials.
- Innovation in lightweight and FSC-certified paper grades will shape future product development.


