Market Overview
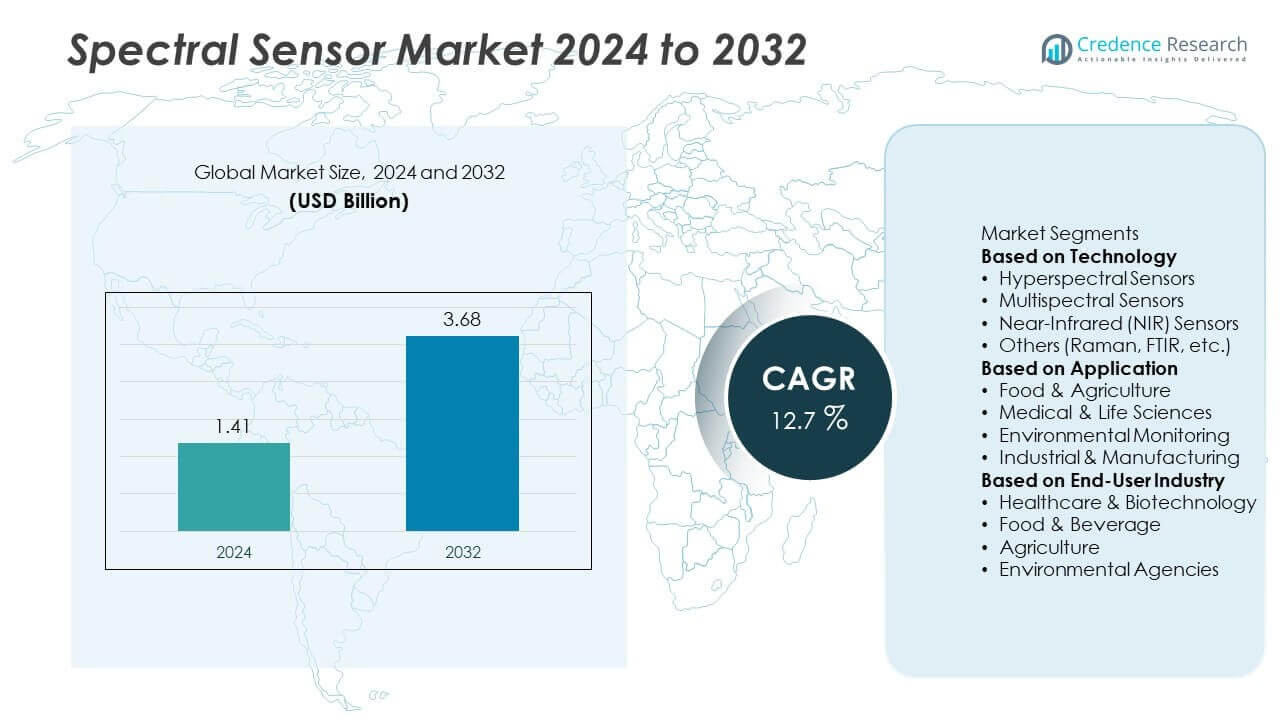
The Spectral Sensor Market was valued at USD 1.41 billion in 2024 and is projected to reach USD 3.68 billion by 2032, growing at a CAGR of 12.7% during the forecast period.
| REPORT ATTRIBUTE |
DETAILS |
| Historical Period |
2020-2023 |
| Base Year |
2024 |
| Forecast Period |
2025-2032 |
| Spectral Sensor Market Size 2024 |
USD 1.41 Billion |
| Spectral Sensor Market, CAGR |
12.7% |
| Spectral Sensor Market Size 2032 |
USD 3.68 Billion |
The spectral sensor market is driven by leading players such as AMS OSRAM, Hamamatsu Photonics, Teledyne DALSA, STMicroelectronics, Ocean Insight, BaySpec, Horiba, Headwall Photonics, Cubert, and Specim. These companies focus on developing miniaturized, high-performance hyperspectral and multispectral sensors with AI-enabled analytics to meet rising demand across healthcare, agriculture, and industrial sectors. Asia-Pacific led the market with over 38% share in 2024, supported by strong adoption in precision farming, food safety testing, and consumer electronics. North America held 30% share, driven by advanced healthcare diagnostics and R&D funding, while Europe accounted for 22% share, boosted by strict regulatory standards and sustainability initiatives.
 Market Insights
- The spectral sensor market was valued at USD 1.41 billion in 2024 and is projected to reach USD 3.68 billion by 2032, growing at a CAGR of 12.7% during the forecast period.
- Rising adoption in precision agriculture, food safety testing, and medical diagnostics is driving demand, with hyperspectral sensors holding over 40% share due to their ability to deliver detailed spectral imaging.
- Key trends include miniaturization of sensors, integration with consumer electronics, and the use of AI and cloud-based analytics for real-time spectral data interpretation.
- Leading players such as AMS OSRAM, Hamamatsu Photonics, Teledyne DALSA, STMicroelectronics, and Ocean Insight focus on R&D investment, product innovation, and strategic collaborations to strengthen market presence.
- Asia-Pacific led with over 38% share, followed by North America at 30% and Europe at 22%, with food & agriculture applications contributing around 35% share, making it the largest application segment globally.
Access crucial information at unmatched prices!
Request your sample report today & start making informed decisions powered by Credence Research Inc.!
Download Sample
Market Segmentation Analysis:
By Technology
Hyperspectral sensors dominated the spectral sensor market with over 40% share in 2024, driven by their ability to capture high-resolution spectral data across multiple wavelengths for precise material characterization. These sensors are extensively used in agriculture for crop health monitoring, in defense for surveillance, and in mining for mineral detection. Multispectral sensors followed, benefiting from growing use in consumer electronics and precision farming applications. Near-infrared (NIR) sensors are gaining adoption for food quality inspection and pharmaceutical analysis. The “Others” category, including Raman and FTIR sensors, is growing steadily for chemical and biomedical applications.
- For instance, IMEC’s hyperspectral Snapscan camera can capture over 150 spectral bands for applications like medical diagnosis, machine vision, and precision farming. Multispectral sensors, capturing fewer bands, have been widely used in agriculture, remote sensing, and more recently, miniaturized for integration into consumer electronics.
By Application
Food & agriculture applications led the market with around 35% share in 2024, supported by rising demand for contamination detection, ripeness assessment, and crop monitoring solutions. Spectral sensors enable real-time, non-destructive testing to ensure food safety and quality compliance. Medical & life sciences represented the second-largest application segment, driven by their use in tissue imaging, diagnostics, and pharmaceutical quality control. Environmental monitoring applications are expanding with growing regulatory focus on pollution tracking, while industrial & manufacturing sectors leverage spectral sensors for process optimization and defect detection.
- For instance, Felix Instruments delivered the F-750 Produce Quality Meter to hundreds of agribusinesses and research institutes in over 150 countries, allowing real-time non-destructive measurement of Brix values and dry matter in apples and kiwis during field operations.
By End-User Industry
The healthcare & biotechnology segment captured over 30% share in 2024, making it the leading end-user industry for spectral sensors. Rising investment in medical diagnostics, drug discovery, and genomics research is boosting demand for high-precision spectral analysis tools. The food & beverage industry follows closely, using spectral sensors to ensure product quality, detect adulteration, and maintain regulatory compliance. Agriculture is another fast-growing segment, as farmers adopt spectral sensing for precision farming and yield optimization. Environmental agencies use these sensors to monitor air, water, and soil quality, supporting global sustainability initiatives and compliance efforts.
Key Growth Drivers
Rising Demand in Precision Agriculture
The adoption of spectral sensors in precision agriculture is a major growth driver. These sensors help monitor crop health, detect nutrient deficiencies, and optimize irrigation and fertilizer use, improving yield and sustainability. Governments and agritech companies are encouraging digital farming practices, boosting demand for hyperspectral and multispectral solutions. The growing need for efficient resource management and food security is accelerating sensor adoption in large-scale farms and greenhouses worldwide, making agriculture a critical growth area for the spectral sensor market.
- For instance, Sentera develops and sells multispectral drone sensors that can measure NDVI and NDRE indices for crops at a high spatial resolution, enabling the detailed assessment of crop vigor.
Growing Adoption in Healthcare and Life Sciences
Healthcare and life sciences industries are increasingly using spectral sensors for non-invasive diagnostics, tissue imaging, and pharmaceutical quality control. These sensors enable early disease detection and precise analysis, supporting personalized medicine trends. The rise in chronic diseases and global investment in medical research are fueling demand for high-performance sensors. Advancements in miniaturization and integration with portable diagnostic devices are expanding applications in point-of-care testing, driving strong growth for spectral sensor solutions in clinical and research settings.
- For instance, the Renishaw RA802 Pharmaceutical Analyzer supports batch analysis of up to 96 tablets per run, and its capabilities, including high-resolution Raman imaging, are valuable for improving counterfeit detection protocols in pharmaceutical laboratories.
Expansion of Industrial and Environmental Monitoring
Industries are adopting spectral sensors for process monitoring, defect detection, and quality assurance to reduce waste and improve efficiency. Environmental agencies use these sensors for air, water, and soil quality assessment, supporting compliance with strict regulations. Rising awareness about pollution control and sustainability initiatives is boosting sensor deployment in smart city projects. The availability of compact, cost-effective sensors is further driving their integration into automated systems, making them essential tools for real-time monitoring and regulatory reporting across multiple sectors.
Key Trends & Opportunities
Integration with Consumer Electronics
Spectral sensors are increasingly being integrated into smartphones and wearable devices, creating new opportunities for mass adoption. These sensors enable on-the-go applications such as skin analysis, food freshness checks, and material identification. The miniaturization of sensor technology and declining production costs are making consumer-grade spectral sensing feasible. This trend opens a vast untapped market, encouraging manufacturers to develop user-friendly, low-cost solutions that bring laboratory-level analysis to everyday consumers.
- For instance, during 2024, trinamiX showcased its near-infrared (NIR) spectral sensor module integrated into a Snapdragon 8 Gen 3 smartphone reference design, which could enable real-time skin hydration analysis. The company collaborated with partners and presented the technology at events like Mobile World Congress, demonstrating the sensor’s capability to provide measurements in seconds for future devices.
Advancements in AI and Cloud-Based Analytics
The combination of spectral sensors with AI and cloud platforms is revolutionizing data interpretation. AI algorithms can quickly analyze large spectral datasets, detect patterns, and deliver actionable insights in real time. Cloud connectivity enables remote monitoring and predictive maintenance, supporting scalable deployment across industries. This trend creates opportunities for solution providers to offer end-to-end platforms that combine hardware, software, and analytics, enhancing value for end-users in sectors such as agriculture, healthcare, and industrial automation.
- For instance, Specim launched the SpecimONE AI Platform, capable of automated processing and classification of hyperspectral images to identify fruit ripeness and defects, which was used in a case study with Condi Food to sort cherry tomatoes at a high speed.
Key Challenges
High Cost of Advanced Sensors
Hyperspectral and advanced multispectral sensors remain expensive, which limits their adoption, particularly among small and medium-sized enterprises. The high cost of acquisition, calibration, and maintenance can delay large-scale deployment. Manufacturers are working on cost optimization through mass production and modular designs, but price sensitivity in developing regions remains a challenge for market penetration.
Complexity in Data Processing and Integration
Spectral data is complex and requires specialized software and expertise for accurate interpretation. The lack of standardized data processing tools and integration issues with existing systems can hinder adoption. Users in sectors like agriculture and environmental monitoring may face challenges in training personnel and deploying these solutions effectively. Streamlining data analytics and providing user-friendly interfaces are critical to overcoming this barrier.
Regional Analysis
Asia-Pacific
Asia-Pacific led the spectral sensor market with over 38% share in 2024, driven by rising adoption in agriculture, food quality monitoring, and industrial process control. China and India are investing heavily in precision farming technologies and environmental monitoring systems to address food security and sustainability challenges. Expanding semiconductor manufacturing capabilities in the region support lower-cost sensor production, further boosting adoption. Rapid growth in consumer electronics and rising demand for portable medical devices also fuel market expansion. Asia-Pacific is expected to remain the fastest-growing region, supported by strong R&D investments and supportive government initiatives.
North America
North America accounted for around 30% share in 2024, supported by advanced healthcare infrastructure, strong research funding, and early adoption of spectral sensing technologies. The United States drives regional growth with widespread use of spectral sensors in medical diagnostics, food safety testing, and environmental monitoring. Strong presence of leading sensor manufacturers and integration of AI-driven analytics solutions accelerate innovation. Demand from precision agriculture and pharmaceutical sectors continues to rise as stakeholders focus on efficiency, regulatory compliance, and product quality. Growth is further supported by federal initiatives promoting sustainability and smart manufacturing adoption.
Europe
Europe captured around 22% share in 2024, led by countries such as Germany, France, and the UK, where stringent regulations on food safety and environmental compliance drive adoption. Spectral sensors are widely used for quality assurance in manufacturing and agricultural applications, supporting EU sustainability goals. Investments in smart city projects and climate monitoring programs further boost demand. European companies are developing miniaturized, energy-efficient sensors with strong emphasis on compliance with RoHS and REACH standards. Research collaboration between universities and industry supports innovation, positioning Europe as a key hub for technological advancements in spectral sensing solutions.
Latin America
Latin America held 6% share in 2024, with growing demand from agricultural exporters in Brazil, Mexico, and Argentina adopting spectral sensors for crop monitoring and quality certification. Food safety initiatives and regulatory reforms are encouraging the use of non-invasive testing technologies. Industrial sectors are gradually integrating spectral sensors to improve efficiency and minimize losses. However, high equipment costs and limited local expertise are barriers to faster adoption. Manufacturers focusing on affordable, portable solutions and offering technical training are expected to capture growth opportunities in the region’s expanding agri-food and manufacturing sectors.
Middle East & Africa
The Middle East & Africa accounted for 4% share in 2024, with demand supported by increasing investment in water quality monitoring, precision agriculture, and food testing. GCC countries are deploying spectral sensors to support food security initiatives and improve industrial process monitoring. Africa is witnessing gradual adoption, particularly in South Africa, where research institutions and agri-businesses are adopting spectral technologies. Growth is constrained by cost and lack of infrastructure but is expected to accelerate with government-backed sustainability programs and partnerships aimed at building local analytical capabilities and supporting technology transfer.
Market Segmentations:
By Technology
- Hyperspectral Sensors
- Multispectral Sensors
- Near-Infrared (NIR) Sensors
- Others (Raman, FTIR, etc.)
By Application
- Food & Agriculture
- Medical & Life Sciences
- Environmental Monitoring
- Industrial & Manufacturing
By End-User Industry
- Healthcare & Biotechnology
- Food & Beverage
- Agriculture
- Environmental Agencies
By Geography
- North America
- Europe
- Germany
- France
- U.K.
- Italy
- Spain
- Rest of Europe
- Asia Pacific
- China
- Japan
- India
- South Korea
- South-east Asia
- Rest of Asia Pacific
- Latin America
- Brazil
- Argentina
- Rest of Latin America
- Middle East & Africa
- GCC Countries
- South Africa
- Rest of the Middle East and Africa
Competitive Landscape
The competitive landscape of the spectral sensor market is shaped by leading players such as AMS OSRAM, Hamamatsu Photonics, Teledyne DALSA, STMicroelectronics, Ocean Insight, BaySpec, Horiba, Headwall Photonics, Cubert, and Specim. These companies compete on innovation, product miniaturization, and integration capabilities to serve diverse applications in healthcare, agriculture, and industrial automation. Strategic initiatives focus on developing cost-effective hyperspectral and multispectral sensors, expanding production capacity, and strengthening global distribution networks. Key players are investing heavily in AI-enabled data analytics and cloud connectivity to deliver complete sensing solutions. Collaborations with agritech firms, consumer electronics manufacturers, and research institutions are driving adoption of portable, real-time spectral analysis devices. Additionally, vendors are targeting emerging markets by offering scalable, compact, and energy-efficient sensor solutions that cater to growing demand for precision agriculture, environmental monitoring, and food safety testing, positioning themselves to capture significant growth opportunities during the forecast period.
Shape Your Report to Specific Countries or Regions & Enjoy 30% Off!
Key Player Analysis
- AMS OSRAM
- Hamamatsu Photonics
- Teledyne DALSA
- STMicroelectronics
- Ocean Insight
- BaySpec
- Horiba
- Headwall Photonics
- Cubert
- Specim
Recent Developments
- In August 2025, ams OSRAM filed a patent infringement complaint vs. Spider Farmer over hyper-red (660 nm) LED tech in horticultural lighting.
- In August 2025, Headwall Photonics began deployment of hyperspectral UAV sensing solutions via GRYFN in Australia across universities, combining hyperspectral, LiDAR and RGB data.
- In April 2025, Headwall Photonics entered a strategic partnership with Laitram Machinery to deploy hyperspectral imaging technology in food processing at industrial scale.
- In 2025, Hamamatsu Photonics launched the Si APD S17353 Series sensors for enhanced low-light measurement, with six models, good signal-to-noise, sensitivity up to ~800 nm.
Report Coverage
The research report offers an in-depth analysis based on Technology, Application, End-User Industry and Geography. It details leading market players, providing an overview of their business, product offerings, investments, revenue streams, and key applications. Additionally, the report includes insights into the competitive environment, SWOT analysis, current market trends, as well as the primary drivers and constraints. Furthermore, it discusses various factors that have driven market expansion in recent years. The report also explores market dynamics, regulatory scenarios, and technological advancements that are shaping the industry. It assesses the impact of external factors and global economic changes on market growth. Lastly, it provides strategic recommendations for new entrants and established companies to navigate the complexities of the market.
Future Outlook
- The market will grow rapidly with rising demand for precision agriculture and food quality monitoring.
- Hyperspectral sensors will continue to dominate due to their advanced imaging capabilities.
- Integration of spectral sensors in smartphones and wearables will expand consumer applications.
- AI and machine learning will enhance spectral data interpretation and decision-making.
- Healthcare and life sciences will remain major contributors with growing diagnostic use cases.
- Miniaturization of sensors will drive adoption in portable and IoT-enabled devices.
- Asia-Pacific will remain the fastest-growing region with strong manufacturing and R&D investments.
- Strategic collaborations between sensor makers and agritech firms will boost precision farming adoption.
- Industrial process monitoring and automation will see increased use of spectral sensing solutions.
- Focus on cost reduction and user-friendly software will make spectral sensors accessible to SMEs.


