Market Overview
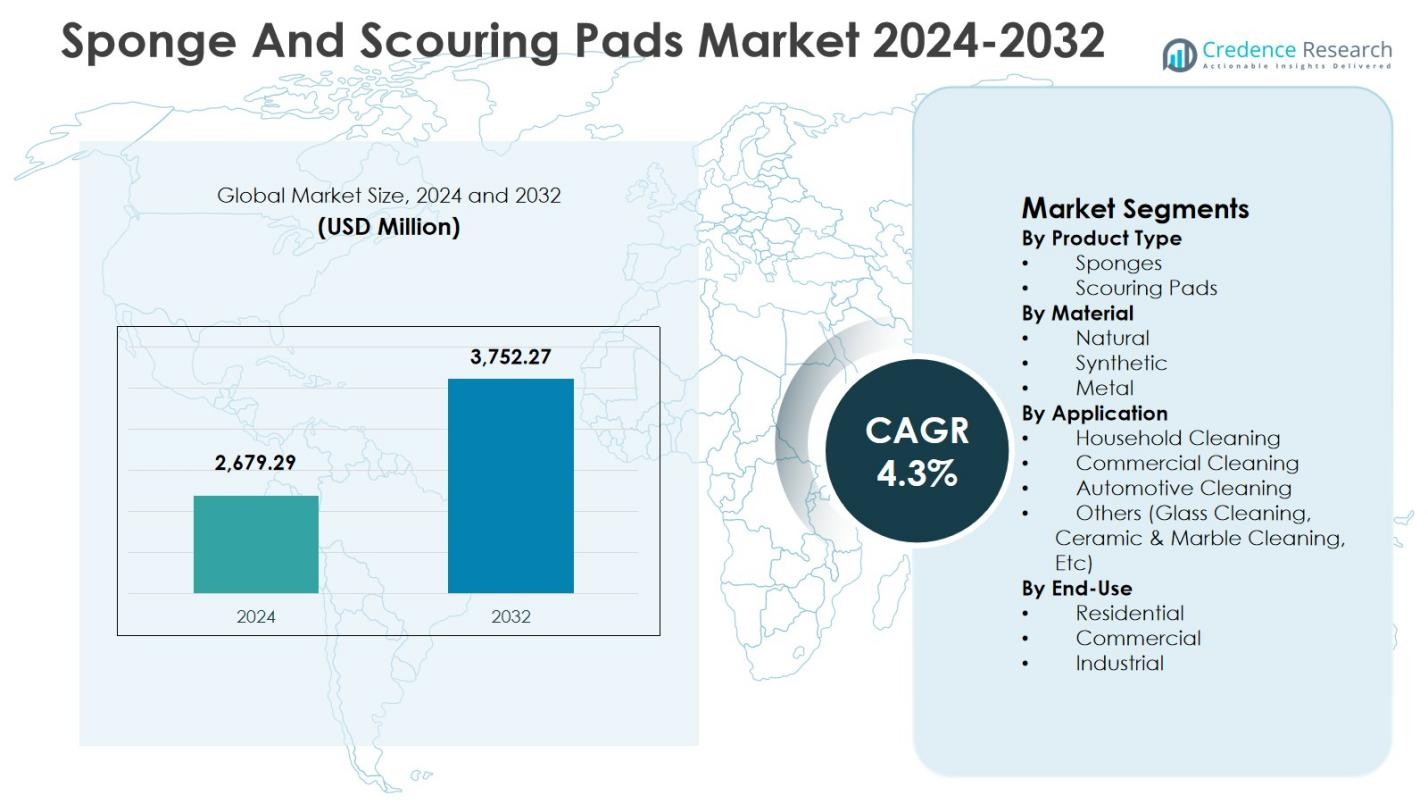
The Sponge and Scouring Pads Market size was valued at USD 2,679.29 million in 2024 and is anticipated to reach USD 3,752.27 million by 2032, growing at a CAGR of 4.3% during the forecast period.
| REPORT ATTRIBUTE |
DETAILS |
| Historical Period |
2020-2023 |
| Base Year |
2024 |
| Forecast Period |
2025-2032 |
| Sponge and Scouring Pads Market Size 2024 |
USD 2,679.29 Million |
| Sponge and Scouring Pads Market, CAGR |
4.3% |
| Sponge and Scouring Pads Market Size 2032 |
USD 3,752.27 Million |
The Sponge And Scouring Pads Market is supported by the strong presence of established manufacturers such as 3M Company, Procter & Gamble Co., Reckitt Benckiser Group, Henkel AG & Co. KGaA, Kao Corporation, Freudenberg Group, Amway Corporation, Arix S.p.A., Libman Company, and Armaly Brands. These players focus on product durability, material innovation, sustainability initiatives, and wide distribution networks to strengthen brand positioning across household and commercial cleaning applications. Asia Pacific emerged as the leading region, accounting for 33.9% market share in 2024, driven by rapid urbanization, rising hygiene awareness, and high consumption across residential and hospitality sectors. North America and Europe follow, supported by strong sanitation standards, premium product adoption, and well-established retail and e-commerce infrastructure.
Access crucial information at unmatched prices!
Request your sample report today & start making informed decisions powered by Credence Research Inc.!
Download Sample
Market Insights
- Sponge And Scouring Pads Market was valued at USD 2,679.29 million in 2024, is projected to reach USD 3,752.27 million by 2032, and grows at a CAGR of 4.3% during 2025-2032.
- Rising household hygiene awareness and higher cleaning frequency in kitchens and bathrooms strengthen demand, with Household Cleaning holding 61.8% share in 2024 as the dominant application segment.
- Product upgrades such as durable multi-layer formats, antibacterial features, and eco-focused materials support premiumization, while Sponges lead by product type with 58.6% share in 2024.
- Key players intensify scale, branding, and distribution across retail and e-commerce, while private label expansion and low differentiation increase pricing pressure for established brands.
- Asia Pacific leads with 33.9% share in 2024, followed by North America at 28.4% and Europe at 25.7%, while Latin America holds 7.4% and Middle East & Africa accounts for 4.6%, reflecting varied hygiene standards and channel maturity.
Market Segmentation Analysis:
By Product Type:
The Sponge and Scouring Pads Market, by product type, is led by Sponges, which accounted for 58.6% market share in 2024. This dominance is driven by widespread household adoption, versatility across wet and dry cleaning tasks, and compatibility with delicate surfaces such as cookware, glass, and countertops. Sponges are preferred due to their superior absorbency, ease of handling, and cost-effectiveness for daily cleaning needs. Rising urbanization, increasing hygiene awareness, and higher frequency of household cleaning activities continue to strengthen demand. Scouring pads maintain steady demand, particularly for heavy-duty applications, but sponges remain the primary volume driver across residential markets.
- For instance, Libman All-Purpose Sponge incorporates an integrated antimicrobial agent that significantly reduces bacterial growth compared to untreated sponges, supporting efficient wiping of counters and routine spills.
By Material:
Based on material, Synthetic materials dominated the Sponge and Scouring Pads Market with a 64.2% market share in 2024. Synthetic sponges and pads offer consistent quality, longer lifespan, and resistance to microbial growth compared to natural alternatives. Their ability to be engineered for varied abrasiveness levels supports use across multiple cleaning intensities. Cost efficiency, large-scale manufacturability, and strong availability through retail and e-commerce channels further reinforce adoption. Growing preference for durable, multi-use cleaning products in both household and commercial settings continues to drive synthetic material dominance, while metal materials retain niche demand in industrial and cookware cleaning applications.
- For instance, 3M’s Scotch-Brite HEX series uses synthetic power-dot technology in pads such as the Dual Purpose Scour Pad 96HEX, which is engineered to cut through baked-on food up to 5 times faster than conventional medium-duty pads, while a secondary scour surface removes fine residues for a near-spotless finish.
By Application:
By application, Household Cleaning emerged as the dominant sub-segment, accounting for 61.8% market share in 2024. High consumption frequency, routine kitchen and bathroom cleaning, and growing hygiene standards drive sustained demand from households globally. Increased use of sponges and scouring pads for dishwashing, surface cleaning, and appliance maintenance supports volume growth. Expanding middle-class populations and rising penetration of organized retail further accelerate household usage. Commercial and automotive cleaning segments show steady growth, supported by hospitality, foodservice, and vehicle maintenance activities, but household cleaning remains the largest contributor to overall market revenue.
Key Growth Drivers
Rising Household Hygiene Awareness
Rising awareness of hygiene and cleanliness standards is a primary growth driver for the Sponge and Scouring Pads Market. Consumers increasingly emphasize regular cleaning of kitchens, bathrooms, and living spaces to reduce bacterial contamination and maintain healthier home environments. This behavior has increased the frequency of sponge and scouring pad usage for routine household tasks. Urbanization, changing lifestyles, and higher disposable incomes further support demand. Easy availability through supermarkets, convenience stores, and online platforms encourages repeat purchases, reinforcing steady market expansion across residential applications.
- For instance, Scotch-Brite Power Sponge 3000 removes baked-on food four times faster than conventional sponges while resisting odor-causing bacteria through multiple rinses. Its low-scratch properties make it suitable for stainless steel and ceramic surfaces in routine cleaning.
Expansion of Commercial Cleaning Activities
The expansion of commercial establishments such as hotels, restaurants, hospitals, and office complexes is significantly driving the Sponge and Scouring Pads Market. These facilities require frequent cleaning to comply with hygiene and safety regulations, creating consistent demand for effective and low-cost cleaning tools. Sponges and scouring pads are widely used for surface sanitation, dishwashing, and maintenance tasks. Growth in the hospitality and foodservice sectors, along with increasing outsourcing of professional cleaning services, continues to strengthen demand across commercial and institutional applications.
- For instance, Hotels and restaurants turn to Scotch-Brite Professional products for kitchen and surface cleaning, including fryer tools and grill scrubbers that handle heavy grease buildup without residue.
Product Innovation and Material Advancements
Ongoing innovation in materials and product design is accelerating growth in the Sponge and Scouring Pads Market. Manufacturers are developing multi-layered sponges, antibacterial treatments, ergonomic shapes, and enhanced abrasives to improve cleaning efficiency and durability. These innovations address consumer demand for longer-lasting and more specialized cleaning solutions. The introduction of products designed for non-stick cookware, delicate surfaces, and heavy-duty cleaning expands application scope, encouraging product upgrades and supporting value growth in both household and commercial segments.
Key Trends & Opportunities
Growing Demand for Eco-Friendly Cleaning Products
The increasing preference for sustainable and environmentally responsible products represents a major trend and opportunity in the Sponge and Scouring Pads Market. Consumers are actively seeking biodegradable, plant-based, and recyclable cleaning tools to reduce environmental impact. Manufacturers investing in natural fibers, reduced plastic content, and eco-certified products are gaining traction, particularly in urban and premium segments. This trend supports product differentiation, premium pricing strategies, and expansion into environmentally conscious consumer groups across developed and emerging regions.
- For instance, EcoCoconut produces scrub pads made from 100% biodegradable coconut coir and natural tree rubber latex, offering non-scratch cleaning safe for non-stick pans and glassware while being food compostable.
Rising Influence of E-Commerce and Private Label Brands
The growing influence of e-commerce platforms and private label brands is reshaping distribution dynamics in the Sponge and Scouring Pads Market. Online retail channels offer broader product visibility, competitive pricing, and convenient purchasing options, driving higher consumer adoption. Retailers are expanding private label offerings that deliver comparable performance at lower prices. This trend creates opportunities for manufacturers to expand reach through retail partnerships, bulk packaging, and subscription-based sales models, supporting volume growth and improved market penetration.
- For instance, Blueland employs subscription-based sales for its eco-friendly sponges and scouring pads, ensuring consistent restocking and customer loyalty through direct-to-consumer convenience on its platform.
Key Challenges
Environmental Impact and Waste Management Concerns
Environmental impact associated with disposable synthetic sponges and scouring pads remains a key challenge in the Sponge and Scouring Pads Market. Many conventional products contribute to plastic waste and have limited recyclability. Increasing regulatory scrutiny and rising consumer awareness are pressuring manufacturers to adopt sustainable materials and responsible production practices. Developing eco-friendly alternatives requires substantial investment in research and supply chains, which can raise costs and limit affordability in price-sensitive markets.
Intense Price Competition and Limited Differentiation
Intense price competition poses a significant challenge for the Sponge and Scouring Pads Market. The presence of numerous local and unbranded manufacturers offering low-cost alternatives restricts pricing flexibility for established players. Limited differentiation in basic sponge and scouring pad products further intensifies margin pressure. Consumers often prioritize price over brand loyalty, particularly in developing regions, compelling manufacturers to invest heavily in innovation, branding, and packaging to maintain market position.
Regional Analysis
North America
North America held 28.4% market share in 2024 in the Sponge and Scouring Pads Market, supported by high household hygiene standards and strong demand from commercial cleaning applications. Frequent use of cleaning products in residential kitchens and bathrooms, along with strict sanitation requirements across hospitality, healthcare, and foodservice sectors, sustains market growth. The region benefits from high penetration of branded products, continuous product innovation, and strong retail and e-commerce distribution networks. Consumer preference for durable, multi-purpose, and eco-friendly cleaning tools further strengthens demand across the United States and Canada.
Europe
Europe accounted for 25.7% market share in 2024 in the Sponge and Scouring Pads Market, driven by strong environmental awareness and consistent demand from both household and commercial sectors. Strict hygiene regulations in food processing, hospitality, and healthcare facilities support steady consumption. The region shows growing adoption of eco-friendly and recyclable cleaning products, encouraging manufacturers to focus on sustainable materials. Well-established retail chains and private label brands contribute to widespread product availability. Countries such as Germany, the United Kingdom, France, and Italy remain key contributors to regional market performance.
Asia Pacific
Asia Pacific dominated the Sponge and Scouring Pads Market with 33.9% market share in 2024, supported by large population size, rapid urbanization, and rising hygiene awareness. Increasing middle-class income levels and expanding residential construction drive higher household cleaning product usage. Growth in hospitality, foodservice, and commercial infrastructure further boosts demand. The region benefits from cost-effective manufacturing and strong presence of local and regional players. Expanding organized retail, improving distribution networks, and increasing online sales platforms continue to accelerate market penetration across China, India, Japan, and Southeast Asia.
Latin America
Latin America captured 7.4% market share in 2024 in the Sponge and Scouring Pads Market, supported by rising urban populations and gradual improvement in hygiene standards. Growing demand from residential cleaning applications remains the primary growth driver, while commercial cleaning usage is expanding steadily across hospitality and foodservice sectors. Price sensitivity influences purchasing decisions, supporting demand for affordable and private label products. Expansion of modern retail formats and improving access to branded cleaning products are strengthening market presence across Brazil, Mexico, and other emerging Latin American economies.
Middle East & Africa
The Middle East & Africa region accounted for 4.6% market share in 2024 in the Sponge and Scouring Pads Market. Growth is supported by increasing awareness of cleanliness, expanding hospitality infrastructure, and rising investments in healthcare facilities. Urban development and tourism growth drive demand for commercial cleaning products, while household usage continues to rise gradually. The market remains price-sensitive, favoring cost-effective products, though demand for higher-quality cleaning tools is increasing in developed Gulf countries. Improving retail distribution and rising disposable incomes support long-term regional growth.
Market Segmentations:
By Product Type
By Material
By Application
- Household Cleaning
- Commercial Cleaning
- Automotive Cleaning
- Others (Glass Cleaning, Ceramic & Marble Cleaning, Etc)
By End-Use
- Residential
- Commercial
- Industrial
By Geography
- North America
- Europe
- Germany
- France
- U.K.
- Italy
- Spain
- Rest of Europe
- Asia Pacific
- China
- Japan
- India
- South Korea
- South-east Asia
- Rest of Asia Pacific
- Latin America
- Brazil
- Argentina
- Rest of Latin America
- Middle East & Africa
- GCC Countries
- South Africa
- Rest of the Middle East and Africa
Competitive Landscape
Competitive landscape analysis of the Sponge and Scouring Pads Market highlights the presence of established global manufacturers including 3M Company, Procter & Gamble Co., Reckitt Benckiser Group, Henkel AG & Co. KGaA, Kao Corporation, Freudenberg Group, Amway Corporation, Arix S.p.A., Libman Company, and Armaly Brands. These companies focus on product innovation, material enhancement, and brand positioning to strengthen market presence. Continuous introduction of durable, antibacterial, and surface-specific cleaning products supports differentiation in a price-sensitive market. Strong distribution networks across supermarkets, convenience stores, and e-commerce platforms provide broad consumer access and recurring sales volumes. Manufacturers increasingly emphasize sustainability through eco-friendly materials and recyclable packaging to align with regulatory and consumer expectations. Strategic pricing, private label partnerships, and regional expansion into high-growth emerging markets further intensify competition. Brand loyalty, performance reliability, and product availability remain key factors influencing purchasing decisions and long-term competitive positioning.
Key Player Analysis
- Libman Company
- Kao Corporation
- Reckitt Benckiser Group
- Arix S.p.A.
- Procter & Gamble Co.
- Armaly Brands
- Henkel AG & Co. KGaA
- 3M Company
- Amway Corporation
- Freudenberg Group
Recent Developments
- In April 2025, Scotch-Brite (3M) launched its “The Brite Side of Clean” campaign to promote its scrub sponges and cleaning pads by turning household cleaning into a joyful, feel-good experience.
- In September 2024, Scrub Daddy entered the Luxembourg market through a retail partnership with Cactus Supermarket, placing its sponges and scouring products on shelves from 9 September 2024.
- In March 2023, Scrub Daddy formed a global partnership with Unilever’s Cif brand to co-develop and distribute co-branded sponges and scouring pads, supporting Scrub Daddy’s international expansion.
Shape Your Report to Specific Countries or Regions & Enjoy 30% Off!
Report Coverage
The research report offers an in-depth analysis based on Product Type, Material, Application, End Use and Geography. It details leading market players, providing an overview of their business, product offerings, investments, revenue streams, and key applications. Additionally, the report includes insights into the competitive environment, SWOT analysis, current market trends, as well as the primary drivers and constraints. Furthermore, it discusses various factors that have driven market expansion in recent years. The report also explores market dynamics, regulatory scenarios, and technological advancements that are shaping the industry. It assesses the impact of external factors and global economic changes on market growth. Lastly, it provides strategic recommendations for new entrants and established companies to navigate the complexities of the market.
Future Outlook
- The Sponge and Scouring Pads Market will continue to benefit from rising hygiene awareness across residential and commercial environments.
- Increasing urbanization and smaller household sizes will drive frequent replacement and repeat purchases of cleaning products.
- Demand for durable and multi-purpose sponges will strengthen as consumers seek cost-effective cleaning solutions.
- Eco-friendly and biodegradable materials will gain higher adoption due to sustainability regulations and consumer preferences.
- Product innovation focused on antibacterial properties and surface protection will support premium segment growth.
- Expansion of hospitality, healthcare, and foodservice sectors will increase commercial cleaning consumption.
- Growth of e-commerce platforms will improve product accessibility and support higher sales volumes.
- Private label brands will expand their presence, intensifying price competition across regions.
- Emerging economies will witness faster demand growth driven by improving living standards and hygiene awareness.
- Manufacturers will focus on supply chain efficiency and material optimization to maintain margins in competitive markets.


