
Market Overview:
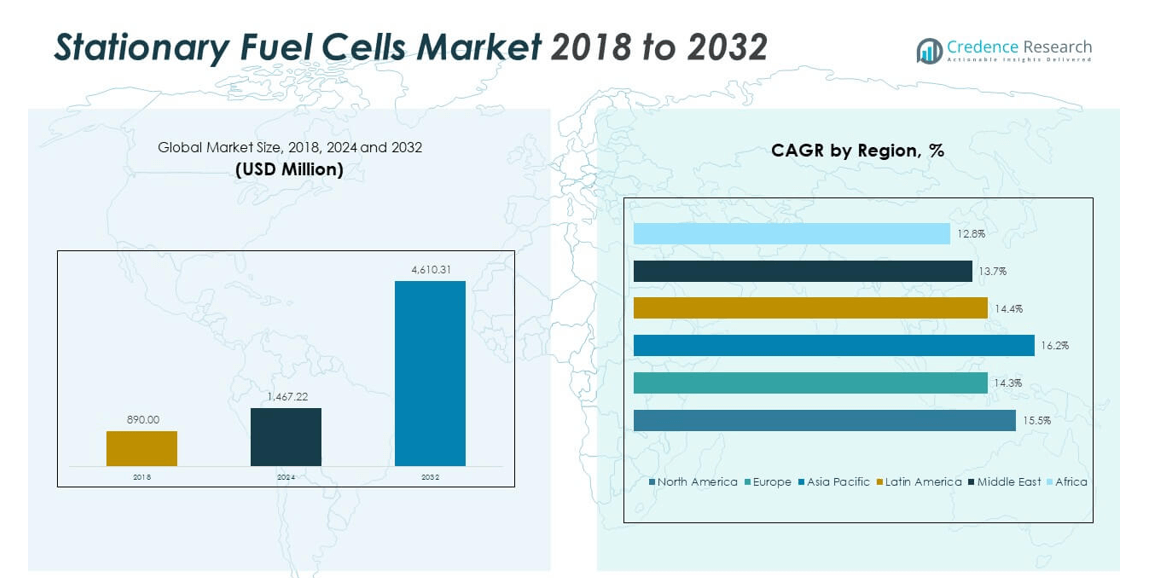
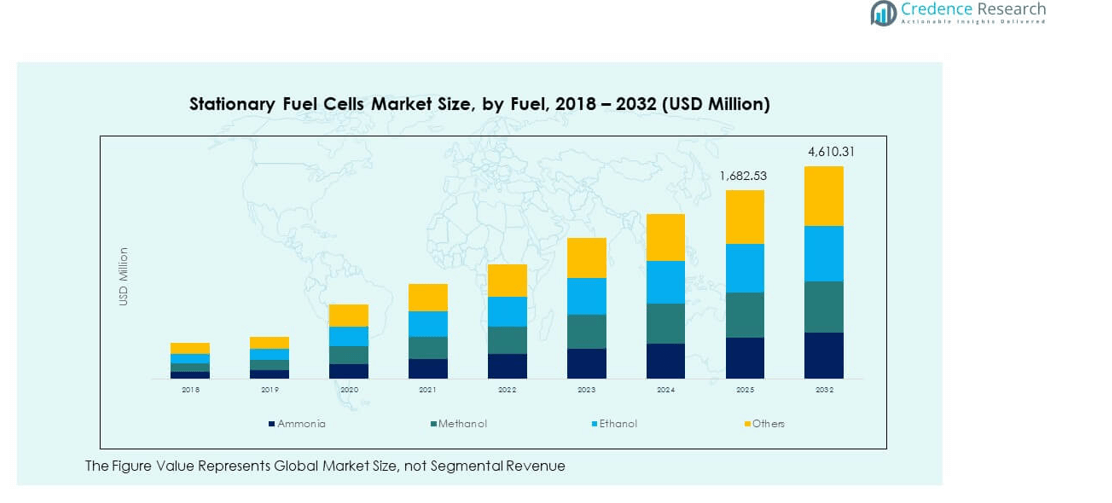
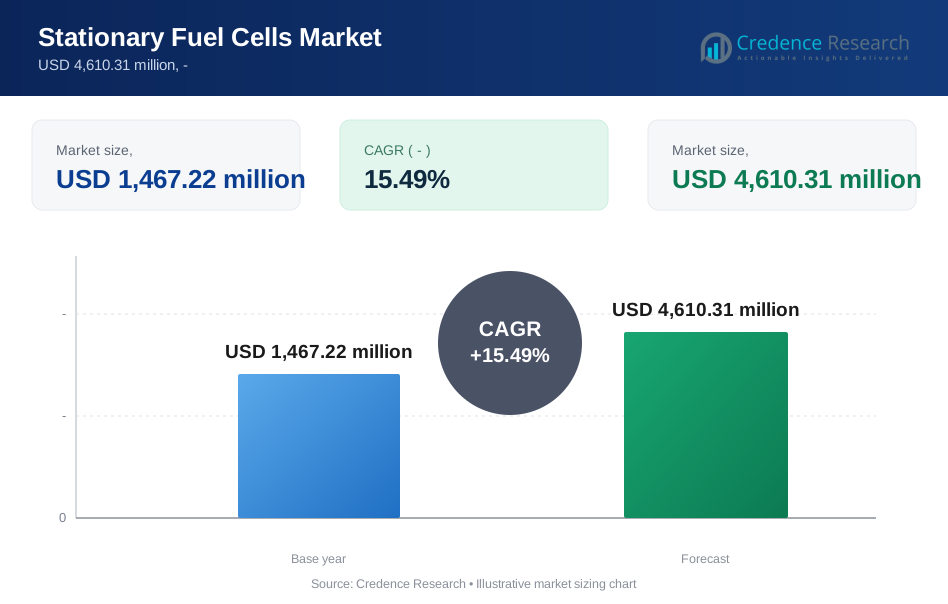
The Global Stationary Fuel Cells Market size was valued at USD 890.00 million in 2018 to USD 1,467.22 million in 2024 and is anticipated to reach USD 4,610.31 million by 2032, at a CAGR of 15.49% during the forecast period.
| REPORT ATTRIBUTE | DETAILS |
|---|---|
| Historical Period | 2020-2023 |
| Base Year | 2024 |
| Forecast Period | 2025-2032 |
| Stationary Fuel Cells Market Size 2024 | USD 1,467.22 million |
| Stationary Fuel Cells Market, CAGR | 15.49% |
| Stationary Fuel Cells Market Size 2032 | USD 4,610.31 million |
Market growth is driven by demand for reliable, low-emission power generation. Industries adopt stationary fuel cells for continuous and backup power needs. Utilities deploy systems to support grid stability and peak shaving. Data centers prefer fuel cells for high uptime and clean energy goals. Government policies encourage hydrogen and clean power adoption. Rising electricity demand strengthens interest in distributed generation. Advancements in fuel cell efficiency improve system performance. Falling component costs support wider commercial deployment.
North America leads due to early technology adoption and strong policy support. The United States drives demand across data centers and utilities. Europe follows with focus on decarbonization and energy security. Countries like Germany and the United Kingdom invest in hydrogen infrastructure. Asia Pacific emerges rapidly due to industrial growth. Japan and South Korea expand fuel cell installations. China increases focus on clean distributed power. Emerging regions adopt systems to improve grid reliability.
Market Insights:
- The market grew from USD 890.00 million in 2018 to USD 1,467.22 million in 2024 and will reach USD 4,610.31 million by 2032, at a CAGR of 15.49%, driven by demand for clean and reliable power.
- Asia Pacific leads with about 52.33% share due to strong government programs, followed by North America at 20.81% from data center demand and Europe at 16.48% supported by decarbonization policies.
- Asia Pacific remains the fastest-growing region with a 52.33% share, supported by industrial expansion, energy security needs, and large-scale fuel cell deployment programs.
- By fuel type, others and ethanol dominate the mix, together accounting for nearly 65% share, reflecting flexibility in fuel sourcing and wider regional adoption.
- Methanol and ammonia contribute the remaining share at roughly 35%, supported by established supply chains and growing interest in low-carbon fuel options.
Market Drivers:
Rising Demand For Reliable And Low-Emission Power Generation Systems
The Stationary Fuel Cells Market benefits from rising demand for stable power supply. Industries require uninterrupted electricity for critical operations. Fuel cells support continuous power with low emissions. Data centers depend on high-availability energy systems. Hospitals value reliability for life-critical equipment. Manufacturing plants seek solutions that reduce outage risks. Fuel cells align with sustainability targets. This demand supports steady market expansion.
- For instance, Bloom Energy has deployed solid oxide fuel cell systems exceeding 1 GW of cumulative installations worldwide, delivering uptime above 99.9% for data centers and hospitals.
Supportive Government Policies And Clean Energy Incentive Frameworks
Governments promote clean power through structured incentive programs. Subsidies reduce upfront capital pressure for adopters. Tax benefits attract private investments in fuel cell projects. National energy strategies support low-carbon technologies. Urban regulations favor cleaner onsite power solutions. Public sector procurement enables early deployments. Policy clarity improves long-term planning confidence. Regulatory support accelerates adoption.
- For instance, Japan’s ENE-FARM program has supported over 500,000 residential and small commercial fuel cell installations, driven by national decarbonization targets.
Growth Of Distributed Energy And Grid Resilience Requirements
Utilities focus on improving grid reliability and resilience. Distributed generation reduces dependence on central grids. Fuel cells support localized power production. Industrial users deploy onsite systems for backup needs. Microgrids integrate fuel cells for steady output. Extreme weather events raise resilience priorities. Fuel cells perform during grid failures. This driver supports decentralized energy adoption.
Technological Advancements Improving Efficiency And System Durability
Manufacturers enhance fuel cell stack efficiency. Improved designs lower operating costs over time. Extended lifecycles raise return on investment. Advanced materials improve thermal performance. Automation enhances system control accuracy. Modular engineering simplifies installation. Digital monitoring supports predictive maintenance. Technology progress sustains market growth.
Market Trends:
Increasing Integration Of Stationary Fuel Cells With Smart Energy Systems
Energy operators adopt intelligent power management platforms. Fuel cells integrate with smart grid architectures. Digital controls optimize load balancing. Real-time data improves operational decisions. Predictive analytics reduce downtime risks. Remote monitoring supports asset management. Smart systems improve energy efficiency. This trend reshapes deployment strategies.
- For instance, Mitsubishi Heavy Industries integrates fuel cell systems with digital energy management platforms that enable real-time performance monitoring and fault detection across industrial sites.
Shift Toward Modular And Scalable Fuel Cell Configurations
End users prefer scalable power solutions. Modular systems allow phased capacity expansion. Compact designs suit space-limited locations. Standardized units reduce installation time. Scalability supports demand variability. Operators gain flexibility in planning. Modular layouts reduce project risks. This trend supports wider adoption.
- For instance, Plug Power offers modular stationary fuel cell systems that scale from hundreds of kilowatts to multi-megawatt deployments using standardized stack designs.
Rising Adoption In Data Centers And Critical Infrastructure Facilities
Data centers seek clean and reliable power sources. Fuel cells meet uptime and emission goals. Financial institutions value continuous power availability. Healthcare facilities adopt systems for backup needs. Telecom sites require stable distributed power. Critical infrastructure prioritizes resilience. Fuel cells address these operational needs. This trend strengthens demand.
Growing Focus On Hydrogen-Based And Low-Carbon Fuel Sources
Energy transitions encourage cleaner fuel inputs. Hydrogen gains attention for decarbonization goals. Fuel flexibility improves system attractiveness. Low-carbon fuels reduce lifecycle emissions. Research improves hydrogen storage methods. Infrastructure development supports adoption. Cleaner fuels align with policy goals. This trend supports long-term growth.
Market Challenges Analysis:
High Initial Capital Investment And Infrastructure Complexity
The Global Stationary Fuel Cells Market faces cost-related barriers. High upfront system costs limit adoption. Balance-of-plant components add expenses. Installation requires specialized technical expertise. Fuel supply infrastructure remains limited. Financing challenges affect smaller users. Long payback periods raise concerns. Cost sensitivity slows project approvals.
Operational And Supply Chain Constraints Affecting Deployment
Fuel availability varies across regions. Hydrogen logistics require careful handling. Maintenance needs skilled personnel. Spare part availability impacts uptime. Supply chain disruptions affect component delivery. Standardization remains limited across vendors. Regulatory approvals take time. These challenges restrain market penetration.
Market Opportunities:
Expansion Of Clean Energy Projects Across Industrial And Commercial Sectors
The Global Stationary Fuel Cells Market can benefit from clean energy investments. Industries pursue low-emission power solutions. Commercial facilities adopt onsite generation systems. Corporate sustainability goals support adoption. Public-private projects expand deployment scope. Energy transition funding opens new projects. Fuel cells fit long-term decarbonization plans. This opportunity supports growth.
Emerging Demand From Developing Regions And Microgrid Applications
Developing regions seek reliable power access. Weak grid infrastructure increases demand for onsite systems. Fuel cells support remote and off-grid locations. Microgrids integrate fuel cells for stability. Industrial parks adopt decentralized energy models. Urban expansion raises power reliability needs. Technology transfer supports adoption. Emerging markets offer strong potential.
Market Segmentation Analysis:
By Type
Proton Exchange Membrane Fuel Cells hold strong adoption due to fast start-up and compact design. These systems suit commercial and backup power needs. Phosphoric Acid Fuel Cells support large-scale stationary installations with proven durability. Solid Oxide Fuel Cells gain attention for high efficiency and fuel flexibility in industrial settings. Molten Carbonate Fuel Cells serve utility-scale and combined heat and power projects. Other fuel cell types address niche power requirements and pilot deployments. The Global Stationary Fuel Cells Market reflects balanced demand across these technologies. Each type supports specific performance and cost priorities.
- For instance, Ceres Power’s solid oxide technology achieves electrical efficiency above 60% in industrial stationary applications..
By Application
Stationary applications dominate due to continuous power demand across industries. Data centers, hospitals, and manufacturing plants rely on fuel cells for stable electricity. Utilities deploy systems to strengthen distributed energy networks. Transportation and portable applications show selective adoption for auxiliary and remote power uses. These segments focus on flexibility and compact output. Application diversity supports steady market penetration. End users value reliability and low emissions.
- For instance, Ballard Power Systems historically deployed thousands of hydrogen and methanol-fueled backup modules for telecom networks globally, though the company has recently transitioned this technology to partners like SFC Energy and CHEM to focus on megawatt-scale stationary power for data centers.
By Fuel
Ammonia gains interest for easier storage and transport advantages. Methanol remains widely used due to established supply chains. Ethanol supports regions with strong biofuel production. Other fuels provide flexibility across diverse energy ecosystems. Fuel choice depends on availability and infrastructure. It supports regional customization of fuel cell deployments.
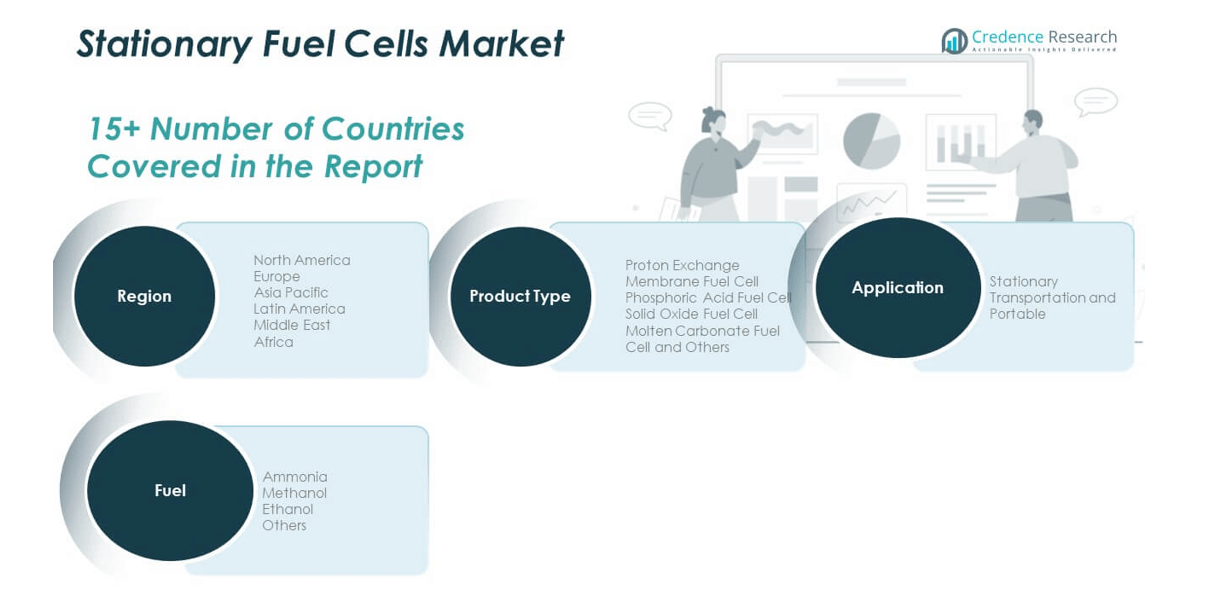
Segmentation:
- By Type
- Proton Exchange Membrane Fuel Cell
- Phosphoric Acid Fuel Cell
- Solid Oxide Fuel Cell
- Molten Carbonate Fuel Cell
- Others
- By Application
- Stationary
- Transportation and Portable
- By Fuel
- Ammonia
- Methanol
- Ethanol
- Others
- By Region
- North America
- U.S.
- Canada
- Mexico
- Europe
- Germany
- France
- U.K.
- Italy
- Spain
- Rest of Europe
- Asia Pacific
- China
- Japan
- India
- South Korea
- South-east Asia
- Rest of Asia Pacific
- Latin America
- Brazil
- Argentina
- Rest of Latin America
- Middle East & Africa
- GCC Countries
- South Africa
- Rest of the Middle East and Africa
- North America
Regional Analysis:
North America
The North America Global Stationary Fuel Cells Market size was valued at USD 189.57 million in 2018 to USD 306.05 million in 2024 and is anticipated to reach USD 959.41 million by 2032, at a CAGR of 15.5% during the forecast period. North America accounts for about 20.81% market share. The United States leads regional demand due to strong data center expansion. Utilities deploy fuel cells to improve grid resilience. Government incentives support clean energy adoption. Industrial facilities invest in onsite power solutions. Hospitals prefer fuel cells for reliable backup power. Technology maturity supports commercial confidence. Corporate sustainability goals strengthen adoption. Canada contributes through pilot and commercial projects.
Europe
The Europe Global Stationary Fuel Cells Market size was valued at USD 168.21 million in 2018 to USD 262.30 million in 2024 and is anticipated to reach USD 759.56 million by 2032, at a CAGR of 14.3% during the forecast period. Europe holds nearly 16.48% market share. Germany leads due to strong hydrogen strategies. The United Kingdom supports fuel cells for distributed power. France invests in clean energy infrastructure. Industrial decarbonization drives adoption. Power security concerns support onsite generation. Research programs improve system efficiency. Regional collaboration strengthens deployment. Policy alignment supports steady growth.
Asia Pacific
The Asia Pacific Global Stationary Fuel Cells Market size was valued at USD 432.54 million in 2018 to USD 728.98 million in 2024 and is anticipated to reach USD 2,412.58 million by 2032, at a CAGR of 16.2% during the forecast period. Asia Pacific commands about 52.33% market share. Japan leads through long-term fuel cell programs. South Korea expands installations across industries. China increases focus on distributed clean power. Rapid industrial growth drives demand. Energy security remains a key priority. Government backing supports large-scale deployment. Manufacturing capacity strengthens supply chains. Urbanization supports sustained growth.
Latin America
The Latin America Global Stationary Fuel Cells Market size was valued at USD 52.42 million in 2018 to USD 85.52 million in 2024 and is anticipated to reach USD 247.90 million by 2032, at a CAGR of 14.4% during the forecast period. Latin America represents about 5.38% market share. Brazil leads due to industrial energy demand. Power reliability issues support onsite solutions. Renewable integration encourages fuel cell adoption. Mining and manufacturing drive demand. Government programs support clean power trials. Infrastructure gaps create opportunity. Private investment remains selective. Growth remains steady across key economies.
Middle East
The Middle East Global Stationary Fuel Cells Market size was valued at USD 28.48 million in 2018 to USD 43.42 million in 2024 and is anticipated to reach USD 120.35 million by 2032, at a CAGR of 13.7% during the forecast period. The Middle East holds around 2.61% market share. GCC countries lead regional adoption. Energy diversification strategies support fuel cells. Industrial clusters demand reliable power. Hydrogen initiatives gain traction. Remote installations require stable energy supply. Government-backed projects support early deployment. Technology adoption remains gradual. Long-term plans drive interest.
Africa Regional Market Overview
The Africa Global Stationary Fuel Cells Market size was valued at USD 18.78 million in 2018 to USD 40.94 million in 2024 and is anticipated to reach USD 110.51 million by 2032, at a CAGR of 12.8% during the forecast period. Africa accounts for nearly 2.40% market share. South Africa leads through pilot projects. Grid instability increases demand for onsite power. Mining operations adopt fuel cells for reliability. Remote communities seek off-grid solutions. Clean energy goals support gradual adoption. Cost sensitivity affects deployment pace. International partnerships aid technology transfer. Growth remains emerging but promising.
Key Player Analysis:
- Horizon Fuel Cell Technologies
- Mitsubishi Heavy Industries
- ElringKlinger
- Hydrogenics
- SOLIDpower Italia
- Ceres Power
- Ballard Power Systems
- AVL
- Bosch
- Pragma Industries
- L. Gore & Associates
- Nedstack Fuel Cell Technology
- Proton Motor Fuel Cell GmbH
- Bloom Energy
- ITM Power
- Plug Power
- Nuvera Fuel Cells, LLC
Competitive Analysis:
The Global Stationary Fuel Cells Market features competition among established manufacturers and emerging technology providers. Leading companies focus on efficiency, durability, and system scalability. Product portfolios cover diverse power capacities and fuel options. Firms compete through technology upgrades and long-term service contracts. Strategic partnerships support regional expansion and customer access. Cost optimization remains a key competitive lever. Strong intellectual property positions protect core technologies. It rewards players with proven deployment experience. Market competition stays moderately consolidated.
Recent Developments:
- In August 2025, Horizon Fuel Cell Technologies executed a strategic acquisition of intellectual property from Hyzon Motors related to hydrogen-powered Class 8 and refuse trucks, marking a pivotal transition from component supplier to integrated solutions provider. The company secured a major commercial agreement in July 2025 with Shanghai Wuliu Automotive Technology to supply 100 advanced fuel cell systems for 42-ton heavy-duty trucks with over 1,500 km range. During the same period, Horizon signed a memorandum of understanding with Methanol Reformer to integrate its fuel cell technology with methanol reformer systems, targeting applications in marine and off-grid power sectors. In September 2025, the company sealed an exclusive 10-year partnership agreement with Bharat Heavy Electrical Ltd (BHEL) to co-develop and commercialize hydrogen fuel cell-powered locomotives for the Indian rail market. Horizon formally launched its latest integrated fuel cell system designed for heavy trucks and stationary power solutions at the 9th International Hydrogen and Fuel Cell Expo (CHFE 2025) in Foshan, China on October 22-24, 2025. The company had previously unveiled its VLS-IV 400kW PEM fuel cell in November 2024 and launched a 5MW Anion Exchange Membrane (AEM) electrolyser system in December 2024.
- Mitsubishi Heavy Industries demonstrated significant strategic diversification in hydrogen technology during 2025. In August 2025, the company launched a joint project with Honda and Tokuyama to power a data center using repurposed automotive fuel cells and by-product hydrogen, creating a new circular economy opportunity. Concurrently, Mitsubishi collaborated with Fuji Electric to develop a hydrogen fuel cell system using methanol as a hydrogen source, solving critical hydrogen distribution challenges for stationary power applications. The company achieved a critical milestone in April 2024 by launching a 400 kW test module for its Solid Oxide Electrolyzer Cell (SOEC), demonstrating impressive electrolytic efficiency of 3.5 kWh/Nm³. Mitsubishi Fuso entered discussions with Iwatani Corporation to develop subcooled liquid hydrogen (sLH2) refueling technology, signaling the company's commitment to addressing hydrogen transportation challenges for heavy-duty mobility.
- In June 2025, Pragma Industries signed a strategic agreement with HPQ and Novacium to evaluate the integration of METAGENE green hydrogen production stations into its mobility ecosystems. The METAGENE technology enables autonomous, high-pressure hydrogen production using a non-explosive aluminum-silicon alloy, generating 1.25 m³ of hydrogen per kilogram without requiring electricity or costly storage infrastructure. A pilot phase is planned between late 2025 and early 2026, with operational testing aimed at validating production capacity of 10 kilograms of hydrogen per day to power fleets of hydrogen vehicles and drones. Pragma Industries is also involved in the MANGABHY project, which aims to develop specialized fuel cell technology for drone applications.
Report Coverage:
The research report offers an in-depth analysis based on Type, Application, Fuel, and Region segments. It details leading market players, providing an overview of their business, product offerings, investments, revenue streams, and key applications. Additionally, the report includes insights into the competitive environment, SWOT analysis, current market trends, as well as the primary drivers and constraints. Furthermore, it discusses various factors that have driven market expansion in recent years. The report also explores market dynamics, regulatory scenarios, and technological advancements that are shaping the industry. It assesses the impact of external factors and global economic changes on market growth. Lastly, it provides strategic recommendations for new entrants and established companies to navigate the complexities of the market.
Future Outlook:
- The market will expand as industries adopt cleaner and more reliable onsite power systems.
- Data centers will increase fuel cell use to support uptime and sustainability goals.
- Government policies will continue to encourage low-emission power generation technologies.
- Hydrogen infrastructure development will strengthen long-term fuel availability.
- Utilities will deploy fuel cells to enhance grid resilience and distributed energy networks.
- Technology improvements will raise system efficiency and operational lifespan.
- Manufacturing scale-up will help reduce overall system costs.
- Emerging economies will adopt stationary fuel cells to address power reliability gaps.
- Strategic partnerships will accelerate regional deployment and market access.
- The market will benefit from rising private and public investment interest.
Request a Free Sample
Fill in your details and we'll send you a free sample report.
- Sample data tables & charts
- Research methodology
Need a Custom Version of This Report?
Tailor the scope, geography, or segments to your exact requirements.
- Custom geography or segment scope
- Direct access to our analyst team
Frequently Asked Questions
What is the current market size for the stationary fuel cell market, and what is its projected size in 2032?
At what Compound Annual Growth Rate is the stationary fuel cell market projected to grow between 2025 and 2032?
Which stationary fuel cell market segment held the largest share in 2024?
What are the primary factors fueling the growth of the stationary fuel cell market?
Who are the leading companies in the stationary fuel cell market?
Table of Content
Chapter 1. Report Introduction
- 1.1 Report Description & Purpose
- 1.1.1 Report Title & Market Definition
- 1.1.2 Unique Selling Propositions (USP) & Key Differentiators
- 1.1.3 Value Proposition for Stakeholders
- 1.2 Research Objectives
- 1.2.1 Market Sizing Objectives (Volume & Revenue)
- 1.2.2 Segmentation Objectives
- 1.2.3 Competitive Intelligence Objectives
- 1.2.4 Forecast & Scenario Objectives
- 1.3 Report Scope
- 1.3.1 Stationary Fuel Cells Scope – Types & Subtypes Covered
- 1.3.2 Geographic Scope – Regions & Countries Covered
- 1.3.3 Historical Period, Base Year & Forecast Period (the historical period; forecast to the forecast period)
- 1.3.4 Inclusions & Exclusions
- 1.4 HS Code & Classification Framework
- 1.5 Currency, Units & Pricing Basis
- 1.6 Target Stakeholders
- 1.7 Limitations & Assumptions
Chapter 2. Executive Summary
- 2.1 Global Stationary Fuel Cells Market Snapshot
- 2.1.1 Market Size – Historical (the historical period) & Forecast (the forecast period) (base year: USD 1,467.22 million → forecast year: USD 4,610.31 million)
- 2.1.2 Volume & Revenue – Global Totals
- 2.1.3 Key Market Highlights – Top Five Facts
- 2.2 Stationary Fuel Cells Market Segmentation Snapshot
- 2.2.1 Market Split by Region – vs.
- 2.3 Competitive Snapshot
- 2.3.1 Top 10 Players by Revenue Share –
- 2.3.2 Top 10 Players by Volume Share –
- 2.3.3 Recent Strategic Developments (18-Month Summary)
- 2.4 Key Investment Highlights & Strategic Conclusions
Chapter 3. Stationary Fuel Cells Market Dynamics & Industry Analysis
- 3.1 Market Overview & Context
- 3.1.1 Stationary Fuel Cells Market Position in the Broader Automotive Value Chain
- 3.1.2 OEM vs. Replacement Market Dynamics
- 3.1.3 Market Maturity & Development Stage by Region
- 3.2 Stationary Fuel Cells Market Drivers
- 3.3 Stationary Fuel Cells Market Restraints & Challenges
- 3.4 Stationary Fuel Cells Market Opportunities
- 3.5 Porter's Five Forces Analysis
- 3.5.1 Threat of New Entrants
- 3.5.2 Bargaining Power of Suppliers
- 3.5.3 Bargaining Power of Buyers
- 3.5.4 Threat of Substitutes
- 3.5.5 Competitive Rivalry – Intensity Assessment
- 3.6 Stationary Fuel Cells Value Chain Analysis
- 3.6.1 Upstream – Raw Material/Input Suppliers
- 3.6.1.1 Raw Material/Input 1
- 3.6.1.2 Raw Material/Input 2
- 3.6.1.3 Raw Material/Input 3
- 3.6.2 Midstream – Production/Manufacturing/Service Delivery
- 3.6.2.1 Production/Process Overview
- 3.6.2.2 Key Facility Locations & Capacity by Manufacturer
- 3.6.3 Downstream – Distribution & End Consumer
- 3.6.3.1 Primary Channel – B2B/OEM
- 3.6.3.2 Secondary Channels – Dealer, Retail, Online, Direct
- 3.6.4 Value Chain Profitability Analysis
- 3.6.1 Upstream – Raw Material/Input Suppliers
- 3.7 PESTEL Analysis
- 3.7.1 Political Factors
- 3.7.2 Economic Factors
- 3.7.3 Social Factors
- 3.7.4 Technological Factors
- 3.7.5 Environmental Factors
- 3.7.6 Legal Factors
- 3.8 Stationary Fuel Cells Supply Chain Analysis
- 3.8.1 Raw Material/Input Supply Risk Assessment
- 3.8.2 Manufacturing Concentration Risk (Geographic Exposure)
- 3.8.3 Trade Disruption Impact Analysis
- 3.9 Regulatory & Policy Landscape
Note: The regulatory and policy landscape section covers regulations based on their applicability to the market, Stationary Fuel Cells category, geography, and scope of the study. Only regulatory frameworks with a material impact on operations, compliance, trade, sustainability, or market access are analyzed in detail.
Chapter 4. Key Investment Pockets & Opportunity Analysis
- 4.1 Stationary Fuel Cells Market Attractiveness Analysis
- 4.1.1 By Region – Investment Attractiveness Matrix (Volume × CAGR)
- 4.2 Absolute Revenue Growth Opportunity
- 4.2.1 By Region – Absolute USD Growth Through the forecast period
- 4.3 Incremental Volume Opportunity
- 4.3.1 By Region – Incremental Volume Through the forecast period
- 4.3.2 Segment – Incremental Volume
- 4.4 Emerging Submarket Opportunity Deep Dive (Subject to Applicability)
- 4.5 Emerging Market Opportunity Scorecards
- 4.5.1 United States
- 4.5.2 Europe
- 4.5.3 Asia
- 4.5.4 Middle East & Africa
Note: Emerging Market Opportunity Scorecards will be included based on relevance and strategic importance. Regions listed are indicative and may vary depending on data availability and market dynamics.
Chapter 5. Stationary Fuel Cells Import-Export Analysis & Trade Flows
- 5.1 Global Trade Overview
- 5.1.1 Global Export Value by Country (the historical period)
- 5.1.2 Global Export Volume by Country (the historical period)
- 5.1.3 Global Import Value by Country (the historical period)
- 5.1.4 Global Import Volume by Country (the historical period)
- 5.1.5 Net Trade Balance by Country (the historical period)
- 5.2 Export Analysis – Segment
- 5.2.1 Type 1 (HS Code)
- 5.2.2 Type 2 (HS Code)
- 5.2.3 Type 3 (HS Code)
- 5.2.4 Type 4 (HS Code)
- 5.2.5 Type 5 (HS Code)
- 5.3 Import Analysis – Segment
- 5.3.1 Type 1 (HS Code)
- 5.3.2 Type 2 (HS Code)
- 5.3.3 Type 3 (HS Code)
- 5.3.4 Type 4 (HS Code)
- 5.3.5 Type 5 (HS Code)
- 5.4 Average Unit Trade Prices
- 5.4.1 Average Export Price – Segment & Country
- 5.4.2 Average Import Price – Segment & Source Country
- 5.4.3 Price Trends (the historical period)
- 5.5 Key Trade Route Analysis
- 5.5.1 Trade Route 1
- 5.5.2 Trade Route 2
- 5.5.3 Trade Route 3
- 5.5.4 Trade Route 4
- 5.5.5 Trade Route 5
- 5.6 Trade Policy Impact Assessment
- 5.6.1 US Anti-Dumping & Section 301 Tariffs
- 5.6.2 EU Customs Union Impact
- 5.6.3 Major Free Trade Agreements
- 5.6.4 USMCA Rules of Origin
Note: Trade policy analysis will be included only where relevant to the Stationary Fuel Cells market.
Chapter 6. Competitive Landscape & Company Benchmarking
- 6.1 Stationary Fuel Cells Market Concentration & Structure
- 6.1.1 Herfindahl-Hirschman Index (HHI) – vs.
- 6.1.2 Tier 1, Tier 2 & Tier 3 Market Structure
- 6.1.3 Global, Regional & Local Player Dynamics
- 6.2 Stationary Fuel Cells Market Share Analysis –
- 6.2.1 Global Revenue Share by Company
- 6.2.2 Global Volume Share by Company
- 6.2.3 Regional Revenue Share
- 6.2.4 Market Share Evolution ( vs. )
- 6.2.5 OEM Segment Share by Company
- 6.2.6 Replacement Segment Share by Company
- 6.3 Production/Delivery Capacity & Facility Analysis
- 6.3.1 Global Installed Capacity
- 6.3.2 Capacity Utilization Rates
- 6.3.3 Production/Output Volume
- 6.3.4 Facility Locations & Capacity Map
- 6.3.5 Planned Capacity Additions
- 6.4 Stationary Fuel Cells Competitive Benchmarking Matrix
- 6.4.1 Revenue, Volume, CAGR & Profitability Comparison
- 6.4.2 Channel Revenue Mix
- 6.4.3 Geographic Revenue Exposure
- 6.4.4 R&D Intensity
- 6.4.5 Sustainability Maturity
- 6.5 Strategic Developments in Stationary Fuel Cells (Last 24 Months)
- 6.5.1 Mergers, Acquisitions & Divestments
- 6.5.2 New Stationary Fuel Cells Launches
- 6.5.3 Facility Expansions
- 6.5.4 Strategic Alliances, Joint Ventures & Partnerships
- 6.5.5 Distribution Expansion & Market Entry
- 6.5.6 Sustainability & ESG Initiatives
- 6.6 Competitive Strategy Mapping
- 6.6.1 Leader, Challenger, Follower & Niche Classification
- 6.6.2 Pricing Strategy Comparison
- 6.6.3 Channel Strategy Matrix
Note: Strategic developments are included based on their materiality and the availability of reliable information.
Chapter 7. Global Stationary Fuel Cells Market – By Distribution Channel
- 7.1 Segment Overview
- 7.1.1 Volume & Revenue Split by Channel ( & )
- 7.1.2 Channel Mix Evolution (the forecast period)
Chapter 8. Regional Market Analysis – Global Overview
- 8.1 Global Regional Overview
- 8.1.1 Regional Volume Share
- 8.1.2 Regional Revenue Share
- 8.1.3 Regional Volume by Region
- 8.1.4 Regional Revenue by Region
- 8.1.5 Regional Forecast Through the forecast period
- 8.2 Cross-Regional Segment Analysis
- 8.2.1 By Distribution Channel
- 8.2.2 By Brand/Price Tier
Chapter 9. North America Stationary Fuel Cells Market
- 9.1 United States
- 9.2 Canada
- 9.3 Mexico
Chapter 10. Europe Stationary Fuel Cells Market
- 10.1 Germany
- 10.2 France
- 10.3 Italy
- 10.4 United Kingdom
- 10.5 Spain
- 10.6 Poland
- 10.7 Russia
- 10.8 Netherlands
- 10.9 Belgium
- 10.10 Sweden
- 10.11 Denmark
- 10.12 Norway
- 10.13 Rest of Europe
Chapter 11. Asia Pacific Stationary Fuel Cells Market
- 11.1 China
- 11.2 India
- 11.3 Japan
- 11.4 South Korea
- 11.5 Thailand
- 11.6 Indonesia
- 11.7 Vietnam
- 11.8 Malaysia
- 11.9 Australia
- 11.10 Rest of Asia Pacific
Chapter 12. Latin America Stationary Fuel Cells Market
- 12.1 Brazil
- 12.2 Argentina
- 12.3 Colombia
- 12.4 Chile
- 12.5 Rest of Latin America
Chapter 13. Middle East Stationary Fuel Cells Market
- 13.1 Saudi Arabia
- 13.2 United Arab Emirates
- 13.3 Turkey
- 13.4 Israel
- 13.5 Iran
- 13.6 Rest of the Middle East
Chapter 14. Africa Stationary Fuel Cells Market
- 14.1 South Africa
- 14.2 Egypt
- 14.3 Nigeria
- 14.4 Morocco
- 14.5 Rest of Africa
Chapter 15. Stationary Fuel Cells Company Profiles
- 15.1 [Company 01]
- 15.1.1 Company Overview
- 15.1.2 Key Management Personnel
- 15.1.3 Products & Services Portfolio
- 15.1.4 Financial Performance
- 15.1.5 Key Market Focus & Geographic Presence
- 15.1.6 Recent Developments & Strategic Initiatives
Note: The company profile list is preliminary and may change based on research findings, market developments, data availability, and client requirements.
Chapter 16. Appendices
- Appendix A – List of Abbreviations & Acronyms
- Appendix B – Industry Classification Code Reference – Full Series
- Appendix C – Production & Capacity Data Tables
- Appendix D – End-Use & Demand Base Tables
- Appendix E – Consumption & Replacement Rate Assumptions
- Appendix F – ASP Reference Tables
- Appendix G – Manufacturing & Facility Database
- Appendix H – Import-Export Data Tables
- Appendix I – Regulatory Summary Tables
- Appendix J – Primary Research Participant List (Anonymized)
- Appendix K – Primary Research Questionnaire Framework
- Appendix L – Data Sources & Bibliography
- Appendix M – Market Size Divergence & Source Comparison
Chapter 17. Research Methodology
- 17.1 Research Framework & Philosophy
- 17.2 Secondary Research – Sources, Hierarchy & Data Extraction
- 17.3 Data Modeling – Bottom-Up & Top-Down Market Sizing
- 17.4 Primary Research – Stakeholder Framework, LOI & Sample Sizes
- 17.5 Forecast Methodology – Regression, Scenario & Sensitivity Analysis
- 17.6 Quality Control – Four-Layer Validation Framework
- 17.7 Limitations & Standard Assumptions
- 17.8 Disclaimer
