
Market Overview:
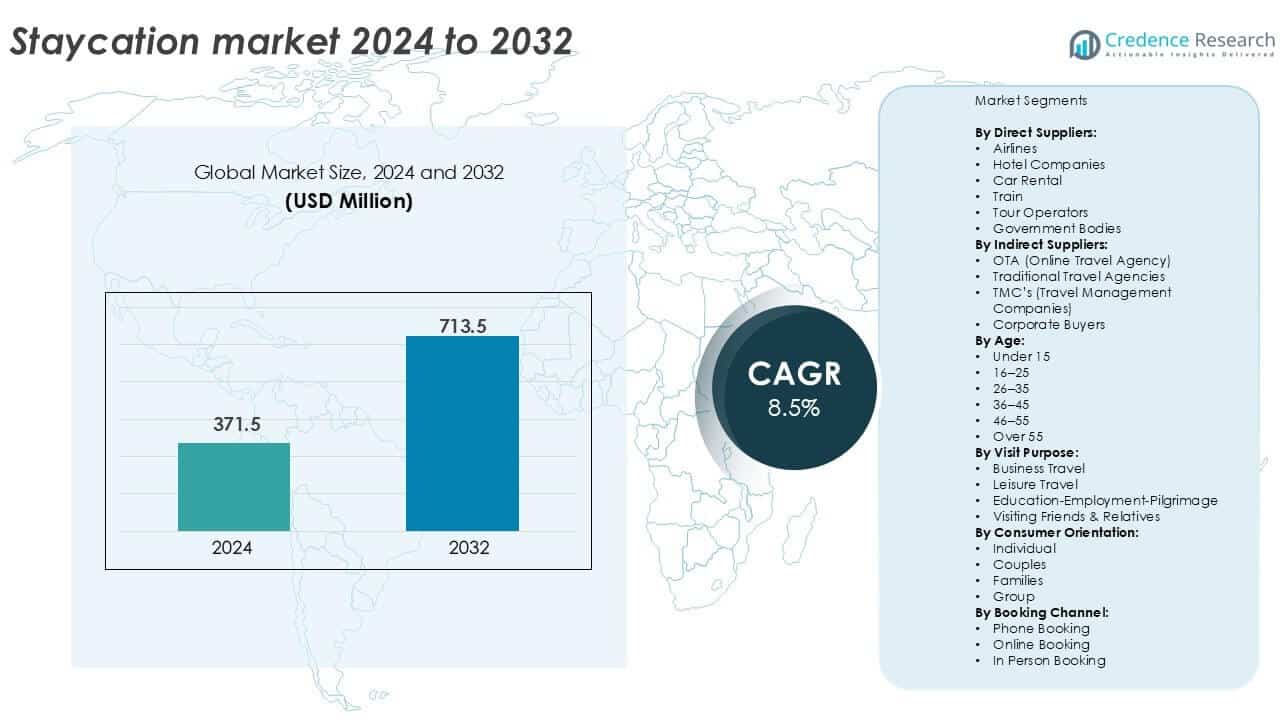
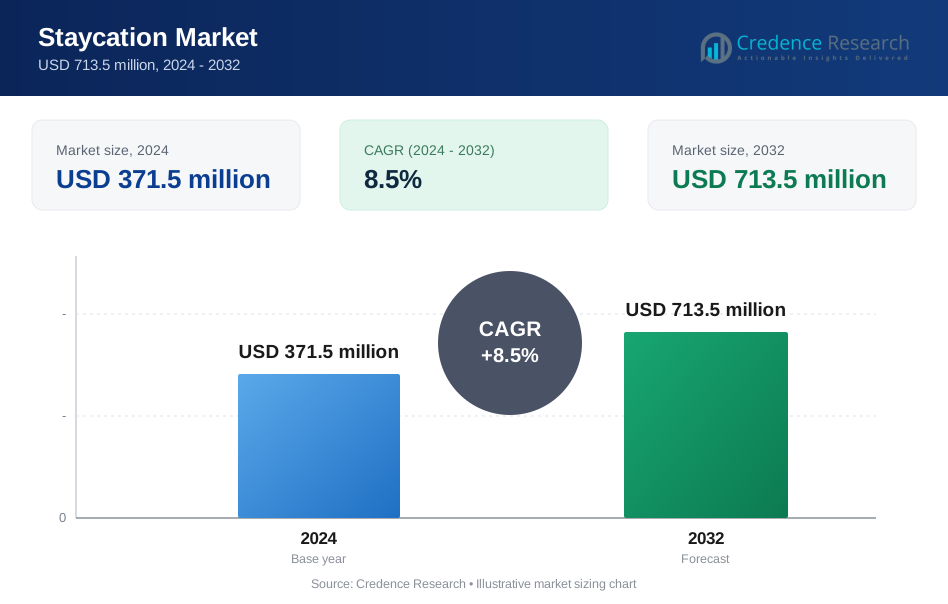
The staycation market size was valued at USD 371.5 million in 2024 and is anticipated to reach USD 713.5 million by 2032, at a CAGR of 8.5% during the forecast period.
| REPORT ATTRIBUTE | DETAILS |
|---|---|
| Historical Period | 2020-2023 |
| Base Year | 2024 |
| Forecast Period | 2025-2032 |
| Staycation Market Size 2024 | USD 371.5 million |
| Staycation Market, CAGR | 5.7% |
| Staycation Market Size 2032 | USD 19515 million |
The staycation market is led by key players such as Airbnb, Booking.com, Expedia Group, Marriott International, Hilton Worldwide, Accor, and Hyatt Hotels Corporation. These companies leverage strong digital platforms, loyalty programs, and local experience-based packages to attract domestic travelers. Airbnb dominates the peer-to-peer segment, while Booking.com and Expedia Group lead OTA bookings with real-time price transparency and wide accommodation listings. Hotel chains like Marriott and Hilton focus on premium staycation bundles and wellness offerings. Regionally, North America leads the staycation market with a 35% share in 2024, driven by robust infrastructure, high digital adoption, and frequent short-distance travel trends. Europe follows closely with 28%, supported by rail connectivity and local tourism initiatives.
Market Insights
- The staycation market reached USD 371.5 million in 2024 and is projected to hit USD 713.5 million by 2032, growing at a CAGR of 8.5%.
- A key driver includes the rising demand for short-distance travel due to cost savings, time constraints, and ease of planning.
- A major trend is the integration of wellness, work-from-hotel formats, and personalized packages by hotels to boost local engagement and repeat visits.
- North America led the market with a 35% share in 2024, followed by Europe at 28% and Asia Pacific at 22%, with hotel companies capturing over 40% of the direct supplier segment.
- Market restraints include price sensitivity among consumers, repeat visit fatigue, and limited novelty in nearby destinations which may affect long-term engagement.
Market Segmentation Analysis:
By Direct Suppliers
Hotel companies dominate the staycation market among direct suppliers, accounting for over 40% of the market share in 2024. Their established presence, flexible booking policies, and growing focus on local experiences drive strong engagement. Hotels have adapted by offering weekend packages, wellness retreats, and family-friendly deals to attract local travelers. Airlines and car rentals show lower participation, with fewer travelers opting for air travel during short-distance stays. Government bodies also play a role by promoting local tourism through subsidies and advertising campaigns aimed at boosting regional economies.
- For instance, Marriott International expanded its 'Work Anywhere' program to offer Day Pass and Stay Pass options at approximately 2,000 properties within its global portfolio of over 9,300 hotels. These programs enable same-day bookings and provide guest access to on-site amenities such as high-speed Wi-Fi, pools, fitness centers, and private workspaces.
By Indirect Suppliers
OTA platforms lead the indirect supplier segment, capturing nearly 55% market share in 2024. Their dominance stems from convenience, dynamic pricing, and wide accessibility through mobile apps. OTAs offer bundled staycation packages, last-minute discounts, and curated local experiences, appealing to digital-native consumers. Traditional travel agencies and TMCs lag behind due to limited digital transformation and higher service costs. Corporate buyers contribute moderately through localized wellness and team-building retreats, but the segment remains driven by leisure preferences and online booking habits.
- For instance, Booking.com lists over 28 million accommodation units globally and supports same-day booking functionality across its mobile app, allowing users to reserve local stays within a few hours of check-in time.
By Age
The 26–35 age group holds the largest share in the staycation market, accounting for around 30% in 2024. This group favors short breaks, digital booking, and unique experiences over long holidays. Higher disposable income and a desire for wellness, nature, and work-life balance drive frequent local travel. The 16–25 age group follows, supported by flexible college schedules and preference for budget-friendly getaways. While over-55 consumers show slower adoption, targeted wellness and cultural staycation offers are beginning to gain traction in this demographic.
Key Growth Drivers
Rising Preference for Short-Distance Travel
Consumers increasingly prefer short-distance travel due to time and budget limits. Staycations reduce travel fatigue and planning complexity. Urban professionals favor nearby hotels for weekend breaks. Families choose local destinations to manage children and elder needs. This shift supports frequent but shorter trips. Reduced transport costs improve overall travel affordability. Local travel also lowers weather and border-related risks. Hotels respond with flexible check-in and short-stay pricing. Proximity enables repeat visits within a year. This driver strengthens demand across metropolitan and tier-two cities. Work schedule pressure further supports short leisure breaks. The staycation market benefits from predictable demand cycles. Local familiarity builds consumer confidence. Safety perception also remains higher for nearby travel. These factors together sustain steady market expansion.
- For instance, Accor offers a 'Room for a Day' solution across many of its 5,700+ properties worldwide. This service allows guests to book rooms for single-day use typically between 9 a.m. and 9 p.m. at a discounted rate, providing full access to hotel amenities such as pools, fitness centers, and high-speed Wi-Fi.
Expansion of Hotel-Centric Experience Packages
Hotels actively redesign offerings to attract local travelers. Properties bundle spa, dining, and wellness services. Experience-led packages replace traditional room-only pricing. Family-friendly amenities increase household participation. Couples favor themed stays and curated dining experiences. Hotels promote seasonal and festival-based offers. Flexible cancellation policies reduce booking hesitation. Loyalty programs encourage repeat local visits. Digital promotions reach nearby residents effectively. These strategies raise occupancy during off-peak periods. Revenue optimization improves without long-haul dependence. Hotels also collaborate with local attractions. This collaboration enhances perceived value. Experience packaging positions hotels as leisure destinations. The staycation market gains from this supplier-led innovation.
- For instance, Taj Hotels rolled out curated staycation packages across over 90 Indian properties, combining accommodation with spa sessions, multi-course dining, and cultural experiences, which are available for booking through its official website and the Tata Neu app, and are part of the benefits offered via its NeuPass loyalty program.
Digital Booking Convenience and Price Transparency
Online platforms simplify staycation planning. Consumers compare prices in real time. Mobile apps support quick weekend decisions. Dynamic pricing attracts cost-sensitive travelers. Reviews and ratings guide hotel selection. Flash sales encourage impulse bookings. Digital wallets and EMI options improve affordability. Hotels gain visibility beyond traditional channels. Personalized recommendations increase conversion rates. Data-driven marketing targets local users efficiently. Reduced booking friction raises transaction volumes. OTA-led promotions dominate short-stay bookings. Transparency builds consumer trust. Ease of access supports frequent travel behavior. The staycation market benefits from strong digital infrastructure.
Key Trend & Opportunities
Growth of Wellness and Mental Health Stays
Wellness-focused staycations gain strong traction. Urban stress increases demand for relaxation-oriented breaks. Hotels add yoga, meditation, and spa programs. Mental health awareness shapes travel choices. Short wellness retreats fit busy schedules. Solo travelers seek calm and privacy. Corporate employees use wellness stays for burnout recovery. This trend supports premium pricing models. Properties near nature benefit most. Wellness branding differentiates hotel offerings. Repeat visits increase due to habit formation. Local wellness travel reduces long vacation dependency. This trend creates long-term revenue opportunities. The staycation market aligns well with lifestyle wellness priorities.
- For instance, Six Senses Hotels Resorts Spas operates wellness programs across more than 20 global properties, offering guided meditation sessions lasting 45 minutes and integrated spa treatments delivered by trained practitioners certified under its internal wellness standards.
Work-from-Hotel and Hybrid Stay Formats
Remote work changes travel behavior. Professionals combine work and leisure locally. Hotels upgrade Wi-Fi and workspace facilities. Weekday occupancy improves through hybrid stays. Long-weekend extensions become common. Quiet environments support productivity. Employers accept flexible work locations. This trend attracts mid-career professionals. Hotels design work-friendly room layouts. F&B services support extended stays. Pricing models adjust for longer durations. Urban hotels gain new demand streams. Hybrid stays reduce seasonality effects. The staycation market benefits from evolving work culture.
Key Challenges
Limited Destination Novelty for Repeat Travelers
Repeat staycation users seek new experiences. Nearby destinations offer limited variation. Experience fatigue can reduce revisit rates. Hotels must refresh themes regularly. High innovation costs pressure margins. Smaller properties face differentiation challenges. Consumers compare value closely over time. Lack of novelty affects younger travelers more. Seasonal dependence increases demand volatility. Local attractions may lack scale. This challenge restricts long-term engagement. Marketing efforts require constant updates. Without innovation, loyalty weakens. Addressing novelty remains critical. The staycation market must evolve experience depth.
Price Sensitivity and Discount Dependence
Staycation demand shows high price sensitivity. Consumers expect frequent discounts. Heavy promotions reduce profit margins. OTAs intensify price competition among hotels. Value perception dominates booking decisions. Premium positioning becomes difficult. Smaller hotels struggle with commission costs. Discount-led demand lacks long-term loyalty. Sudden price increases reduce bookings. Inflation impacts discretionary spending. Hotels balance affordability and profitability carefully. Cost pressures affect service quality. Managing price expectations remains complex. This challenge impacts revenue stability. The staycation market faces ongoing pricing pressure.
Regional Analysis
North America
North America holds a significant share of the global staycation market, accounting for around 35% in 2024. The U.S. dominates due to strong domestic travel infrastructure, high disposable incomes, and wide hotel coverage in urban and suburban regions. Millennials and Gen Z travelers drive short-trip demand through online bookings. Staycation campaigns by hotel chains and local tourism boards support city-based leisure travel. Canada also shows growing interest, especially in nature-focused staycations near lakes and national parks. Frequent public holidays and hybrid work culture further support weekend travel across key metropolitan hubs in the region.
Europe
Europe captures approximately 28% of the staycation market, led by the UK, Germany, France, and Spain. The UK alone contributes over 10% due to sustained interest in countryside retreats and coastal getaways. Government-supported tourism campaigns, such as "Escape the Everyday," boosted local travel after COVID-19. High-speed rail networks and inter-city connectivity support short-distance trips across borders. Budget-conscious travelers favor domestic over international holidays. Historic towns, wellness resorts, and rural retreats attract mid- and high-income groups. Sustainability awareness and eco-tourism initiatives further strengthen regional staycation preferences across Central and Western Europe.
Asia Pacific
Asia Pacific commands nearly 22% of the global staycation market, with strong momentum from China, Japan, South Korea, and India. China leads the regional share due to urban middle-class demand for luxury hotel stays and cultural retreats. India and Southeast Asia witness growth in tier-1 and tier-2 cities driven by budget-friendly weekend trips. Hotel chains in Japan and South Korea promote wellness and tech-enabled urban staycations. Mobile-first users fuel OTA-led growth. Regional governments promote local tourism as part of economic recovery plans. Population density and rising disposable income make Asia Pacific a fast-evolving staycation hub.
Latin America
Latin America contributes around 7% to the global staycation market, with Brazil and Mexico being the largest contributors. Urban populations prefer weekend leisure stays within city limits or short drives to coastal or eco-tourism areas. Economic constraints and rising fuel costs increase demand for local travel over international trips. Digital platforms promote regional tourism experiences to younger demographics. Hotel chains in Mexico City, São Paulo, and Rio de Janeiro customize offers for local residents. Cultural tourism, nature trails, and wellness resorts gain traction. The segment is gradually formalizing as infrastructure and digital access improve.
Middle East & Africa
The Middle East & Africa hold a smaller share, around 5% of the global staycation market, but show high growth potential. The UAE leads with aggressive staycation promotions across Dubai and Abu Dhabi. Luxury hotels offer curated experiences for local residents, especially during summer and long weekends. Saudi Arabia’s domestic tourism initiatives also boost internal travel. In Africa, South Africa sees growing interest in wildlife and countryside retreats. However, limited infrastructure and pricing constraints affect broader adoption. Government-led tourism recovery plans and digital adoption are expected to expand the staycation trend in this region.
Market Segmentations:
By Direct Suppliers
- Airlines
- Hotel Companies
- Car Rental
- Train
- Tour Operators
- Government Bodies
By Indirect Suppliers
- OTA (Online Travel Agency)
- Traditional Travel Agencies
- TMC’s (Travel Management Companies)
- Corporate Buyers
By Age
- Under 15
- 16–25
- 26–35
- 36–45
- 46–55
- Over 55
By Visit Purpose
- Business Travel
- Leisure Travel
- Education-Employment-Pilgrimage
- Visiting Friends & Relatives
By Consumer Orientation
- Individual
- Couples
- Families
- Group
By Booking Channel
- Phone Booking
- Online Booking
- In Person Booking
By Tour Type
- Independent Traveler
- Package Traveler
- Tour Group
By Tourism Type
- Domestic
- International
By Geography
- North America
- U.S.
- Canada
- Mexico
- Europe
- Germany
- France
- U.K.
- Italy
- Spain
- Rest of Europe
- Asia Pacific
- China
- Japan
- India
- South Korea
- South-east Asia
- Rest of Asia Pacific
- Latin America
- Brazil
- Argentina
- Rest of Latin America
- Middle East & Africa
- GCC Countries
- South Africa
- Rest of the Middle East and Africa
Competitive Landscape
The staycation market features a diverse competitive landscape, combining global hotel chains, online travel agencies (OTAs), and peer-to-peer accommodation platforms. Airbnb, Booking.com, and Expedia Group dominate online booking channels through dynamic pricing, personalized offers, and mobile accessibility. Hotel giants like Marriott International, Hilton Worldwide, Accor, and Hyatt compete by bundling experiences, offering loyalty benefits, and promoting weekend or wellness packages tailored to local guests. TripAdvisor and Agoda strengthen market influence by aggregating reviews and offering last-minute deals. Trip.com Group (formerly Ctrip) drives regional growth in Asia with AI-led personalization. Companies focus on domestic traveler engagement through digital campaigns, flexible policies, and tailored experiences. Competitive pressure remains high as players invest in customer experience, brand partnerships, and destination branding to capture repeat local demand. Differentiation relies on exclusive offerings, local collaborations, and seamless booking journeys. The market sees increasing consolidation between OTAs and hotel brands to streamline distribution and drive profitability in the short-stay segment.
Key Player Analysis
- Airbnb
- Expedia Group
- Ctrip (now part of Trip.com Group)
- Accor
- Hyatt Hotels Corporation
- Marriott International
- Hilton Worldwide
- TripAdvisor
- Agoda
Recent Developments
- In January 2025, Tripadvisor announced its 2025 Travelers’ Choice Awards, highlighting top destinations based on traveler reviews. This influences staycation choices as people look for highly-rated local experiences and destinations.
- In 2024, Hilton is set to double its lifestyle portfolio by 2028, with a focus on distinct and localized travel experiences, potentially enhancing staycation options with unique hotel offerings.
Report Coverage
The research report offers an in-depth analysis based on Direct Suppliers, Indirect Suppliers, Age, Visit Purpose, Consumer Orientation, Booking Channel, Tour Type, Tourism Type and Geography. It details leading market players, providing an overview of their business, product offerings, investments, revenue streams, and key applications. Additionally, the report includes insights into the competitive environment, SWOT analysis, current market trends, as well as the primary drivers and constraints. Furthermore, it discusses various factors that have driven market expansion in recent years. The report also explores market dynamics, regulatory scenarios, and technological advancements that are shaping the industry. It assesses the impact of external factors and global economic changes on market growth. Lastly, it provides strategic recommendations for new entrants and established companies to navigate the complexities of the market.
Future Outlook
- Demand for local leisure travel will continue rising due to lifestyle shifts and hybrid work culture.
- Hotels will expand staycation-focused packages, including wellness, dining, and family-friendly experiences.
- Online booking platforms will see stronger traffic as users prefer convenience and dynamic pricing.
- Loyalty programs will influence repeat bookings among urban professionals and families.
- Wellness-focused retreats and mental health breaks will gain more prominence in urban areas.
- Mid-scale hotels will introduce more flexible pricing and last-minute deals to stay competitive.
- Governments may invest more in promoting domestic tourism to support local economies.
- Regional players will strengthen partnerships with OTAs to enhance visibility and reach.
- Sustainability and eco-staycations will emerge as a new category among environmentally conscious travelers.
- AI-powered travel recommendations will reshape how consumers plan and personalize their staycation experiences.
Request a Free Sample
Fill in your details and we'll send you a free sample report.
- Sample data tables & charts
- Research methodology
Need a Custom Version of This Report?
Tailor the scope, geography, or segments to your exact requirements.
- Custom geography or segment scope
- Direct access to our analyst team
Frequently Asked Questions
What is the current market size for the Staycation market, and what is its projected size in 2032?
At what Compound Annual Growth Rate is the Staycation market projected to grow between 2024 and 2032?
Which Staycation market segment held the largest share in 2024?
What are the primary factors fueling the growth of the Staycation market?
Who are the leading companies in the Staycation market?
Which region commanded the largest share of the Staycation market in 2024?
Table of Content
Chapter 1. Report Introduction
- 1.1 Report Description & Purpose
- 1.1.1 Report Title & Market Definition
- 1.1.2 Unique Selling Propositions (USP) & Key Differentiators
- 1.1.3 Value Proposition for Stakeholders
- 1.2 Research Objectives
- 1.2.1 Market Sizing Objectives (Volume & Revenue)
- 1.2.2 Segmentation Objectives
- 1.2.3 Competitive Intelligence Objectives
- 1.2.4 Forecast & Scenario Objectives
- 1.3 Report Scope
- 1.3.1 Staycation Scope – Types & Subtypes Covered
- 1.3.2 Geographic Scope – Regions & Countries Covered
- 1.3.3 Historical Period, Base Year & Forecast Period (2024; forecast to 2032)
- 1.3.4 Inclusions & Exclusions
- 1.4 HS Code & Classification Framework
- 1.5 Currency, Units & Pricing Basis
- 1.6 Target Stakeholders
- 1.7 Limitations & Assumptions
Chapter 2. Executive Summary
- 2.1 Global Staycation Market Snapshot
- 2.1.1 Market Size – Historical (2024) & Forecast (2024-2032) (2024: USD 371.5 million → 2032: USD 713.5 million)
- 2.1.2 Volume & Revenue – Global Totals
- 2.1.3 Key Market Highlights – Top Five Facts
- 2.2 Staycation Market Segmentation Snapshot
- 2.2.1 Market Split by Region – 2024 vs. 2032
- 2.3 Competitive Snapshot
- 2.3.1 Top 10 Players by Revenue Share – 2024
- 2.3.2 Top 10 Players by Volume Share – 2024
- 2.3.3 Recent Strategic Developments (18-Month Summary)
- 2.4 Key Investment Highlights & Strategic Conclusions
Chapter 3. Staycation Market Dynamics & Industry Analysis
- 3.1 Market Overview & Context
- 3.1.1 Staycation Market Position in the Broader Automotive Value Chain
- 3.1.2 OEM vs. Replacement Market Dynamics
- 3.1.3 Market Maturity & Development Stage by Region
- 3.2 Staycation Market Drivers
- 3.3 Staycation Market Restraints & Challenges
- 3.4 Staycation Market Opportunities
- 3.5 Porter's Five Forces Analysis
- 3.5.1 Threat of New Entrants
- 3.5.2 Bargaining Power of Suppliers
- 3.5.3 Bargaining Power of Buyers
- 3.5.4 Threat of Substitutes
- 3.5.5 Competitive Rivalry – Intensity Assessment
- 3.6 Staycation Value Chain Analysis
- 3.6.1 Upstream – Raw Material/Input Suppliers
- 3.6.1.1 Raw Material/Input 1
- 3.6.1.2 Raw Material/Input 2
- 3.6.1.3 Raw Material/Input 3
- 3.6.2 Midstream – Production/Manufacturing/Service Delivery
- 3.6.2.1 Production/Process Overview
- 3.6.2.2 Key Facility Locations & Capacity by Manufacturer
- 3.6.3 Downstream – Distribution & End Consumer
- 3.6.3.1 Primary Channel – B2B/OEM
- 3.6.3.2 Secondary Channels – Dealer, Retail, Online, Direct
- 3.6.4 Value Chain Profitability Analysis
- 3.6.1 Upstream – Raw Material/Input Suppliers
- 3.7 PESTEL Analysis
- 3.7.1 Political Factors
- 3.7.2 Economic Factors
- 3.7.3 Social Factors
- 3.7.4 Technological Factors
- 3.7.5 Environmental Factors
- 3.7.6 Legal Factors
- 3.8 Staycation Supply Chain Analysis
- 3.8.1 Raw Material/Input Supply Risk Assessment
- 3.8.2 Manufacturing Concentration Risk (Geographic Exposure)
- 3.8.3 Trade Disruption Impact Analysis
- 3.9 Regulatory & Policy Landscape
Note: The regulatory and policy landscape section covers regulations based on their applicability to the market, Staycation category, geography, and scope of the study. Only regulatory frameworks with a material impact on operations, compliance, trade, sustainability, or market access are analyzed in detail.
Chapter 4. Key Investment Pockets & Opportunity Analysis
- 4.1 Staycation Market Attractiveness Analysis
- 4.1.1 By Region – Investment Attractiveness Matrix (Volume × CAGR)
- 4.2 Absolute Revenue Growth Opportunity
- 4.2.1 By Region – Absolute USD Growth Through 2032
- 4.3 Incremental Volume Opportunity
- 4.3.1 By Region – Incremental Volume Through 2032
- 4.3.2 Segment – Incremental Volume
- 4.4 Emerging Submarket Opportunity Deep Dive (Subject to Applicability)
- 4.5 Emerging Market Opportunity Scorecards
- 4.5.1 United States
- 4.5.2 Europe
- 4.5.3 Asia
- 4.5.4 Middle East & Africa
Note: Emerging Market Opportunity Scorecards will be included based on relevance and strategic importance. Regions listed are indicative and may vary depending on data availability and market dynamics.
Chapter 5. Staycation Import-Export Analysis & Trade Flows
- 5.1 Global Trade Overview
- 5.1.1 Global Export Value by Country (2024)
- 5.1.2 Global Export Volume by Country (2024)
- 5.1.3 Global Import Value by Country (2024)
- 5.1.4 Global Import Volume by Country (2024)
- 5.1.5 Net Trade Balance by Country (2024)
- 5.2 Export Analysis – Segment
- 5.2.1 Type 1 (HS Code)
- 5.2.2 Type 2 (HS Code)
- 5.2.3 Type 3 (HS Code)
- 5.2.4 Type 4 (HS Code)
- 5.2.5 Type 5 (HS Code)
- 5.3 Import Analysis – Segment
- 5.3.1 Type 1 (HS Code)
- 5.3.2 Type 2 (HS Code)
- 5.3.3 Type 3 (HS Code)
- 5.3.4 Type 4 (HS Code)
- 5.3.5 Type 5 (HS Code)
- 5.4 Average Unit Trade Prices
- 5.4.1 Average Export Price – Segment & Country
- 5.4.2 Average Import Price – Segment & Source Country
- 5.4.3 Price Trends (2024)
- 5.5 Key Trade Route Analysis
- 5.5.1 Trade Route 1
- 5.5.2 Trade Route 2
- 5.5.3 Trade Route 3
- 5.5.4 Trade Route 4
- 5.5.5 Trade Route 5
- 5.6 Trade Policy Impact Assessment
- 5.6.1 US Anti-Dumping & Section 301 Tariffs
- 5.6.2 EU Customs Union Impact
- 5.6.3 Major Free Trade Agreements
- 5.6.4 USMCA Rules of Origin
Note: Trade policy analysis will be included only where relevant to the Staycation market.
Chapter 6. Competitive Landscape & Company Benchmarking
- 6.1 Staycation Market Concentration & Structure
- 6.1.1 Herfindahl-Hirschman Index (HHI) – vs. 2024
- 6.1.2 Tier 1, Tier 2 & Tier 3 Market Structure
- 6.1.3 Global, Regional & Local Player Dynamics
- 6.2 Staycation Market Share Analysis – 2024
- 6.2.1 Global Revenue Share by Company
- 6.2.2 Global Volume Share by Company
- 6.2.3 Regional Revenue Share
- 6.2.4 Market Share Evolution ( vs. 2024)
- 6.2.5 OEM Segment Share by Company
- 6.2.6 Replacement Segment Share by Company
- 6.3 Production/Delivery Capacity & Facility Analysis
- 6.3.1 Global Installed Capacity
- 6.3.2 Capacity Utilization Rates
- 6.3.3 Production/Output Volume
- 6.3.4 Facility Locations & Capacity Map
- 6.3.5 Planned Capacity Additions
- 6.4 Staycation Competitive Benchmarking Matrix
- 6.4.1 Revenue, Volume, CAGR & Profitability Comparison
- 6.4.2 Channel Revenue Mix
- 6.4.3 Geographic Revenue Exposure
- 6.4.4 R&D Intensity
- 6.4.5 Sustainability Maturity
- 6.5 Strategic Developments in Staycation (Last 24 Months)
- 6.5.1 Mergers, Acquisitions & Divestments
- 6.5.2 New Staycation Launches
- 6.5.3 Facility Expansions
- 6.5.4 Strategic Alliances, Joint Ventures & Partnerships
- 6.5.5 Distribution Expansion & Market Entry
- 6.5.6 Sustainability & ESG Initiatives
- 6.6 Competitive Strategy Mapping
- 6.6.1 Leader, Challenger, Follower & Niche Classification
- 6.6.2 Pricing Strategy Comparison
- 6.6.3 Channel Strategy Matrix
Note: Strategic developments are included based on their materiality and the availability of reliable information.
Chapter 7. Global Staycation Market – By Distribution Channel
- 7.1 Segment Overview
- 7.1.1 Volume & Revenue Split by Channel (2024 & 2032)
- 7.1.2 Channel Mix Evolution (2024-2032)
Chapter 8. Regional Market Analysis – Global Overview
- 8.1 Global Regional Overview
- 8.1.1 Regional Volume Share
- 8.1.2 Regional Revenue Share
- 8.1.3 Regional Volume by Region
- 8.1.4 Regional Revenue by Region
- 8.1.5 Regional Forecast Through 2032
- 8.2 Cross-Regional Segment Analysis
- 8.2.1 By Distribution Channel
- 8.2.2 By Brand/Price Tier
Chapter 9. North America Staycation Market
- 9.1 United States
- 9.2 Canada
- 9.3 Mexico
Chapter 10. Europe Staycation Market
- 10.1 Germany
- 10.2 France
- 10.3 Italy
- 10.4 United Kingdom
- 10.5 Spain
- 10.6 Poland
- 10.7 Russia
- 10.8 Netherlands
- 10.9 Belgium
- 10.10 Sweden
- 10.11 Denmark
- 10.12 Norway
- 10.13 Rest of Europe
Chapter 11. Asia Pacific Staycation Market
- 11.1 China
- 11.2 India
- 11.3 Japan
- 11.4 South Korea
- 11.5 Thailand
- 11.6 Indonesia
- 11.7 Vietnam
- 11.8 Malaysia
- 11.9 Australia
- 11.10 Rest of Asia Pacific
Chapter 12. Latin America Staycation Market
- 12.1 Brazil
- 12.2 Argentina
- 12.3 Colombia
- 12.4 Chile
- 12.5 Rest of Latin America
Chapter 13. Middle East Staycation Market
- 13.1 Saudi Arabia
- 13.2 United Arab Emirates
- 13.3 Turkey
- 13.4 Israel
- 13.5 Iran
- 13.6 Rest of the Middle East
Chapter 14. Africa Staycation Market
- 14.1 South Africa
- 14.2 Egypt
- 14.3 Nigeria
- 14.4 Morocco
- 14.5 Rest of Africa
Chapter 15. Staycation Company Profiles
- 15.1 [Company 01]
- 15.1.1 Company Overview
- 15.1.2 Key Management Personnel
- 15.1.3 Products & Services Portfolio
- 15.1.4 Financial Performance
- 15.1.5 Key Market Focus & Geographic Presence
- 15.1.6 Recent Developments & Strategic Initiatives
Note: The company profile list is preliminary and may change based on research findings, market developments, data availability, and client requirements.
Chapter 16. Appendices
- Appendix A – List of Abbreviations & Acronyms
- Appendix B – Industry Classification Code Reference – Full Series
- Appendix C – Production & Capacity Data Tables
- Appendix D – End-Use & Demand Base Tables
- Appendix E – Consumption & Replacement Rate Assumptions
- Appendix F – ASP Reference Tables
- Appendix G – Manufacturing & Facility Database
- Appendix H – Import-Export Data Tables
- Appendix I – Regulatory Summary Tables
- Appendix J – Primary Research Participant List (Anonymized)
- Appendix K – Primary Research Questionnaire Framework
- Appendix L – Data Sources & Bibliography
- Appendix M – Market Size Divergence & Source Comparison
Chapter 17. Research Methodology
- 17.1 Research Framework & Philosophy
- 17.2 Secondary Research – Sources, Hierarchy & Data Extraction
- 17.3 Data Modeling – Bottom-Up & Top-Down Market Sizing
- 17.4 Primary Research – Stakeholder Framework, LOI & Sample Sizes
- 17.5 Forecast Methodology – Regression, Scenario & Sensitivity Analysis
- 17.6 Quality Control – Four-Layer Validation Framework
- 17.7 Limitations & Standard Assumptions
- 17.8 Disclaimer
