| REPORT ATTRIBUTE |
DETAILS |
| Historical Period |
2020-2023 |
| Base Year |
2024 |
| Forecast Period |
2025-2032 |
| Stone Crushing Equipment Market Size 2024 |
USD 2,286.54 million |
| Stone Crushing Equipment Market, CAGR |
6.31% |
| Stone Crushing Equipment Market Size 2032 |
USD 3,722.50 million |
Market Overview:
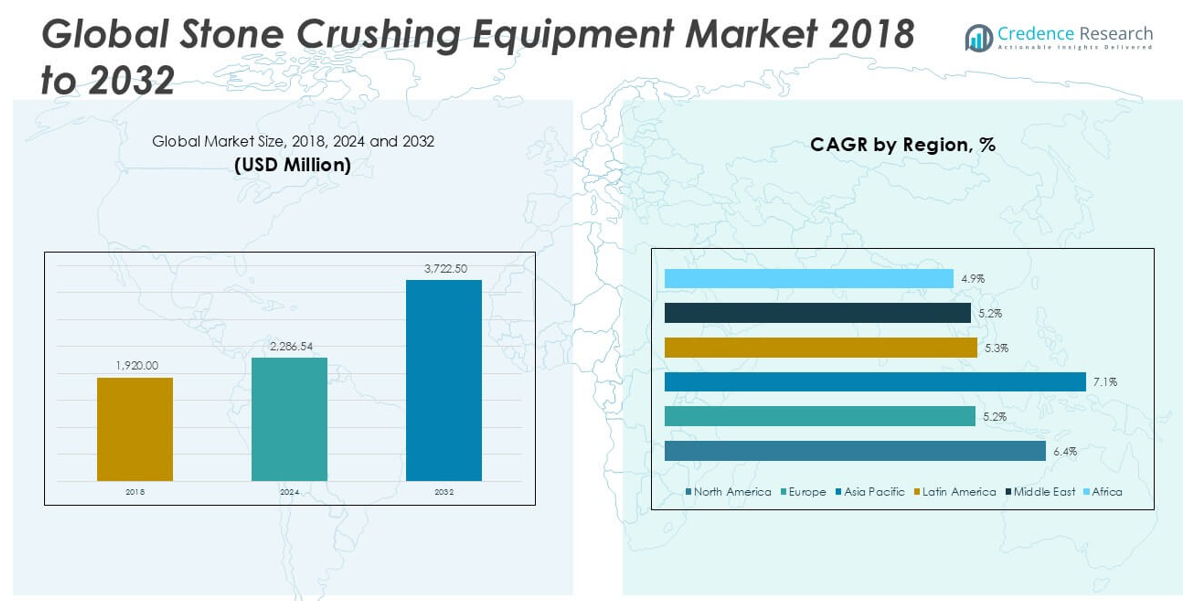
The Stone Crushing Equipment market size was valued at USD 1,920.00 million in 2018, reached USD 2,286.54 million in 2024, and is anticipated to reach USD 3,722.50 million by 2032, at a CAGR of 6.31% during the forecast period.
The stone crushing equipment market is highly competitive, with key players such as Metso Corporation, SANDVIK AB, Astec Industries, Eagle Crusher Company Inc., Weir Group, IROCK Crusher, Telsmith Inc., Thyssenkrupp AG, Mormak Equipment Inc., and Komatsu Ltd. leading the landscape. These companies focus on technological advancements, energy-efficient machinery, and expanding their global footprint through strategic collaborations and product innovation. Asia Pacific dominates the market with a significant 39.3% share in 2024, driven by rapid urbanization, large-scale infrastructure projects, and robust mining activities, particularly in China and India. North America and Europe follow as key regions.
Market Insights
- The Stone Crushing Equipment market was valued at USD 2,286.54 million in 2024 and is projected to reach USD 3,722.50 million by 2032, growing at a CAGR of 6.31% during the forecast period.
- The market is driven by increasing mining activities and rapid infrastructure development worldwide, with high demand from the construction and aggregate sectors for crushed stones.
- Mobile stone crushers and energy-efficient crushing equipment are key trends, with companies focusing on smart, eco-friendly, and portable solutions to reduce operational costs and environmental impact.
- Competitive intensity is high with major players like Metso Corporation, SANDVIK AB, and Astec Industries investing in technological upgrades, though high initial costs and stringent environmental regulations continue to restrain smaller operators.
- Asia Pacific holds the largest regional share at 39.3% in 2024, while the jaw crusher segment dominates by product type due to its widespread application in primary crushing across mining and construction industries.
Access crucial information at unmatched prices!
Request your sample report today & start making informed decisions powered by Credence Research Inc.!
Download Sample
Market Segmentation Analysis:
By Product Type:
In the Stone Crushing Equipment market, the jaw crusher segment holds the dominant market share due to its widespread application in primary crushing processes. Jaw crushers are favored for their high efficiency, ease of operation, and ability to handle large-sized materials, making them essential in mining and construction industries. The rising demand for infrastructure development and mining activities continues to drive the growth of jaw crushers. Additionally, the technological advancements in crusher design, aimed at enhancing durability and energy efficiency, further support the expansion of this product type within the market.
- For instance, Sandvik’s CJ411 jaw crusher offers a feed opening of 1,040 x 840 mm and can process materials up to 150 kW, providing robust performance in primary crushing operations with minimal downtime and energy consumption.
By End-User:
The mining segment leads the Stone Crushing Equipment market by end-user share, driven by the extensive use of crushers in the extraction and processing of minerals and ores. The surge in global mining activities, particularly in emerging economies, significantly contributes to the high demand for stone crushing equipment in this sector. Additionally, the construction segment is experiencing steady growth due to increasing urbanization and road development projects worldwide. The growing need for crushed stones in building foundations, road bases, and railway tracks underpins the continuous demand from both mining and construction sectors.
- For instance, Metso’s Nordberg® C200™ jaw crusher, used extensively in mining applications, is capable of handling feed sizes up to 1,500 mm and offers a crushing capacity of up to 2,000 tons per hour, making it one of the largest jaw crushers in the world for heavy-duty mining operations.
Market Overview
Expanding Mining and Infrastructure Activities
The rapid growth of mining operations and large-scale infrastructure projects is significantly driving the demand for stone crushing equipment. Mining activities across emerging economies require efficient crushing machinery to process extracted minerals and ores. Additionally, infrastructure development initiatives such as roadways, railways, and bridges are boosting the need for crushed stone, further fueling equipment adoption. The increasing investment in both public and private construction projects globally ensures sustained demand for stone crushing machinery throughout the forecast period.
- For instance, Thyssenkrupp’s KB 63-130 gyratory crusher, installed at the Oyu Tolgoi mine in Mongolia, has a throughput capacity of 14,000 tons per hour, supporting large-scale mining and infrastructure operations efficiently.
Rising Urbanization and Industrialization
Accelerated urbanization and the expansion of industrial areas are propelling the demand for stone aggregates, which directly supports the growth of the stone crushing equipment market. The surge in housing projects, commercial spaces, and manufacturing facilities increases the consumption of construction materials like crushed stone. This rising demand necessitates high-capacity, reliable stone crushers to meet construction deadlines and quality standards. Additionally, government initiatives promoting smart cities and sustainable infrastructure are further contributing to the growing need for efficient crushing solutions.
- For instance, Astec Industries’ FT2650 track-mounted jaw crusher is widely used in urban construction projects, offering a crushing capacity of up to 500 tons per hour and rapid mobility that meets tight construction schedules and space constraints.
Technological Advancements in Equipment Design
Continuous advancements in stone crushing equipment technology are significantly enhancing machine efficiency, operational flexibility, and environmental compliance. Modern crushers now offer improved automation, energy efficiency, and reduced maintenance requirements, which attract end-users seeking long-term operational benefits. The integration of smart systems and remote monitoring also increases safety and performance while reducing downtime. These technological innovations not only boost productivity but also enable manufacturers to offer competitive, user-friendly equipment, driving market growth.
Key Trends & Opportunities
Growing Focus on Mobile Crushing Equipment
The rising preference for mobile stone crushing equipment presents a major opportunity in the market. Mobile crushers offer the flexibility to operate directly at construction sites, reducing transportation costs and project timelines. They are particularly beneficial for short-term projects and in remote areas where setting up stationary plants is not feasible. The convenience, mobility, and cost-effectiveness of these solutions are expected to drive significant adoption, especially in urban construction and mining operations.
- For instance, Kleemann’s MOBICAT MC 120 Zi PRO mobile jaw crusher offers a feed capacity of 650 tons per hour and a crusher inlet of 1,200 x 800 mm, providing high output with fast relocation capability, which is ideal for large construction and mining sites.
Increasing Demand for Energy-Efficient Solutions
There is a growing trend towards energy-efficient and eco-friendly stone crushing equipment as industries seek to reduce their carbon footprint and operational costs. Manufacturers are focusing on developing crushers with lower energy consumption and reduced emissions to comply with stringent environmental regulations. Equipment with enhanced energy-saving features not only benefits end-users economically but also aligns with global sustainability goals. This shift presents ample opportunities for innovation and market differentiation in the coming years.
- For instance, Metso’s Lokotrack® LT120E™ mobile jaw crusher operates with an external electric power source and features a fuel-efficient CAT® C13 diesel engine, achieving fuel savings of up to 40% compared to conventional hydraulic-driven crushers
Key Challenges
High Initial Investment Costs
The stone crushing equipment market faces a significant challenge due to the high initial capital required for purchasing and installing advanced machinery. Small and medium-sized construction firms may find it difficult to invest in high-performance crushers, which can slow adoption rates. Additionally, the associated costs of transportation, setup, and regular maintenance further strain budgets, particularly in price-sensitive markets. These financial barriers can limit market penetration, especially for newer or smaller industry players.
Environmental and Regulatory Constraints
Strict environmental regulations concerning dust, noise pollution, and carbon emissions pose a considerable challenge to the stone crushing equipment market. Compliance with these regulations often necessitates additional investment in dust suppression systems, noise control measures, and eco-friendly machinery. Non-compliance can result in fines, operational restrictions, or shutdowns. As governments worldwide tighten environmental standards, manufacturers and operators must balance operational efficiency with regulatory requirements, increasing the complexity of market operations.
Operational and Maintenance Complexities
Stone crushing equipment often requires skilled operators and regular maintenance to ensure optimal performance and longevity. Inadequate training and lack of technical expertise can lead to inefficient operations, equipment failures, and safety risks. Moreover, sourcing replacement parts and carrying out timely maintenance can pose logistical challenges, especially in remote mining sites. These operational complexities can disrupt project timelines and escalate costs, thereby posing a hurdle to sustained equipment utilization.
Regional Analysis
North America
In 2024, North America accounted for approximately 28.5% of the global stone crushing equipment market, with a market size of USD 652.18 million, up from USD 554.88 million in 2018. The market is projected to reach USD 1,069.31 million by 2032, registering a CAGR of 6.4% during the forecast period. The growth in North America is primarily driven by expanding construction activities and significant investments in infrastructure upgrades. Additionally, stringent regulatory standards and the rising adoption of energy-efficient machinery are influencing market dynamics across the region.
Europe
Europe held a 20.6% market share in 2024, with its stone crushing equipment market valued at USD 470.51 million, rising from USD 414.72 million in 2018. The regional market is expected to grow at a CAGR of 5.2%, reaching USD 706.43 million by 2032. Growth is supported by increasing construction and mining projects, particularly in Eastern Europe, along with ongoing investments in sustainable infrastructure. Europe’s focus on advanced, eco-friendly crushing solutions is shaping market preferences and encouraging the adoption of technologically upgraded equipment.
Asia Pacific
Asia Pacific dominates the global market with a commanding 39.3% market share in 2024, supported by a market size of USD 898.78 million, up from USD 738.24 million in 2018. The region is anticipated to achieve USD 1,553.29 million by 2032, growing at the fastest CAGR of 7.1%. Rapid urbanization, significant mining activities, and large-scale infrastructure development across China, India, and Southeast Asia are the primary growth drivers. The increasing demand for mobile and energy-efficient stone crushing equipment further boosts market expansion in this region.
Latin America
Latin America represented around 5.1% of the global market in 2024, with a market value of USD 115.68 million, growing from USD 98.30 million in 2018. The market is projected to reach USD 173.36 million by 2032, expanding at a CAGR of 5.3%. The growth in Latin America is mainly driven by rising construction activities, mining sector investments, and infrastructural development in countries like Brazil and Mexico. However, challenges related to economic fluctuations and regulatory changes may moderately impact the market’s pace.
Middle East
The Middle East accounted for approximately 3.9% of the global stone crushing equipment market in 2024, with a market size of USD 79.10 million, up from USD 71.04 million in 2018. The market is expected to reach USD 117.61 million by 2032, growing at a CAGR of 5.2%. Increasing construction projects, particularly in the UAE and Saudi Arabia, along with expanding mining activities, are propelling market demand. Additionally, the region’s strategic focus on diversifying economies beyond oil is supporting the growth of the construction and mining sectors.
Africa
Africa held a 3.1% market share in 2024, with the market size rising to USD 70.30 million, compared to USD 42.82 million in 2018. The market is projected to reach USD 102.51 million by 2032, growing at a CAGR of 4.9%. The region’s growth is supported by increasing mining exploration and gradual urban infrastructure development across countries like South Africa and Nigeria. However, limited access to advanced technology and capital-intensive machinery may pose adoption challenges, although steady demand from basic construction projects remains a key contributor to market growth.
Market Segmentations:
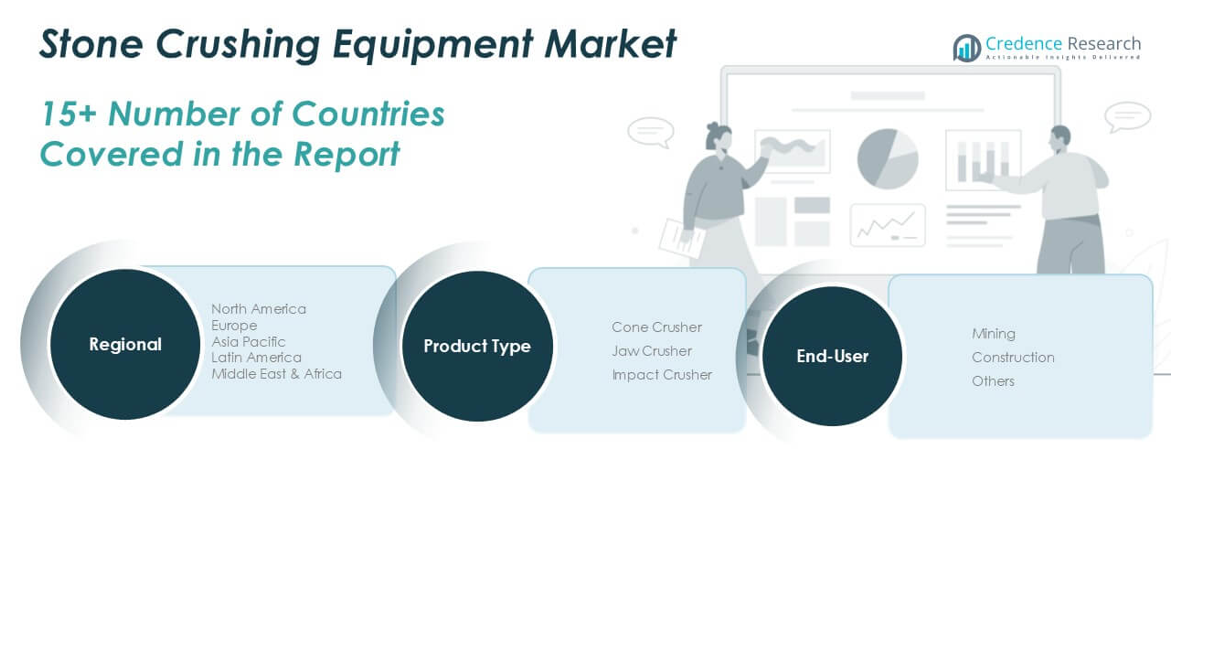
By Product Type
- Cone Crusher
- Jaw Crusher
- Impact Crusher
By End-User
- Mining
- Construction
- Others
By Geography:
- North America
- Europe
- Germany
- France
- U.K.
- Italy
- Spain
- Rest of Europe
- Asia Pacific
- China
- Japan
- India
- South Korea
- South-east Asia
- Rest of Asia Pacific
- Latin America
- Brazil
- Argentina
- Rest of Latin America
- Middle East & Africa
- GCC Countries
- South Africa
- Rest of the Middle East and Africa
Competitive Landscape
The stone crushing equipment market is characterized by intense competition, with several global and regional players striving to strengthen their market positions through product innovation, strategic partnerships, and geographic expansion. Leading companies such as Metso Corporation, SANDVIK AB, Astec Industries, Eagle Crusher Company Inc., and Weir Group dominate the market with comprehensive product portfolios and strong distribution networks. These players continuously invest in technological advancements to offer energy-efficient, mobile, and automated crushing solutions, aligning with the growing demand for sustainable operations. The market also sees consolidation efforts through mergers and acquisitions aimed at enhancing product capabilities and expanding customer bases. Competitive intensity is further driven by the need to comply with evolving environmental regulations, prompting manufacturers to develop eco-friendly and low-emission crushing equipment.
Shape Your Report to Specific Countries or Regions & Enjoy 30% Off!
Key Player Analysis
- Astec Industries
- Eagle Crusher Company Inc.
- Weir Group
- Metso Corporation
- SANDVIK AB
- IROCK Crusher
- Telsmith Inc.
- Thyssenkrupp AG
- Mormak Equipment Inc.
- Komatsu Ltd
Recent Developments
- In June 2025, Sandvik launched a new generation of upgraded jaw crushers. These feature advanced plug-and-play capabilities, improved hydraulic wedge setting adjustment, synchronized retraction, an upgraded power pack, enhanced guarding, and the new ACS-j monitoring and control system. The upgrades focus on safety, productivity, and sustainability, with a three-year standard warranty and seamless integration into existing operations. The new jaw crushers also offer improved energy efficiency and use fully recyclable materials.
- In February 2025, Eagle Crusher Co. announced a plan to launch its next-generation 1200-CC portable crushing and screening plant at Booth #1912 at World of Asphalt/AGG1 between March 25 and 27, 2025, in St. Louis. The Next-Generation 1200-CC features a self-lowering control panel, a fully hydraulic side discharge conveyor, and is available with an onboard cross-belt permanent magnet.
- In June 2024, Terex unveiled MAGNA, its new brand for its quarrying portfolio to enhance its high-volume crushing operations. The company has launched this new brand to target large-scale operations in the crushing, mining, construction, and recycling industries
- In July 2022, Metso Outotec entered into a strategic partnership agreement with Larsen & Toubro Limited to deliver four Symons cone crushers for an iron ore crushing and screening plant located at the National Mineral Development Corporation (NMDC-Kirandul) complex in Chhattisgarh, central India.
- In April 2022, FLSmidth announced that a greenfield gold mine in Northern Canada would receive a complete equipment package, including a cone crusher, ball mills, cyclones, and a jaw crusher, among other machinery components
Market Concentration & Characteristics
The Stone Crushing Equipment Market is moderately concentrated, with several established global players and a mix of regional manufacturers competing for market share. It is characterized by strong demand from the mining, construction, and infrastructure sectors, which require efficient and durable crushing solutions. Leading companies focus on developing advanced, energy-efficient equipment that meets environmental standards and operational demands. The market demonstrates a clear preference for mobile and portable crushers, driven by the need for flexibility and on-site crushing capabilities. Product differentiation is achieved through technology, capacity, automation, and ease of maintenance. Pricing pressure exists, especially among regional players targeting cost-sensitive customers. It shows steady growth potential, supported by the expansion of mining activities and large-scale construction projects in emerging economies. Strict regulatory frameworks and growing environmental concerns encourage manufacturers to introduce low-emission and energy-saving equipment. The market favors suppliers with a broad product range and reliable after-sales service, enhancing their ability to secure long-term contracts and customer loyalty.
Report Coverage
The research report offers an in-depth analysis based on Product Type, End-User and Geography. It details leading market players, providing an overview of their business, product offerings, investments, revenue streams, and key applications. Additionally, the report includes insights into the competitive environment, SWOT analysis, current market trends, as well as the primary drivers and constraints. Furthermore, it discusses various factors that have driven market expansion in recent years. The report also explores market dynamics, regulatory scenarios, and technological advancements that are shaping the industry. It assesses the impact of external factors and global economic changes on market growth. Lastly, it provides strategic recommendations for new entrants and established companies to navigate the complexities of the market.
Future Outlook
- The stone crushing equipment market is expected to witness steady growth driven by ongoing infrastructure and mining projects worldwide.
- Demand for mobile and portable stone crushers will continue to rise due to their flexibility and cost-saving benefits on construction sites.
- Technological advancements will lead to the development of more energy-efficient and automated stone crushing equipment.
- Environmental regulations will push manufacturers to focus on producing low-emission and eco-friendly crushing machinery.
- Asia Pacific will maintain its dominant position in the market, supported by rapid urbanization and industrial growth.
- North America and Europe will see increased adoption of advanced, energy-efficient equipment due to stringent environmental standards.
- The mining sector will remain a key end-user, driving continuous demand for heavy-duty and high-capacity stone crushers.
- Increasing investment in smart city projects and modern road construction will further fuel equipment demand.
- High initial investment and maintenance costs may limit market entry for small and medium-sized companies.
- Manufacturers will focus on expanding after-sales services and offering customized solutions to strengthen market presence.


