Market Overview
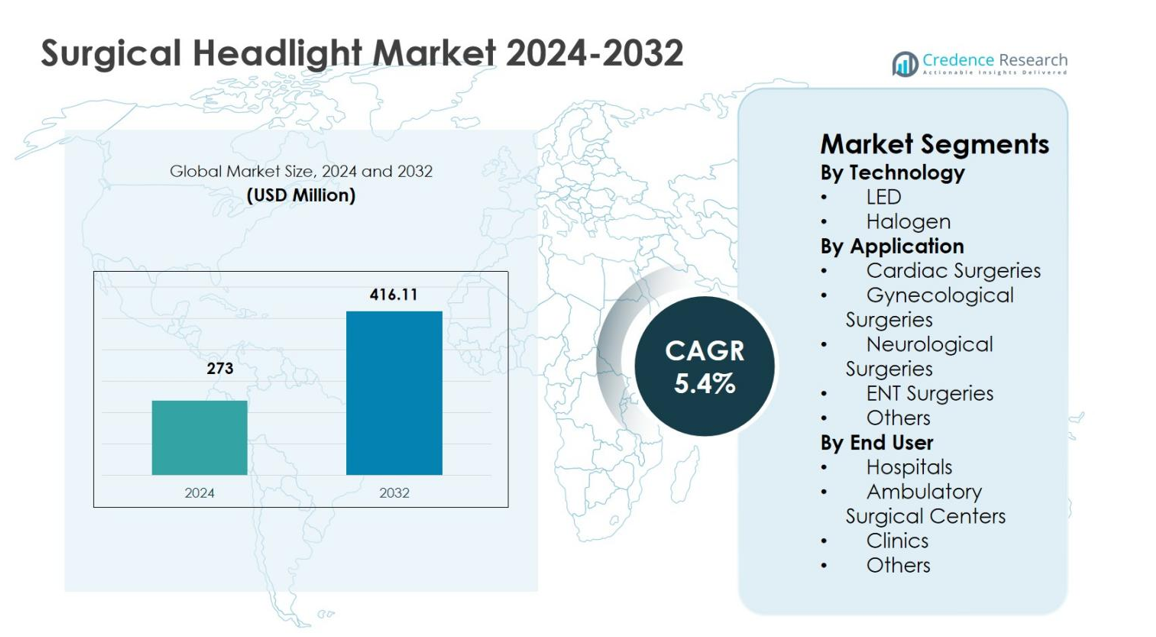
Surgical Headlight Market size was valued at USD 273 Million in 2024 and is anticipated to reach USD 416.11 Million by 2032, growing at a CAGR of 5.4% during the forecast period.
| REPORT ATTRIBUTE |
DETAILS |
| Historical Period |
2020-2023 |
| Base Year |
2024 |
| Forecast Period |
2025-2032 |
| Surgical Headlight Market Size 2024 |
USD 273 Million |
| Surgical Headlight Market, CAGR |
5.4% |
| Surgical Headlight Market Size 2032 |
USD 416.11 Million |
Surgical Headlight Market is characterized by the presence of established medical device manufacturers focusing on innovation, product reliability, and global reach. Key players such as Welch Allyn, KLS Martin Group, Excelitas Technologies Corp., SurgiTel, Enova Illumination, Admetec Ltd., ATMOS MedizinTechnik GmbH & Co. KG, Bryton Corporation, Daray Ltd., and Cuda Surgical emphasize LED-based illumination, ergonomic designs, and improved battery performance to strengthen their product portfolios. These companies actively invest in research and development and expand distribution networks to address rising surgical demand. Regionally, North America led the Surgical Headlight Market with a 38.6% share in 2024, supported by advanced healthcare infrastructure and high surgical volumes, followed by Europe with 29.4% share and Asia Pacific with 22.1% share, driven by expanding healthcare facilities and growing surgical adoption.
Market Insights
- The Surgical Headlight Market was valued at USD 273 Million in 2024 and is projected to reach USD 416.11 Million by 2032, growing at a CAGR of 5.4% during the forecast period, supported by increasing adoption of advanced surgical illumination systems across healthcare facilities.
- Market growth is driven by rising surgical procedure volumes, aging population, higher prevalence of chronic diseases, and growing demand for minimally invasive and precision-based surgeries requiring focused and shadow-free illumination.
- LED technology dominated the market with a 4% segment share in 2024, driven by superior brightness, longer lifespan, lower heat emission, and improved energy efficiency, while halogen systems accounted for 31.6% share due to lower upfront costs.
- Leading players such as Welch Allyn, KLS Martin Group, SurgiTel, Excelitas Technologies Corp., and Enova Illumination focus on ergonomic designs, battery performance, and product innovation to strengthen market presence.
- North America led the market with a 6% regional share in 2024, followed by Europe at 29.4% and Asia Pacific at 22.1%, driven by advanced healthcare infrastructure, expanding surgical access, and rising investments in operating room modernization.
Access crucial information at unmatched prices!
Request your sample report today & start making informed decisions powered by Credence Research Inc.!
Download Sample
Market Segmentation Analysis:
By Technology:
The Surgical Headlight Market, by technology, is led by LED headlights, which accounted for 68.4% market share in 2024, driven by superior illumination intensity, longer lifespan, lower heat generation, and improved energy efficiency compared to halogen systems. LED-based surgical headlights support extended procedures without surgeon fatigue and integrate seamlessly with modern optical systems. Rising adoption of minimally invasive and precision-driven surgeries further accelerates demand for LED technology. Meanwhile, halogen headlights held 31.6% share, supported by lower upfront costs and continued usage in budget-constrained healthcare settings.
- For instance, STERIS’s MedLED Spectra G8 model delivers 300,000 lux intensity with a 5,000-6,500 K color temperature and up to 5 hours of battery life on dual Everlast batteries, enabling cordless use across surgical specialties.
By Application:
By application, ENT surgeries dominated the Surgical Headlight Market with a 34.7% share in 2024, owing to the high need for focused, shadow-free illumination in confined anatomical areas. Increasing prevalence of ENT disorders and growing outpatient surgical volumes continue to drive adoption. Neurological surgeries followed with 24.9% share, supported by demand for high-precision visualization. Cardiac surgeries accounted for 18.6%, while gynecological surgeries held 14.1%, driven by complex operative requirements. Other applications collectively represented 7.7%, reflecting niche procedural use.
- For instance, Sunoptic Surgical’s SSL-9500 Portable LED Headlight delivers 70,000 lux of uniform white light for ENT procedures, using a lightweight headband and battery-operated clip holster to enable surgeon mobility around the table.
By End User:
The Surgical Headlight Market, by end user, is primarily driven by hospitals, which captured 61.8% market share in 2024, supported by high surgical volumes, availability of advanced operating rooms, and continuous investment in surgical visualization technologies. Growing multispecialty hospital infrastructure and rising complex surgeries strengthen this dominance. Ambulatory Surgical Centers accounted for 23.4%, fueled by the shift toward outpatient procedures and cost efficiency. Clinics represented 10.2%, while other end users held 4.6%, reflecting limited procedural scope and lower equipment adoption.
Key Growth Drivers
Rising Volume of Surgical Procedures
The Surgical Headlight Market benefits from the increasing number of surgical procedures across cardiac, neurological, ENT, orthopedic, and general surgery specialties. Growing prevalence of chronic diseases, an aging global population, and rising demand for minimally invasive and elective surgeries continue to elevate surgical volumes worldwide. Surgical headlights play a critical role in improving visibility, precision, and procedural efficiency, particularly in complex and lengthy operations. Hospitals and ambulatory surgical centers increasingly rely on advanced illumination solutions to support high surgical throughput, directly driving sustained demand for surgical headlight systems.
- For instance, Welch Allyn’s Green Series 46070 portable headlight offers 40 lumens of focused LED light with a lightweight 4-ounce Terrycloth headband, ideal for ENT examinations and minor surgeries.
Technological Advancements in Surgical Illumination
Technological innovation remains a major growth driver in the Surgical Headlight Market, with manufacturers focusing on high-intensity LED lighting, enhanced color rendering, and improved battery performance. Lightweight designs, ergonomic head-mounted structures, and compatibility with magnification loupes have significantly improved surgeon comfort and accuracy. These advancements reduce heat emission and eye strain while ensuring consistent illumination throughout procedures. As healthcare facilities modernize operating rooms, the adoption of technologically advanced surgical headlights continues to rise, supporting improved surgical outcomes and operational efficiency.
- For instance, Enova Illumination’s XLT-225A offers over 225,000 lux at 6100°K using LED refractive technology, with an adjustable spot size from 2 to 5 inches for deep-cavity precision.
Expansion of Ambulatory Surgical Centers
The rapid growth of ambulatory surgical centers strongly supports the Surgical Headlight Market. Healthcare providers increasingly shift procedures to outpatient settings to reduce costs, shorten patient stays, and improve workflow efficiency. Ambulatory centers require portable, reliable, and high-performance lighting solutions to accommodate a wide range of procedures. Surgical headlights offer flexibility, mobility, and focused illumination without dependence on fixed lighting infrastructure. Increasing investments in outpatient care facilities and favorable reimbursement policies further strengthen demand for advanced surgical headlight solutions.
Key Trends & Opportunities
Shift Toward LED-Based and Ergonomic Designs
A key trend in the Surgical Headlight Market is the widespread shift toward LED-based systems combined with ergonomic designs. LED headlights offer longer operational life, superior illumination quality, and reduced heat generation, aligning with modern surgical requirements. Manufacturers are introducing lightweight materials, adjustable headbands, and balanced weight distribution to minimize surgeon fatigue. These innovations create opportunities for product differentiation and premium offerings, particularly in high-volume surgical environments where comfort and performance directly influence purchasing decisions.
- For instance, STERIS launched the MedLED Spectra LED surgical headlight with integrated Dual Everlast™ batteries in the headband for cordless use and a patented padding system for comfort.
Growth Opportunities in Emerging Healthcare Markets
Emerging economies present strong growth opportunities for the Surgical Headlight Market due to expanding healthcare infrastructure and increasing access to surgical care. Countries across Asia Pacific, Latin America, and the Middle East are investing in modern operating rooms and advanced medical equipment. Rising medical tourism and adoption of global surgical standards further increase demand for reliable surgical visualization tools. Market players focusing on cost-effective, technologically advanced products and localized distribution strategies can capture significant growth potential in these regions.
- For instance, St. Vincent’s Hospital in Sydney, Australia collaborated with Payntor Dixon in October 2022 to establish the RAPTOR hybrid theatre, integrating advanced surgical ecosystems that incorporate Stryker surgical lights for enhanced visualization in trauma care.
Key Challenges
High Cost of Advanced Surgical Headlight Systems
High acquisition costs of advanced surgical headlight systems remain a significant challenge for the Surgical Headlight Market. Premium LED-based headlights with integrated optics, extended battery life, and ergonomic features require substantial upfront investment. Budget limitations in public hospitals and cost sensitivity in smaller clinics restrict widespread adoption. This financial barrier slows replacement cycles and encourages continued use of conventional or lower-cost lighting solutions, limiting overall market penetration, particularly in developing healthcare systems.
Battery Performance and Maintenance Constraints
Battery performance and maintenance issues pose ongoing challenges in the Surgical Headlight Market. Limited battery life, frequent recharging requirements, and performance degradation over time can disrupt surgical workflows. Inconsistent illumination due to battery-related issues affects procedural efficiency and surgeon confidence. Additionally, access to replacement batteries and technical support varies across regions, increasing operational complexity. Addressing these challenges requires advancements in battery technology, improved durability, and reliable after-sales support to ensure long-term product reliability.
Regional Analysis
North America
The Surgical Headlight Market in North America accounted for 38.6% market share in 2024, driven by high surgical volumes, advanced healthcare infrastructure, and rapid adoption of technologically advanced surgical equipment. The region benefits from a strong presence of leading medical device manufacturers and widespread use of LED-based surgical headlights across hospitals and ambulatory surgical centers. Rising prevalence of chronic diseases, an aging population, and increasing number of minimally invasive procedures continue to support demand. Favorable reimbursement policies and continuous investments in operating room modernization further strengthen market growth across the United States and Canada.
Europe
Europe represented 29.4% market share in 2024 in the Surgical Headlight Market, supported by well-established healthcare systems and increasing adoption of advanced surgical visualization tools. Countries such as Germany, the United Kingdom, and France contribute significantly due to high surgical procedure rates and strong focus on patient safety and precision. Growth is driven by rising demand for LED-based and ergonomic headlight systems, particularly in ENT and neurological surgeries. Government funding for healthcare infrastructure and increasing outpatient surgical procedures further enhance adoption across public and private healthcare facilities.
Asia Pacific
Asia Pacific captured 22.1% market share in 2024 in the Surgical Headlight Market, reflecting rapid expansion of healthcare infrastructure and rising access to surgical care. Growing populations, increasing prevalence of chronic diseases, and expanding medical tourism drive surgical volumes across China, India, Japan, and Southeast Asia. Hospitals and ambulatory surgical centers increasingly invest in cost-effective yet high-performance surgical headlights to meet rising demand. Government initiatives to modernize healthcare facilities and growing adoption of international surgical standards continue to accelerate market growth throughout the region.
Latin America
Latin America accounted for 6.1% market share in 2024 in the Surgical Headlight Market, supported by gradual improvements in healthcare infrastructure and increasing adoption of advanced medical devices. Brazil and Mexico lead regional demand due to expanding hospital networks and rising surgical procedure volumes. Growth is driven by increasing private healthcare investments and demand for efficient surgical illumination in ENT, gynecological, and general surgeries. Although budget constraints limit adoption of premium systems, growing awareness of surgical precision and patient safety continues to support steady market expansion.
Middle East & Africa
The Middle East & Africa region held 3.8% market share in 2024 in the Surgical Headlight Market, driven by rising investments in healthcare infrastructure and increasing surgical capacity in key countries. The Gulf Cooperation Council countries lead demand due to advanced hospital facilities and adoption of modern surgical equipment. Growth is supported by increasing medical tourism, expanding private healthcare sectors, and government initiatives to improve surgical care access. In Africa, gradual improvements in healthcare systems and international aid programs contribute to increasing adoption of essential surgical illumination solutions.
Market Segmentations:
By Technology
By Application
- Cardiac Surgeries
- Gynecological Surgeries
- Neurological Surgeries
- ENT Surgeries
- Others
By End User
- Hospitals
- Ambulatory Surgical Centers
- Clinics
- Others
By Geography
- North America
- Europe
- Germany
- France
- U.K.
- Italy
- Spain
- Rest of Europe
- Asia Pacific
- China
- Japan
- India
- South Korea
- South-east Asia
- Rest of Asia Pacific
- Latin America
- Brazil
- Argentina
- Rest of Latin America
- Middle East & Africa
- GCC Countries
- South Africa
- Rest of the Middle East and Africa
Competitive Landscape
Competitive landscape analysis of the Surgical Headlight Market highlights the presence of established medical device manufacturers focusing on innovation, product quality, and global distribution. Key players include Welch Allyn, KLS Martin Group, Excelitas Technologies Corp., SurgiTel, Enova Illumination, Admetec Ltd., ATMOS MedizinTechnik GmbH & Co. KG, Bryton Corporation, Daray Ltd., and Cuda Surgical. Companies compete by introducing lightweight, LED-based surgical headlights with enhanced illumination intensity, improved battery performance, and ergonomic designs to address surgeon comfort and procedural efficiency. Strategic initiatives such as product launches, portfolio expansion, and partnerships with hospitals and ambulatory surgical centers strengthen market positioning. Manufacturers also emphasize customization, compatibility with magnification systems, and after-sales support to differentiate offerings. Expansion into emerging markets through localized distribution and cost-optimized products remains a key strategy, while continuous investment in research and development supports long-term competitiveness and sustained market growth.
Shape Your Report to Specific Countries or Regions & Enjoy 30% Off!
Key Player Analysis
- Enova Illumination
- KLS Martin Group
- Bryton Corporation
- SurgiTel
- Excelitas Technologies Corp.
- Daray Ltd.
- Admetec Ltd.
- Welch Allyn
- ATMOS MedizinTechnik GmbH & Co. KG
- Cuda Surgical
Recent Developments
- In October 2024, Orascoptic launched an upgraded loupe‑mounted dental and surgical headlight incorporating enhanced TruColor technology to deliver brighter illumination and more accurate color rendering for clinicians.
- In September 2023, Orascoptic, a leader in vision solutions, introduced the Endeavour MD surgical headlight, designed to emit high-intensity light for medical and surgical applications.
- In 2023, Karl Storz launched its KS70 surgical headlight, described as one of its most advanced LED headlights, combining high illumination and durability for operating-room use.
Report Coverage
The research report offers an in-depth analysis based on Technology, Application, End User and Geography. It details leading market players, providing an overview of their business, product offerings, investments, revenue streams, and key applications. Additionally, the report includes insights into the competitive environment, SWOT analysis, current market trends, as well as the primary drivers and constraints. Furthermore, it discusses various factors that have driven market expansion in recent years. The report also explores market dynamics, regulatory scenarios, and technological advancements that are shaping the industry. It assesses the impact of external factors and global economic changes on market growth. Lastly, it provides strategic recommendations for new entrants and established companies to navigate the complexities of the market.
Future Outlook
- The Surgical Headlight Market will witness steady adoption driven by rising global surgical procedure volumes across multiple specialties.
- Technological advancements in LED illumination will continue to enhance brightness, color accuracy, and energy efficiency.
- Demand for lightweight and ergonomically designed surgical headlights will increase to reduce surgeon fatigue during prolonged procedures.
- Integration of surgical headlights with magnification loupes and digital visualization systems will gain wider acceptance.
- Ambulatory surgical centers will emerge as a key demand generator due to the shift toward outpatient surgical care.
- Growing focus on minimally invasive and precision-based surgeries will support sustained market growth.
- Manufacturers will increasingly emphasize battery performance improvements and wireless designs to enhance usability.
- Expansion of healthcare infrastructure in emerging economies will create new growth opportunities.
- Strategic partnerships and product innovations will intensify competition among established and mid-sized players.
- Rising emphasis on surgical safety, efficiency, and clinical outcomes will continue to drive long-term market demand.


