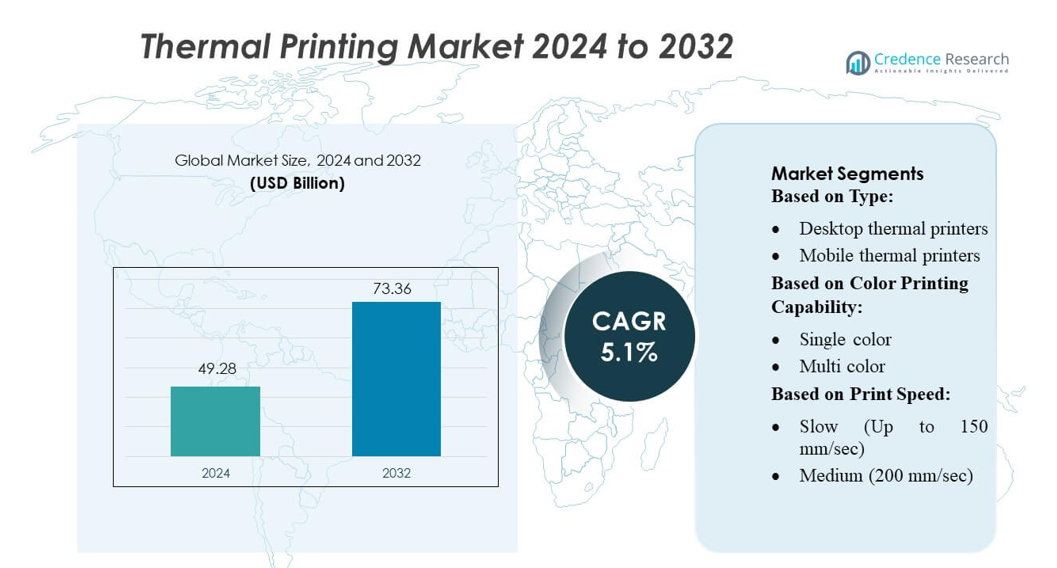
Home » Consumer Goods » Thermal Printing Market

Thermal Printing Market By Offering (Printer, Supplies) By Type (Barcode Printers, POS Printers, Kiosk & Ticket Printers, RFID Printers, Card Printers)-Growth, Future Prospects & Competitive Analysis, 2016 – 2030

Price: $4999

Published: | Report ID: 18245 | Report Format : PDF

Key Highlights of the Report

The global thermal printing market is segmented by offering, type, technology, application, and region. In terms of the offering, the printer segment dominates the global market, driven by the widespread adoption of thermal printers in various industries. The barcode printers lead the type category, with a substantial market revenue share due to the growing requirement for precise and efficient barcode printing in retail, logistics, and healthcare. In terms of technology, thermal transfer (TT) printing is the leading segment, as it offers cost-effective and hassle-free printing solutions by eliminating the need for ribbons or ink cartridges. Among applications, the retail sector is a key contributor, with thermal printers widely used for product labeling, pricing, and receipts, with North America as the dominating region.

The global thermal printing market is experiencing significant growth due to increasing demand for barcode and label printing solutions in various industries, rising adoption of e-commerce and online shopping, and the need for efficient and accurate printing technologies. However, the market faces challenges, such as the availability of alternative printing technologies and the environmental concerns associated with thermal paper waste.

Despite these restraints, the global thermal printing market presents opportunities for growth driven by the development of eco-friendly thermal printing solutions, advancements in printing technology, and the increasing use of thermal printers in sectors like healthcare, transportation, and retail.

Market Overview

The global thermal printing market has witnessed rapid growth in recent years and is estimated to grow at a CAGR of 4.5% between 2023 and 2030. The market was valued at USD 44.2 billion in 2022 and is anticipated to reach USD 60.15 billion in 2030.

Design Element 2

Access crucial information at unmatched prices!

Request your free sample report today & start making informed decisions powered by Credence Research!

Download Free Sample
CTA Design Element 3

What Are The Main Drivers Of The Global Thermal Printing Market?

The increasing demand for cost-effective and eco-friendly printing solutions, advancements in thermal printing technology such as improved print quality and faster printing speeds, the rise of e-commerce and the need for efficient logistics and supply chain operations, and stringent government regulations related to product labeling and traceability are the primary drivers of the global thermal printing market growth. Furthermore, the rising healthcare sector’s requirement for reliable and precise labeling and the Asia-Pacific region’s rapid industrialization and retail operations contribute to the market’s expansion.

What Are The Major Challenges The Global Thermal Printing Market Faces?

The global thermal printing market faces several challenges, including the threat of digitalization and the shift towards paperless transactions, which reduces the need for physical printing. Besides, the market faces challenges related to the high costs associated with thermal printing equipment and consumables and the increasing competition from alternative printing technologies. Moreover, the global market is susceptible to fluctuations in raw material prices, which can impact the profitability of thermal printing companies.

What Are The Growth Opportunities In The Global Thermal Printing Market?

The increasing adoption of thermal printing technology in retail, healthcare, and transportation & logistics sectors offers significant growth potential. The expanding e-commerce sector, with its increased demand for shipping labels and packaging, opens up new prospects for thermal printing solutions. Additionally, the expansion of the industrial and manufacturing sectors and the need for efficient barcode and labeling systems fuel the demand for thermal printers. Moreover, advancements in thermal printing technologies, such as mobile and wireless printing capabilities, open avenues for new applications and market expansion.

Executive Summary

Overview of the Global Thermal Printing Market

The thermal printing market refers to the industry involved in the manufacturing, distributing, and utilizing thermal printing technology and related products. The global thermal printing market is experiencing significant growth, driven by the increasing demand for efficient and reliable printing solutions across various industries. Thermal printing technology utilizes heat to produce high-quality prints on paper, labels, and receipts. Key factors driving the global market include the rising adoption of thermal printing in retail, healthcare, transportation, and logistics and the need for fast and accurate printing in industries such as manufacturing and hospitality. Additionally, advancements in thermal printing technology, such as developing wireless and mobile thermal printers, further fuel market growth.

Market Definition

Thermal printing is a digital process that utilizes heat to transfer ink or dye onto various materials, such as paper, labels, tags, and receipts. It offers fast and efficient printing capabilities, making it popular in retail, healthcare, transportation & logistics, and manufacturing industries. Thermal printing technology is used for various applications, including barcode and label printing, ticketing, point-of-sale receipts, shipping, packaging, and more. The market encompasses thermal printers, printing supplies (such as thermal paper and ribbons), software solutions, and associated services.

Thermal Printing Market

Market Insights

  • The global demand for thermal printing was valued at USD 44.2 Billion in 2022 and is expected to reach USD 60.15 Billion in 2030, growing at a CAGR of 4.5% between 2023 and 2030.
  • Barcode printers are the leading segment by type and hold over 34% share in value in 2022, while the RFID printers segment is likely to exhibit the fastest market CAGR during the forecast period.
  • The thermal transfer (TT) technology segment governs the global demand for thermal printing, holding a massive market share of over 42% in 2022, and is likely to grow at a higher CAGR.
  • The transportation & logistics application segment led the market in 2022, accounting for over 38% of the global revenue share.
  • In 2022, North America dominated the thermal printing market, accounting for over 42% of the global revenue.
  • The Asia Pacific region is likely to exhibit significant growth in the thermal printing market, attributed to expanding retail and e-commerce sectors in countries like China and India.

Segmentation by Offering

  • The printer is the leading segment by offering and held over 62% share in terms of value in 2022.
  • The supplies segment is experiencing rapid thermal printing market CAGR growth.

Segmentation by Type

  • The barcode printers segment captured the leading market revenue share with over 34% in 2022.
  • The RFID printers segment will likely grow at the highest CAGR during the projection period.
  • Other types, including POS printers, kiosk & ticket printers, and card printers, are likely to contribute substantially to the expansion of the thermal printing industry.

Segmentation by Technology

  • The dye diffusion thermal transfer (D2T2) segment will post the highest CAGR in the forecast period.
  • In 2022, the thermal transfer (TT) segment dominated the market, accounting for more than 42% of global revenue.

Segmentation by Application

  • The transportation & logistics segment captured the leading market revenue share with over 38% in 2022.
  • The retail segment will likely grow at the highest CAGR in the projection period.

Segmentation by Region

  • North America dominated the global thermal printing market in 2022, accounting for a significant revenue share.
  • Europe is another prominent global market for thermal printing, contributing substantially to the overall market share.
  • The Asia-Pacific region is experiencing rapid CAGR growth in the thermal printing market.
  • The rest of the World, including regions like the Middle East, Latin America, and Africa, is also witnessing the rapid adoption of thermal printing solutions.

The global thermal printing market is driven by increasing demand for barcode and label printing, the growing adoption of thermal printers in retail, and the need for reliable printing solutions. However, market challenges include competition from alternative printing technologies, high initial costs, and environmental concerns related to thermal transfer ribbons.

The United States is one of the leading countries in the global thermal printing market. The country has a well-established retail sector, including supermarkets, hypermarkets, and e-commerce platforms, which extensively utilize thermal printers for printing receipts, labels, and tags. The healthcare sector in the U.S. also relies on thermal printing technology for applications such as patient identification, wristbands, and prescription labeling. Additionally, the growing adoption of thermal printers in the transportation and logistics sector for printing shipping labels and barcodes further contributes to the market growth in the country.

China is a significant market for thermal printing due to its large manufacturing industry and booming e-commerce sector. The country’s manufacturing sector extensively uses thermal printers for labeling and printing product information, contributing to the demand for thermal printing solutions. Moreover, the Chinese government’s initiatives to improve supply chain management and enhance product traceability have led to the adoption of thermal printing technology in various industries like logistics, retail, and healthcare. The presence of numerous thermal printer manufacturers and competitive pricing in China’s market also plays a key role in its growth in the global thermal printing market.

Growing E-commerce Sector Across the Globe

The robust global expansion of the e-commerce sector is driving the demand for thermal printing solutions. With the growing popularity of online shopping, there is an increased demand for effective and quick printing of shipping labels, invoices, and receipts. Thermal printers offer quick, high-quality printing, making them ideal for e-commerce logistics and order fulfillment. The continuous growth of the e-commerce industry worldwide is likely to fuel the demand for thermal printing solutions.

Increasing Adoption of Barcoding and RFID Technologies

Barcoding and RFID (Radio Frequency Identification) technologies are widely used for inventory management, product tracking, and supply chain optimization. Thermal printing plays a crucial role in printing barcodes and RFID labels. As businesses across various industries, including retail, healthcare, manufacturing, and logistics, embrace barcoding and RFID solutions, the demand for thermal printing technology grows. The accuracy, durability, and ease of use of thermal printing for barcoding and RFID labels drive its adoption and contribute to market growth.

Higher Cost of Thermal Printers and Consumables

Thermal printers and their associated consumables, such as thermal paper and ribbons, can be relatively expensive compared to other printing technologies. The initial investment cost for thermal printers and the ongoing expenses for purchasing consumables can pose a financial challenge for small and medium-sized businesses. The high cost of ownership can deter some organizations from adopting thermal printing technology, especially in price-sensitive markets.

Emerging Advancements in Packaging and Labeling Applications

The increasing need for product identification, tracking, and information in various industries, such as food and beverage, healthcare, and retail, creates opportunities for thermal printing. Thermal printers offer fast and reliable printing of barcodes, labels, and tags, enabling accurate product identification and inventory management. With the growing focus on supply chain traceability, regulatory compliance, and brand recognition, thermal printing solutions that provide high-quality and durable printing for packaging and labeling applications are expected to experience significant demand.

Competitive Landscape

Key Players

The global thermal printing market is characterized by intense competition among key players striving to gain a competitive edge. Some of the main players in the global market and their market share are as follows:

  • Zebra Technologies Corporation
  • TSC Auto ID Technology Co. Ltd
  • Toshiba TEC Corporation
  • Honeywell International Inc
  • Bixolon Co. Ltd
  • Citizen Holdings Co. Ltd
  • Star Micronics Co. Ltd
  • Seiko Epson Corporation
  • SATO Holdings Corporation
  • HP India Sales Private Limited
  • Brother International Corporation

These companies engage in product innovation, strategic partnerships, and market expansion to gain a competitive edge. The market is driven by emerging technological advancements, increasing demand for barcode and label printing solutions, and the growing adoption of thermal printers in various industries. The competitive landscape is characterized by intense rivalry, focusing on product quality, performance, and price. Additionally, key players are investing in R&D to introduce advanced printing solutions and exploring opportunities in emerging markets to strengthen their global presence.

For instance, Additive Manufacturing Technologies (AMT), a global leader in the industrial sector and a provider of automated chemical vapor smoothing systems, partnered strategically with HP India Sales Private Limited on October 28th, 2020, to expand the thermal printing technology industry.

Similarly, SATO Holdings (Japan) introduced the CL4NX Plus, a thermal industrial printer built for durability and dependability in mission-critical track and trace applications worldwide, in January 2020.

Shape Your Report to Specific Countries or Regions & Enjoy 30% Off!

Summary of Key Findings

  • The global thermal printing market is expanding steadily, owing to rising demand for barcode and label printing across various industries.
  • Market segmented by offering, type, technology, application, and region.
  • The retail application sector is crucial in driving the global market, as thermal printers are widely used for product labeling and pricing.
  • Technological advancements, such as wireless and mobile thermal printing solutions, contribute to overall market growth.
  • Technological advancements, such as wireless and mobile thermal printing solutions, contribute to overall market growth.
  • Challenges in the market include the availability of alternative printing technologies and environmental concerns related to thermal transfer ribbons.

Future Outlook

  • The increasing adoption of e-commerce and logistics services drives the demand for thermal printing solutions for shipping labels and package tracking.
  • Integrating thermal printers with advanced connectivity options such as Bluetooth and Wi-Fi enables seamless connectivity and printing from multiple devices, enhancing convenience and productivity.
  • Key market players are investing in R&D activities to enhance product features, such as faster printing speeds, higher resolution, and improved durability of thermal printing solutions.
  • Government initiatives promoting digitalization and automation across industries are anticipated to create significant growth opportunities for the thermal printing market.

Segmentation

  • By Offering
    • Printer
    • Supplies
  • By Type
    • Barcode Printers
    • POS Printers
    • Kiosk & Ticket Printers
    • RFID Printers
    • Card Printers
  • By Technology
    • Direct Thermal (DT)
    • Thermal Transfer (TT)
    • Dye Diffusion Thermal Transfer (D2T2)
  • By Application
    • Retail
    • Transportation & Logistics
    • Manufacturing & Industrial
    • Healthcare & Hospitality
    • Others
  • By Region
  • North America
    • The U.S.
    • Canada
    • Mexico
  • Europe
    • Germany
    • France
    • The U.K.
    • Italy
    • Spain
    • Rest of Europe
  • Asia Pacific
    • China
    • Japan
    • India
    • South Korea
    • South-east Asia
    • Rest of Asia Pacific
  • Latin America
    • Brazil
    • Argentina
    • Rest of Latin America
  • Middle East & Africa
    • GCC Countries
    • South Africa
    • Rest of the Middle East and Africa

1. Preface
1.1. Report Description
1.1.1. Purpose of the Report
1.1.2. Target Audience
1.1.3. USP and Key Offerings
1.2. Research Scope
1.3. Research Methodology
1.3.1. Phase I – Secondary Research
1.3.2. Phase II – Data Modelling
1.3.2.1. Company Share Analysis Model
1.3.2.2. Revenue Based Modelling
1.3.3. Phase III – Primary Research
1.3.4. Research Limitations
1.3.5. Assumptions
1.4. Market Introduction
1.5. Market Research Scope

2. Executive Summary
2.1. Market Snapshot: Global Risk Management Software Market
2.2. Global Risk Management Software Market, By Component
2.3. Global Risk Management Software Market, By Deployment Model
2.4. Global Risk Management Software Market, By Enterprise Size
2.5. Global Risk Management Software Market, By Industry Vertical
2.6. Global Risk Management Software Market, By Region

3. Market Dynamics & Factors Analysis
3.1. Introduction
3.1.1. Global Risk Management Software Market Value, 2017-2030, (US$ Bn)
3.1.2. Y-o-Y Growth Trend Analysis
3.2. Market Dynamics
3.2.1. Market Drivers
3.2.1.1. Driver 1
3.2.1.2. Driver 2
3.2.1.3. Driver 3
3.2.2. Market Restraints
3.2.2.1. Restraint 1
3.2.2.2. Restraint 2
3.2.3. Market Opportunities
3.2.3.1. Opportunity 1
3.2.3.2. Opportunity 2
3.2.4. Major Industry Challenges
3.2.4.1. Challenge 1
3.2.4.2. Challenge 2
3.3. Growth and Development Patterns
3.4. Investment Feasibility Analysis
3.5. Market Opportunity Analysis
3.5.1. Component
3.5.2. Deployment Model
3.5.3. Enterprise Size
3.5.4. Geography

4. Premium Insights
4.1. STAR (Situation, Task, Action, Results) Analysis
4.2. Porter’s Five Forces Analysis
4.2.1. Threat of New Entrants
4.2.2. Bargaining Power of Buyers/Consumers
4.2.3. Bargaining Power of Suppliers
4.2.4. Threat of Substitute Components
4.2.5. Intensity of Competitive Rivalry
4.3. Key Market Trends
4.3.1. Demand Side Trends
4.3.2. Supply Side Trends
4.4. Value Chain Analysis
4.5. Component Analysis
4.6. Analysis and Recommendations
4.7. Marketing Strategy Analysis
4.7.1. Direct Marketing
4.7.2. Indirect Marketing
4.7.3. Marketing Channel Development Trend

5. Market Positioning of Key Players, 2022
5.1. Company market share of key players, 2022
5.2. Competitive Benchmarking
5.3. Market Positioning of Key Vendors
5.4. Geographical Presence Analysis
5.5. Major Strategies Adopted by Key Players
5.5.1. Key Strategies Analysis
5.5.2. Mergers and Acquisitions
5.5.3. Partnerships
5.5.4. Product Launch
5.5.5. Geographical Expansion
5.5.6. Others

6. Economic Impact Analysis
6.1. Recession Impact
6.1.1. North America
6.1.2. Europe
6.1.3. Asia Pacific
6.1.4. Latin America
6.1.5. Middle East and Africa
6.2. Ukraine-Russia War Impact
6.2.1. North America
6.2.2. Europe
6.2.3. Asia Pacific
6.2.4. Latin America
6.2.5. Middle East and Africa
6.3. COVID-19 Impact Analysis
6.3.1. North America
6.3.2. Europe
6.3.3. Asia Pacific
6.3.4. Latin America
6.3.5. Middle East and Africa

7. Global Risk Management Software Market, By Component
7.1. Global Risk Management Software Market Overview, by Component
7.1.1. Global Risk Management Software Market Revenue Share, By Component, 2022 Vs 2030 (in %)
7.2. Software
7.2.1. Global Risk Management Software Market, By Region, 2017-2030 (US$ Bn)
7.3. Service
7.3.1. Global Risk Management Software Market, By Region, 2017-2030 (US$ Bn)

8. Global Risk Management Software Market, By Deployment Model
8.1. Global Risk Management Software Market Overview, by Deployment Model
8.1.1. Global Risk Management Software Market, By Deployment Model, 2022 vs 2030 (in %)
8.2. On-premise
8.2.1. Global Risk Management Software Market, By Region, 2017-2030 (US$ Bn)
8.3. Cloud
8.3.1. Global Risk Management Software Market, By Region, 2017-2030 (US$ Bn)

9. Global Risk Management Software Market, by Enterprise Size, 2017-2030 (US$ Bn)
9.1. Global Risk Management Software Market Overview, by Enterprise Size
9.1.1. Global Risk Management Software Market, By Enterprise Size, 2022 vs 2030 (in%)
9.2. Large Enterprises
9.2.1. Global Risk Management Software Market, By Region, 2017-2030 (US$ Bn)
9.3. Small & Medium Enterprises
9.3.1. Global Risk Management Software Market, By Region, 2017-2030 (US$ Bn)

10. Global Risk Management Software Market, By Industry Vertical
10.1. Global Risk Management Software Market Overview, by Industry Vertical
10.1.1. Global Risk Management Software Market Revenue Share, By Industry Vertical, 2022 Vs 2030 (in %)
10.2. BFSI
10.2.1. Global Risk Management Software Market, By Region, 2017-2030 (US$ Bn)
10.3. IT & Telecom
10.3.1. Global Risk Management Software Market, By Region, 2017-2030 (US$ Bn)
10.4. Retail
10.4.1. Global Risk Management Software Market, By Region, 2017-2030 (US$ Bn)
10.5. Healthcare
10.5.1. Global Risk Management Software Market, By Region, 2017-2030 (US$ Bn)
10.6. Energy & Utilities
10.6.1. Global Risk Management Software Market, By Region, 2017-2030 (US$ Bn)
10.7. Manufacturing
10.7.1. Global Risk Management Software Market, By Region, 2017-2030 (US$ Bn)
10.8. Government & Defense
10.8.1. Global Risk Management Software Market, By Region, 2017-2030 (US$ Bn)
10.9. Others
10.9.1. Global Risk Management Software Market, By Region, 2017-2030 (US$ Bn)

11. Global Risk Management Software Market, By Region
11.1. Global Risk Management Software Market Overview, by Region
11.1.1. Global Risk Management Software Market, By Region, 2022 vs 2030 (in%)
11.2. Component
11.2.1. Global Risk Management Software Market, By Component, 2017-2030 (US$ Bn)
11.3. Deployment Model
11.3.1. Global Risk Management Software Market, By Deployment Model, 2017-2030 (US$ Bn)
11.4. Enterprise Size
11.4.1. Global Risk Management Software Market, By Enterprise Size, 2017-2030 (US$ Bn)
11.5. Industry Vertical
11.5.1. Global Risk Management Software Market, By Enterprise Size, 2017-2030 (US$ Bn)

12. North America Risk Management Software Market Analysis
12.1. North America Risk Management Software Market, by Component, 2017-2030(US$ Bn)
12.1.1. Overview
12.1.2. SRC Analysis
12.2. North America Risk Management Software Market, by Deployment Model, 2017-2030(US$ Bn)
12.2.1. Overview
12.2.2. SRC Analysis
12.3. North America Risk Management Software Market, by Enterprise Size, 2017-2030(US$ Bn)
12.3.1. Overview
12.3.2. SRC Analysis
12.4. North America Risk Management Software Market, by Industry Vertical, 2017-2030(US$ Bn)
12.4.1. Overview
12.4.2. SRC Analysis
12.5. North America Risk Management Software Market, by Country, 2017-2030 (US$ Bn)
12.5.1. North America Risk Management Software Market, by Country, 2022 Vs 2030 (in%)
12.5.2. U.S.
12.5.2.1. U.S. Risk Management Software Market Estimates and Forecast, 2017-2030 (US$ Bn)
12.5.2.2. U.S. Risk Management Software, By Component, 2017-2030 (US$ Bn)
12.5.2.3. U.S. Risk Management Software, By Deployment Model, 2017-2030 (US$ Bn)
12.5.2.4. U.S. Risk Management Software, By Enterprise Size, 2017-2030 (US$ Bn)
12.5.2.5. U.S. Risk Management Software, By Industry Vertical, 2017-2030 (US$ Bn)
12.5.3. Canada
12.5.3.1. Canada Risk Management Software Market Estimates and Forecast, 2017-2030 (US$ Bn)
12.5.3.2. Canada Risk Management Software, By Component, 2017-2030 (US$ Bn)
12.5.3.3. Canada Risk Management Software, By Deployment Model, 2017-2030 (US$ Bn)
12.5.3.4. Canada Risk Management Software, By Enterprise Size, 2017-2030 (US$ Bn)
12.5.3.5. Canada Risk Management Software, By Industry Vertical, 2017-2030 (US$ Bn)
12.5.4. Mexico
12.5.4.1. Mexico Risk Management Software Market Estimates and Forecast, 2017-2030 (US$ Bn)
12.5.4.2. Mexico Risk Management Software, By Component, 2017-2030 (US$ Bn)
12.5.4.3. Mexico Risk Management Software, By Deployment Model, 2017-2030 (US$ Bn)
12.5.4.4. Mexico Risk Management Software, By Enterprise Size, 2017-2030 (US$ Bn)
12.5.4.5. Mexico Risk Management Software, By Industry Vertical, 2017-2030 (US$ Bn)

13. Europe Risk Management Software Market Analysis
13.1. Europe Risk Management Software Market, by Component, 2017-2030(US$ Bn)
13.1.1. Overview
13.1.2. SRC Analysis
13.2. Europe Risk Management Software Market, by Deployment Model, 2017-2030(US$ Bn)
13.2.1. Overview
13.2.2. SRC Analysis
13.3. Europe Risk Management Software Market, by Enterprise Size, 2017-2030(US$ Bn)
13.3.1. Overview
13.3.2. SRC Analysis
13.4. Europe Risk Management Software Market, by Industry Vertical, 2017-2030(US$ Bn)
13.4.1. Overview
13.4.2. SRC Analysis
13.5. Europe Risk Management Software Market, by Country, 2017-2030 (US$ Bn)
13.5.1. Europe Risk Management Software Market, by Country, 2022 Vs 2030 (in%)
13.5.2. Germany
13.5.2.1. Germany Risk Management Software Market Estimates and Forecast, 2017-2030 (US$ Bn)
13.5.2.2. Germany Risk Management Software, By Component, 2017-2030 (US$ Bn)
13.5.2.3. Germany Risk Management Software, By Deployment Model, 2017-2030 (US$ Bn)
13.5.2.4. Germany Risk Management Software, By Enterprise Size, 2017-2030 (US$ Bn)
13.5.2.5. Germany Risk Management Software, By Industry Vertical, 2017-2030 (US$ Bn)
13.5.3. France
13.5.3.1. France Risk Management Software Market Estimates and Forecast, 2017-2030 (US$ Bn)
13.5.3.2. France Risk Management Software, By Component, 2017-2030 (US$ Bn)
13.5.3.3. France Risk Management Software, By Deployment Model, 2017-2030 (US$ Bn)
13.5.3.4. France Risk Management Software, By Enterprise Size, 2017-2030 (US$ Bn)
13.5.3.5. France Risk Management Software, By Industry Vertical, 2017-2030 (US$ Bn)
13.5.4. UK
13.5.4.1. UK Risk Management Software Market Estimates and Forecast, 2017-2030 (US$ Bn)
13.5.4.2. UK Risk Management Software, By Component, 2017-2030 (US$ Bn)
13.5.4.3. UK Risk Management Software, By Deployment Model, 2017-2030 (US$ Bn)
13.5.4.4. UK Risk Management Software, By Enterprise Size, 2017-2030 (US$ Bn)
13.5.4.5. UK Risk Management Software, By Industry Vertical, 2017-2030 (US$ Bn)
13.5.5. Italy
13.5.5.1. Italy Risk Management Software Market Estimates and Forecast, 2017-2030 (US$ Bn)
13.5.5.2. Italy Risk Management Software, By Component, 2017-2030 (US$ Bn)
13.5.5.3. Italy Risk Management Software, By Deployment Model, 2017-2030 (US$ Bn)
13.5.5.4. Italy Risk Management Software, By Enterprise Size, 2017-2030 (US$ Bn)
13.5.5.5. Italy Risk Management Software, By Industry Vertical, 2017-2030 (US$ Bn)
13.5.6. Spain
13.5.6.1. Spain Risk Management Software Market Estimates and Forecast, 2017-2030 (US$ Bn)
13.5.6.2. Spain Risk Management Software, By Component, 2017-2030 (US$ Bn)
13.5.6.3. Spain Risk Management Software, By Deployment Model, 2017-2030 (US$ Bn)
13.5.6.4. Spain Risk Management Software, By Enterprise Size, 2017-2030 (US$ Bn)
13.5.6.5. Spain Risk Management Software, By Industry Vertical, 2017-2030 (US$ Bn)
13.5.7. Rest of Europe
13.5.7.1. Rest of Europe Risk Management Software Market Estimates and Forecast, 2017-2030 (US$ Bn)
13.5.7.2. Rest of Europe Risk Management Software, By Component, 2017-2030 (US$ Bn)
13.5.7.3. Rest of Europe Risk Management Software, By Deployment Model, 2017-2030 (US$ Bn)
13.5.7.4. Rest of Europe Risk Management Software, By Enterprise Size, 2017-2030 (US$ Bn)
13.5.7.5. Rest of Europe Risk Management Software, By Industry Vertical, 2017-2030 (US$ Bn)

14. Asia Pacific Risk Management Software Market Analysis
14.1. Asia Pacific Risk Management Software Market, by Component, 2017-2030(US$ Bn)
14.1.1. Overview
14.1.2. SRC Analysis
14.2. Asia Pacific Risk Management Software Market, by Deployment Model, 2017-2030(US$ Bn)
14.2.1. Overview
14.2.2. SRC Analysis
14.3. Asia Pacific Risk Management Software Market, by Enterprise Size, 2017-2030(US$ Bn)
14.3.1. Overview
14.3.2. SRC Analysis
14.4. Asia Pacific Risk Management Software Market, by Industry Vertical, 2017-2030(US$ Bn)
14.4.1. Overview
14.4.2. SRC Analysis
14.5. Asia Pacific Risk Management Software Market, by Country, 2017-2030 (US$ Bn)
14.5.1. Asia Pacific Risk Management Software Market, by Country, 2022 Vs 2030 (in%)
14.5.2. China
14.5.2.1. China Risk Management Software Market Estimates and Forecast, 2017-2030 (US$ Bn)
14.5.2.2. China Risk Management Software, By Component, 2017-2030 (US$ Bn)
14.5.2.3. China Risk Management Software, By Deployment Model, 2017-2030 (US$ Bn)
14.5.2.4. China Risk Management Software, By Enterprise Size, 2017-2030 (US$ Bn)
14.5.2.5. China Risk Management Software, By Industry Vertical, 2017-2030 (US$ Bn)
14.5.3. Japan
14.5.3.1. Japan Risk Management Software Market Estimates and Forecast, 2017-2030 (US$ Bn)
14.5.3.2. Japan Risk Management Software, By Component, 2017-2030 (US$ Bn)
14.5.3.3. Japan Risk Management Software, By Deployment Model, 2017-2030 (US$ Bn)
14.5.3.4. Japan Risk Management Software, By Enterprise Size, 2017-2030 (US$ Bn)
14.5.3.5. Japan Risk Management Software, By Industry Vertical, 2017-2030 (US$ Bn)
14.5.4. India
14.5.4.1. India Risk Management Software Market Estimates and Forecast, 2017-2030 (US$ Bn)
14.5.4.2. India Risk Management Software, By Component, 2017-2030 (US$ Bn)
14.5.4.3. India Risk Management Software, By Deployment Model, 2017-2030 (US$ Bn)
14.5.4.4. India Risk Management Software, By Enterprise Size, 2017-2030 (US$ Bn)
14.5.4.5. India Risk Management Software, By Industry Vertical, 2017-2030 (US$ Bn)
14.5.5. South Korea
14.5.5.1. South Korea Risk Management Software Market Estimates and Forecast, 2017-2030 (US$ Bn)
14.5.5.2. South Korea Risk Management Software, By Component, 2017-2030 (US$ Bn)
14.5.5.3. South Korea Risk Management Software, By Deployment Model, 2017-2030 (US$ Bn)
14.5.5.4. South Korea Risk Management Software, By Enterprise Size, 2017-2030 (US$ Bn)
14.5.5.5. South Korea Risk Management Software, By Industry Vertical, 2017-2030 (US$ Bn)
14.5.6. South-East Asia
14.5.6.1. South-East Asia Risk Management Software Market Estimates and Forecast, 2017-2030 (US$ Bn)
14.5.6.2. South-East Asia Risk Management Software, By Component, 2017-2030 (US$ Bn)
14.5.6.3. South-East Asia Risk Management Software, By Deployment Model, 2017-2030 (US$ Bn)
14.5.6.4. South-East Asia Risk Management Software, By Enterprise Size, 2017-2030 (US$ Bn)
14.5.6.5. South East Asia Risk Management Software, By Industry Vertical, 2017-2030 (US$ Bn)
14.5.7. Rest of Asia Pacific
14.5.7.1. Rest of Asia Pacific Risk Management Software Market Estimates and Forecast, 2017-2030 (US$ Bn)
14.5.7.2. Rest of Asia Pacific Risk Management Software, By Component, 2017-2030 (US$ Bn)
14.5.7.3. Rest of Asia Pacific Risk Management Software, By Deployment Model, 2017-2030 (US$ Bn)
14.5.7.4. Rest of Asia Pacific Risk Management Software, By Enterprise Size, 2017-2030 (US$ Bn)
14.5.7.5. Rest of Asia Pacific Risk Management Software, By Industry Vertical, 2017-2030 (US$ Bn)

15. Latin America Risk Management Software Market Analysis
15.1. Latin America Risk Management Software Market, by Component, 2017-2030(US$ Bn)
15.1.1. Overview
15.1.2. SRC Analysis
15.2. Latin America Risk Management Software Market, by Deployment Model, 2017-2030(US$ Bn)
15.2.1. Overview
15.2.2. SRC Analysis
15.3. Latin America Risk Management Software Market, by Enterprise Size, 2017-2030(US$ Bn)
15.3.1. Overview
15.3.2. SRC Analysis
15.4. Latin America Risk Management Software Market, by Industry Vertical, 2017-2030(US$ Bn)
15.4.1. Overview
15.4.2. SRC Analysis
15.5. Latin America Risk Management Software Market, by Country, 2017-2030 (US$ Bn)
15.5.1. Latin America Risk Management Software Market, by Country, 2022 Vs 2030 (in%)
15.5.2. Brazil
15.5.2.1. Brazil Risk Management Software Market Estimates and Forecast, 2017-2030 (US$ Bn)
15.5.2.2. Brazil Risk Management Software, By Component, 2017-2030 (US$ Bn)
15.5.2.3. Brazil Risk Management Software, By Deployment Model, 2017-2030 (US$ Bn)
15.5.2.4. Brazil Risk Management Software, By Enterprise Size, 2017-2030 (US$ Bn)
15.5.2.5. Brazil Risk Management Software, By Industry Vertical, 2017-2030 (US$ Bn)
15.5.3. Argentina
15.5.3.1. Argentina Risk Management Software Market Estimates and Forecast, 2017-2030 (US$ Bn)
15.5.3.2. Argentina Risk Management Software, By Component, 2017-2030 (US$ Bn)
15.5.3.3. Argentina Risk Management Software, By Deployment Model, 2017-2030 (US$ Bn)
15.5.3.4. Argentina Risk Management Software, By Enterprise Size, 2017-2030 (US$ Bn)
15.5.3.5. Argentina Risk Management Software, By Industry Vertical, 2017-2030 (US$ Bn)
15.5.4. Rest of Latin America
15.5.4.1. Rest of Latin America Risk Management Software Market Estimates and Forecast, 2017-2030 (US$ Bn)
15.5.4.2. Rest of Latin America Risk Management Software, By Component, 2017-2030 (US$ Bn)
15.5.4.3. Rest of Latin America Risk Management Software, By Deployment Model, 2017-2030 (US$ Bn)
15.5.4.4. Rest of Latin America Risk Management Software, By Enterprise Size, 2017-2030 (US$ Bn)
15.5.4.5. Rest of Latin America Risk Management Software, By Industry Vertical, 2017-2030 (US$ Bn)

16. Middle East and Africa Risk Management Software Market Analysis
16.1. Middle East and Africa Risk Management Software Market, by Component, 2017-2030(US$ Bn)
16.1.1. Overview
16.1.2. SRC Analysis
16.2. Middle East and Africa Risk Management Software Market, by Deployment Model, 2017-2030(US$ Bn)
16.2.1. Overview
16.2.2. SRC Analysis
16.3. Middle East and Africa Risk Management Software Market, by Enterprise Size, 2017-2030(US$ Bn)
16.3.1. Overview
16.3.2. SRC Analysis
16.4. Middle East and Africa Risk Management Software Market, by Industry Vertical, 2017-2030(US$ Bn)
16.4.1. Overview
16.4.2. SRC Analysis
16.5. Middle East and Africa Risk Management Software Market, by Country, 2017-2030 (US$ Bn)
16.5.1. Middle East and Africa Risk Management Software Market, by Country, 2022 Vs 2030 (in%)
16.5.2. GCC Countries
16.5.2.1. GCC Countries Risk Management Software Market Estimates and Forecast, 2017-2030 (US$ Bn)
16.5.2.2. GCC Countries Risk Management Software, By Component, 2017-2030 (US$ Bn)
16.5.2.3. GCC Countries Risk Management Software, By Deployment Model, 2017-2030 (US$ Bn)
16.5.2.4. GCC Countries Risk Management Software, By Enterprise Size, 2017-2030 (US$ Bn)
16.5.2.5. GCC Countries Risk Management Software, By Industry Vertical, 2017-2030 (US$ Bn)
16.5.3. South Africa
16.5.3.1. South Africa Risk Management Software Market Estimates and Forecast, 2017-2030 (US$ Bn)
16.5.3.2. South Africa Risk Management Software, By Component, 2017-2030 (US$ Bn)
16.5.3.3. South Africa Risk Management Software, By Deployment Model, 2017-2030 (US$ Bn)
16.5.3.4. South Africa Risk Management Software, By Enterprise Size, 2017-2030 (US$ Bn)
16.5.3.5. South Africa Risk Management Software, By Industry Vertical, 2017-2030 (US$ Bn)
16.5.4. Rest of Middle East and Africa
16.5.4.1. Rest of Middle East and Africa Risk Management Software Market Estimates and Forecast, 2017-2030 (US$ Bn)
16.5.4.2. Rest of Middle East and Africa Risk Management Software, By Component, 2017-2030 (US$ Bn)
16.5.4.3. Rest of Middle East and Africa Risk Management Software, By Deployment Model, 2017-2030 (US$ Bn)
16.5.4.4. Rest of Middle East and Africa Risk Management Software, By Enterprise Size, 2017-2030 (US$ Bn)
16.5.4.5. Rest of Middle East and Africa Risk Management Software, By Industry Vertical, 2017-2030 (US$ Bn)

17. Company Profiles
17.1. INTERNATIONAL BUSINESS MACHINES CORPORATION
17.1.1. Company Overview
17.1.2. Products/Services Portfolio
17.1.3. Geographical Presence
17.1.4. Financial Summary
17.1.4.1. Market Revenue and Net Profit (2019-2022)
17.1.4.2. Business Segment Revenue Analysis
17.1.4.3. Geographical Revenue Analysis
17.2. LOCKPATH, INC.
17.3. LOGICMANAGER, INC.
17.4. METRICSTREAM INC.
17.5. QUALYS, INC.
17.6. RSA SECURITY LLC.
17.7. SAP SE
17.8. SAS INSTITUTE INC
17.9. SERVICENOW

List of Figures
FIG. 1 Global Risk Management Software Market: Research Methodology
FIG. 2 Market Size Estimation – Top Down & Bottom up Approach
FIG. 3 Global Risk Management Software Market Segmentation
FIG. 4 Global Risk Management Software Market, by Component, 2022 (US$ Bn)
FIG. 5 Global Risk Management Software Market, by Deployment Model, 2022 (US$ Bn)
FIG. 6 Global Risk Management Software Market, by Enterprise Size, 2022 (US$ Bn)
FIG. 7 Global Risk Management Software Market, by Industry Vertical, 2022 (US$ Bn)
FIG. 8 Global Risk Management Software Market, by Geography, 2022 (US$ Bn)
FIG. 9 Attractive Investment Proposition, by Component, 2022
FIG. 10 Attractive Investment Proposition, by Deployment Model, 2022
FIG. 11 Attractive Investment Proposition, by Enterprise Size, 2022
FIG. 12 Attractive Investment Proposition, by Industry Vertical, 2022
FIG. 13 Attractive Investment Proposition, by Geography, 2022
FIG. 14 Global Market Share Analysis of Key Risk Management Software Market Manufacturers, 2022
FIG. 15 Global Market Positioning of Key Risk Management Software Market Manufacturers, 2022
FIG. 16 Global Risk Management Software Market Value Contribution, By Component, 2022 & 2030 (Value %)
FIG. 17 Global Risk Management Software Market, by Software, Value, 2017-2030 (US$ Bn)
FIG. 18 Global Risk Management Software Market, by Service, Value, 2017-2030 (US$ Bn)
FIG. 19 Global Risk Management Software Market Value Contribution, By Deployment Model, 2022 & 2030 (Value %)
FIG. 20 Global Risk Management Software Market, by On-premise, Value, 2017-2030 (US$ Bn)
FIG. 21 Global Risk Management Software Market, by Cloud, 2017-2030 (US$ Bn)
FIG. 22 Global Risk Management Software Market Value Contribution, By Enterprise Size, 2022 & 2030 (Value %)
FIG. 23 Global Risk Management Software Market, by Large Enterprises, Value, 2017-2030 (US$ Bn)
FIG. 24 Global Risk Management Software Market, by Small & Medium Enterprises, 2017-2030 (US$ Bn)
FIG. 25 Global Risk Management Software Market Value Contribution, By Industry Vertical, 2022 & 2030 (Value %)
FIG. 26 Global Risk Management Software Market, by BFSI, Value, 2017-2030 (US$ Bn)
FIG. 27 Global Risk Management Software Market, by IT & Telecom, 2017-2030 (US$ Bn)
FIG. 28 Global Risk Management Software Market, by Retail, 2017-2030 (US$ Bn)
FIG. 29 Global Risk Management Software Market, by Healthcare, 2017-2030 (US$ Bn)
FIG. 30 Global Risk Management Software Market, by Energy & Utilities, 2017-2030 (US$ Bn)
FIG. 31 Global Risk Management Software Market, by Manufacturing, 2017-2030 (US$ Bn)
FIG. 32 Global Risk Management Software Market, by Government & Defense, 2017-2030 (US$ Bn)
FIG. 33 Global Risk Management Software Market, by Others, 2017-2030 (US$ Bn)
FIG. 34 North America Risk Management Software Market, 2017-2030 (US$ Bn)
FIG. 35 U.S. Risk Management Software Market, 2017-2030 (US$ Bn)
FIG. 36 Canada Risk Management Software Market, 2017-2030 (US$ Bn)
FIG. 37 Europe Risk Management Software Market, 2017-2030 (US$ Bn)
FIG. 38 Germany Risk Management Software Market, 2017-2030 (US$ Bn)
FIG. 39 France Risk Management Software Market, 2017-2030 (US$ Bn)
FIG. 40 U.K. Risk Management Software Market, 2017-2030 (US$ Bn)
FIG. 41 Italy Risk Management Software Market, 2017-2030 (US$ Bn)
FIG. 42 Spain Risk Management Software Market, 2017-2030 (US$ Bn)
FIG. 43 Rest of Europe Risk Management Software Market, 2017-2030 (US$ Bn)
FIG. 44 Asia Pacific Risk Management Software Market, 2017-2030 (US$ Bn)
FIG. 45 China Risk Management Software Market, 2017-2030 (US$ Bn)
FIG. 46 Japan Risk Management Software Market, 2017-2030 (US$ Bn)
FIG. 47 India Risk Management Software Market, 2017-2030 (US$ Bn)
FIG. 48 South Korea Risk Management Software Market, 2017-2030 (US$ Bn)
FIG. 49 South-East Asia Risk Management Software Market, 2017-2030 (US$ Bn)
FIG. 50 Rest of Asia Pacific Risk Management Software Market, 2017-2030 (US$ Bn)
FIG. 51 Latin America Risk Management Software Market, 2017-2030 (US$ Bn)
FIG. 52 Brazil Risk Management Software Market, 2017-2030 (US$ Bn)
FIG. 53 Mexico Risk Management Software Market, 2017-2030 (US$ Bn)
FIG. 54 Rest of Latin America Risk Management Software Market, 2017-2030 (US$ Bn)
FIG. 55 Middle East & Africa Risk Management Software Market, 2017-2030 (US$ Bn)
FIG. 56 GCC Countries Risk Management Software Market, 2017-2030 (US$ Bn)
FIG. 57 South Africa Risk Management Software Market, 2017-2030 (US$ Bn)
FIG. 58 Rest of Middle East and Africa Risk Management Software Market, 2017-2030 (US$ Bn)

List of Tables
TABLE 1 Market Snapshot: Global Risk Management Software Market
TABLE 2 Global Risk Management Software Market: Market Drivers Impact Analysis
TABLE 3 Global Risk Management Software Market: Market Restraints Impact Analysis
TABLE 4 Global Risk Management Software Market, by Competitive Benchmarking, 2022
TABLE 5 Global Risk Management Software Market, by Geographical Presence Analysis, 2022
TABLE 6 Global Risk Management Software Market, by Key Strategies Analysis, 2022
TABLE 7 Global Risk Management Software Market, by Software, By Region, 2017-2022 (US$ Bn)
TABLE 8 Global Risk Management Software Market, by Software, By Region, 2023-2030 (US$ Bn)
TABLE 9 Global Risk Management Software Market, by Service, By Region, 2017-2022 (US$ Bn)
TABLE 10 Global Risk Management Software Market, by Service, By Region, 2023-2030 (US$ Bn)
TABLE 11 Global Risk Management Software Market, by On-premise, By Region, 2017-2022 (US$ Bn)
TABLE 12 Global Risk Management Software Market, by On-premise, By Region, 2023-2030 (US$ Bn)
TABLE 13 Global Risk Management Software Market, by Cloud, By Region, 2017-2022 (US$ Bn)
TABLE 14 Global Risk Management Software Market, by Cloud, By Region, 2023-2030 (US$ Bn)
TABLE 15 Global Risk Management Software Market, by Large Enterprises, By Region, 2017-2022 (US$ Bn)
TABLE 16 Global Risk Management Software Market, by Large Enterprises, By Region, 2023-2030 (US$ Bn)
TABLE 17 Global Risk Management Software Market, by Small & Medium Enterprises, By Region, 2017-2022 (US$ Bn)
TABLE 18 Global Risk Management Software Market, by Small & Medium Enterprises, By Region, 2023-2030 (US$ Bn)
TABLE 19 Global Risk Management Software Market, by Others, By Region, 2017-2022 (US$ Bn)
TABLE 20 Global Risk Management Software Market, by Others, By Region, 2023-2030 (US$ Bn)
TABLE 21 Global Risk Management Software Market, by BFSI, By Region, 2017-2022 (US$ Bn)
TABLE 22 Global Risk Management Software Market, by BFSI, By Region, 2023-2030 (US$ Bn)
TABLE 23 Global Risk Management Software Market, by IT & Telecom, By Region, 2017-2022 (US$ Bn)
TABLE 24 Global Risk Management Software Market, by IT & Telecom, By Region, 2023-2030 (US$ Bn)
TABLE 25 Global Risk Management Software Market, by Retail, By Region, 2017-2022 (US$ Bn)
TABLE 26 Global Risk Management Software Market, by Retail, By Region, 2023-2030 (US$ Bn)
TABLE 27 Global Risk Management Software Market, by Healthcare, By Region, 2017-2022 (US$ Bn)
TABLE 28 Global Risk Management Software Market, by Healthcare, By Region, 2023-2030 (US$ Bn)
TABLE 29 Global Risk Management Software Market, by Energy & Utilities, By Region, 2017-2022 (US$ Bn)
TABLE 30 Global Risk Management Software Market, by Energy & Utilities, By Region, 2023-2030 (US$ Bn)
TABLE 31 Global Risk Management Software Market, by Manufacturing, By Region, 2017-2022 (US$ Bn)
TABLE 32 Global Risk Management Software Market, by Manufacturing, By Region, 2023-2030 (US$ Bn)
TABLE 33 Global Risk Management Software Market, by Government & Defense, By Region, 2017-2022 (US$ Bn)
TABLE 34 Global Risk Management Software Market, by Government & Defense, By Region, 2023-2030 (US$ Bn)
TABLE 35 Global Risk Management Software Market, by Others, By Region, 2017-2022 (US$ Bn)
TABLE 36 Global Risk Management Software Market, by Others, By Region, 2023-2030 (US$ Bn)
TABLE 37 Global Risk Management Software Market, by Component, 2017-2022 (US$ Bn)
TABLE 38 Global Risk Management Software Market, by Component, 2023-2030 (US$ Bn)
TABLE 39 Global Risk Management Software Market, by Deployment Model, 2017-2022 (US$ Bn)
TABLE 40 Global Risk Management Software Market, by Deployment Model, 2023-2030 (US$ Bn)
TABLE 41 Global Risk Management Software Market, by Enterprise Size, 2017-2022 (US$ Bn)
TABLE 42 Global Risk Management Software Market, by Enterprise Size, 2023-2030 (US$ Bn)
TABLE 43 Global Risk Management Software Market, by Industry Vertical, 2017-2022 (US$ Bn)
TABLE 44 Global Risk Management Software Market, by Industry Vertical, 2023-2030 (US$ Bn)
TABLE 45 Global Risk Management Software Market, by Region, 2017-2022 (US$ Bn)
TABLE 46 Global Risk Management Software Market, by Region, 2023-2030 (US$ Bn)
TABLE 47 North America Risk Management Software Market, by Component, 2017-2022 (US$ Bn)
TABLE 48 North America Risk Management Software Market, by Component, 2023-2030 (US$ Bn)
TABLE 49 North America Risk Management Software Market, by Deployment Model, 2017-2022 (US$ Bn)
TABLE 50 North America Risk Management Software Market, by Deployment Model, 2023-2030 (US$ Bn)
TABLE 51 North America Risk Management Software Market, by Enterprise Size, 2017-2022 (US$ Bn)
TABLE 52 North America Risk Management Software Market, by Enterprise Size, 2023-2030 (US$ Bn)
TABLE 53 North America Risk Management Software Market, by Industry Vertical, 2017-2022 (US$ Bn)
TABLE 54 North America Risk Management Software Market, by Industry Vertical, 2023-2030 (US$ Bn)
TABLE 55 North America Risk Management Software Market, by Country, 2017-2022 (US$ Bn)
TABLE 56 North America Risk Management Software Market, by Country, 2023-2030 (US$ Bn)
TABLE 57 United States Risk Management Software Market, by Component, 2017-2022 (US$ Bn)
TABLE 58 United States Risk Management Software Market, by Component, 2023-2030 (US$ Bn)
TABLE 59 United States Risk Management Software Market, by Deployment Model, 2017-2022 (US$ Bn)
TABLE 60 United States Risk Management Software Market, by Deployment Model, 2023-2030 (US$ Bn)
TABLE 61 United States Risk Management Software Market, by Enterprise Size, 2017-2022 (US$ Bn)
TABLE 62 United States Risk Management Software Market, by Enterprise Size, 2023-2030 (US$ Bn)
TABLE 63 United States Risk Management Software Market, by Industry Vertical, 2017-2022 (US$ Bn)
TABLE 64 United States Risk Management Software Market, by Industry Vertical, 2023-2030 (US$ Bn)
TABLE 65 Canada Risk Management Software Market, by Component, 2017-2022 (US$ Bn)
TABLE 66 Canada Risk Management Software Market, by Component, 2023-2030 (US$ Bn)
TABLE 67 Canada Risk Management Software Market, by Deployment Model, 2017-2022 (US$ Bn)
TABLE 68 Canada Risk Management Software Market, by Deployment Model, 2023-2030 (US$ Bn)
TABLE 69 Canada Risk Management Software Market, by Enterprise Size, 2017-2022 (US$ Bn)
TABLE 70 Canada Risk Management Software Market, by Enterprise Size, 2023-2030 (US$ Bn)
TABLE 71 Canada Risk Management Software Market, by Industry Vertical, 2017-2022 (US$ Bn)
TABLE 72 Canada Risk Management Software Market, by Industry Vertical, 2023-2030 (US$ Bn)
TABLE 73 Mexico Risk Management Software Market, by Component, 2017-2022 (US$ Bn)
TABLE 74 Mexico Risk Management Software Market, by Component, 2023-2030 (US$ Bn)
TABLE 75 Mexico Risk Management Software Market, by Deployment Model, 2017-2022 (US$ Bn)
TABLE 76 Mexico Risk Management Software Market, by Deployment Model, 2023-2030 (US$ Bn)
TABLE 77 Mexico Risk Management Software Market, by Enterprise Size, 2017-2022 (US$ Bn)
TABLE 78 Mexico Risk Management Software Market, by Enterprise Size, 2023-2030 (US$ Bn)
TABLE 79 Mexico Risk Management Software Market, by Industry Vertical, 2017-2022 (US$ Bn)
TABLE 80 Mexico Risk Management Software Market, by Industry Vertical, 2023-2030 (US$ Bn)
TABLE 81 Europe Risk Management Software Market, by Component, 2017-2022 (US$ Bn)
TABLE 82 Europe Risk Management Software Market, by Component, 2023-2030 (US$ Bn)
TABLE 83 Europe Risk Management Software Market, by Deployment Model, 2017-2022 (US$ Bn)
TABLE 84 Europe Risk Management Software Market, by Deployment Model, 2023-2030 (US$ Bn)
TABLE 85 Europe Risk Management Software Market, by Enterprise Size, 2017-2022 (US$ Bn)
TABLE 86 Europe Risk Management Software Market, by Enterprise Size, 2023-2030 (US$ Bn)
TABLE 87 Europe Risk Management Software Market, by Industry Vertical, 2017-2022 (US$ Bn)
TABLE 88 Europe Risk Management Software Market, by Industry Vertical, 2023-2030 (US$ Bn)
TABLE 89 Europe Risk Management Software Market, by Country, 2017-2022 (US$ Bn)
TABLE 90 Europe Risk Management Software Market, by Country, 2023-2030 (US$ Bn)
TABLE 91 Germany Risk Management Software Market, by Component, 2017-2022 (US$ Bn)
TABLE 92 Germany Risk Management Software Market, by Component, 2023-2030 (US$ Bn)
TABLE 93 Germany Risk Management Software Market, by Deployment Model, 2017-2022 (US$ Bn)
TABLE 94 Germany Risk Management Software Market, by Deployment Model, 2023-2030 (US$ Bn)
TABLE 95 Germany Risk Management Software Market, by Enterprise Size, 2017-2022 (US$ Bn)
TABLE 96 Germany Risk Management Software Market, by Enterprise Size, 2023-2030 (US$ Bn)
TABLE 97 Germany Risk Management Software Market, by Industry Vertical, 2017-2022 (US$ Bn)
TABLE 98 Germany Risk Management Software Market, by Industry Vertical, 2023-2030 (US$ Bn)
TABLE 99 France Risk Management Software Market, by Component, 2017-2022 (US$ Bn)
TABLE 100 France Risk Management Software Market, by Component, 2023-2030 (US$ Bn)
TABLE 101 France Risk Management Software Market, by Deployment Model, 2017-2022 (US$ Bn)
TABLE 102 France Risk Management Software Market, by Deployment Model, 2023-2030 (US$ Bn)
TABLE 103 France Risk Management Software Market, by Enterprise Size, 2017-2022 (US$ Bn)
TABLE 104 France Risk Management Software Market, by Enterprise Size, 2023-2030 (US$ Bn)
TABLE 105 France Risk Management Software Market, by Industry Vertical, 2017-2022 (US$ Bn)
TABLE 106 France Risk Management Software Market, by Industry Vertical, 2023-2030 (US$ Bn)
TABLE 107 United Kingdom Risk Management Software Market, by Component, 2017-2022 (US$ Bn)
TABLE 108 United Kingdom Risk Management Software Market, by Component, 2023-2030 (US$ Bn)
TABLE 109 United Kingdom Risk Management Software Market, by Deployment Model, 2017-2022 (US$ Bn)
TABLE 110 United Kingdom Risk Management Software Market, by Deployment Model, 2023-2030 (US$ Bn)
TABLE 111 United Kingdom Risk Management Software Market, by Enterprise Size, 2017-2022 (US$ Bn)
TABLE 112 United Kingdom Risk Management Software Market, by Enterprise Size, 2023-2030 (US$ Bn)
TABLE 113 United Kingdom Risk Management Software Market, by Industry Vertical, 2017-2022 (US$ Bn)
TABLE 114 United Kingdom Risk Management Software Market, by Industry Vertical, 2023-2030 (US$ Bn)
TABLE 115 Italy Risk Management Software Market, by Component, 2017-2022 (US$ Bn)
TABLE 116 Italy Risk Management Software Market, by Component, 2023-2030 (US$ Bn)
TABLE 117 Italy Risk Management Software Market, by Deployment Model, 2017-2022 (US$ Bn)
TABLE 118 Italy Risk Management Software Market, by Deployment Model, 2023-2030 (US$ Bn)
TABLE 119 Italy Risk Management Software Market, by Enterprise Size, 2017-2022 (US$ Bn)
TABLE 120 Italy Risk Management Software Market, by Enterprise Size, 2023-2030 (US$ Bn)
TABLE 121 Italy Risk Management Software Market, by Industry Vertical, 2017-2022 (US$ Bn)
TABLE 122 Italy Risk Management Software Market, by Industry Vertical, 2023-2030 (US$ Bn)
TABLE 123 Spain Risk Management Software Market, by Component, 2017-2022 (US$ Bn)
TABLE 124 Spain Risk Management Software Market, by Component, 2023-2030 (US$ Bn)
TABLE 125 Spain Risk Management Software Market, by Deployment Model, 2017-2022 (US$ Bn)
TABLE 126 Spain Risk Management Software Market, by Deployment Model, 2023-2030 (US$ Bn)
TABLE 127 Spain Risk Management Software Market, by Enterprise Size, 2017-2022 (US$ Bn)
TABLE 128 Spain Risk Management Software Market, by Enterprise Size, 2023-2030 (US$ Bn)
TABLE 129 Spain Risk Management Software Market, by Industry Vertical, 2017-2022 (US$ Bn)
TABLE 130 Spain Risk Management Software Market, by Industry Vertical, 2023-2030 (US$ Bn)
TABLE 131 Rest of Europe Risk Management Software Market, by Component, 2017-2022 (US$ Bn)
TABLE 132 Rest of Europe Risk Management Software Market, by Component, 2023-2030 (US$ Bn)
TABLE 133 Rest of Europe Risk Management Software Market, by Deployment Model, 2017-2022 (US$ Bn)
TABLE 134 Rest of Europe Risk Management Software Market, by Deployment Model, 2023-2030 (US$ Bn)
TABLE 135 Rest of Europe Risk Management Software Market, by Enterprise Size, 2017-2022 (US$ Bn)
TABLE 136 Rest of Europe Risk Management Software Market, by Enterprise Size, 2023-2030 (US$ Bn)
TABLE 137 Rest of Europe Risk Management Software Market, by Industry Vertical, 2017-2022 (US$ Bn)
TABLE 138 Rest of Europe Risk Management Software Market, by Industry Vertical, 2023-2030 (US$ Bn)
TABLE 139 Asia Pacific Risk Management Software Market, by Component, 2017-2022 (US$ Bn)
TABLE 140 Asia Pacific Risk Management Software Market, by Component, 2023-2030 (US$ Bn)
TABLE 141 Asia Pacific Risk Management Software Market, by Deployment Model, 2017-2022 (US$ Bn)
TABLE 142 Asia Pacific Risk Management Software Market, by Deployment Model, 2023-2030 (US$ Bn)
TABLE 143 Asia Pacific Risk Management Software Market, by Enterprise Size, 2017-2022 (US$ Bn)
TABLE 144 Asia Pacific Risk Management Software Market, by Enterprise Size, 2023-2030 (US$ Bn)
TABLE 145 Asia Pacific Risk Management Software Market, by Industry Vertical, 2017-2022 (US$ Bn)
TABLE 146 Asia Pacific Risk Management Software Market, by Industry Vertical, 2023-2030 (US$ Bn)
TABLE 147 China Risk Management Software Market, by Component, 2017-2022 (US$ Bn)
TABLE 148 China Risk Management Software Market, by Component, 2023-2030 (US$ Bn)
TABLE 149 China Risk Management Software Market, by Deployment Model, 2017-2022 (US$ Bn)
TABLE 150 China Risk Management Software Market, by Deployment Model, 2023-2030 (US$ Bn)
TABLE 151 China Risk Management Software Market, by Enterprise Size, 2017-2022 (US$ Bn)
TABLE 152 China Risk Management Software Market, by Enterprise Size, 2023-2030 (US$ Bn)
TABLE 153 China Risk Management Software Market, by Industry Vertical, 2017-2022 (US$ Bn)
TABLE 154 China Risk Management Software Market, by Industry Vertical, 2023-2030 (US$ Bn)
TABLE 155 Japan Risk Management Software Market, by Component, 2017-2022 (US$ Bn)
TABLE 156 Japan Risk Management Software Market, by Component, 2023-2030 (US$ Bn)
TABLE 157 Japan Risk Management Software Market, by Deployment Model, 2017-2022 (US$ Bn)
TABLE 158 Japan Risk Management Software Market, by Deployment Model, 2023-2030 (US$ Bn)
TABLE 159 Japan Risk Management Software Market, by Enterprise Size, 2017-2022 (US$ Bn)
TABLE 160 Japan Risk Management Software Market, by Enterprise Size, 2023-2030 (US$ Bn)
TABLE 161 Japan Risk Management Software Market, by Industry Vertical, 2017-2022 (US$ Bn)
TABLE 162 Japan Risk Management Software Market, by Industry Vertical, 2023-2030 (US$ Bn)
TABLE 163 India Risk Management Software Market, by Component, 2017-2022 (US$ Bn)
TABLE 164 India Risk Management Software Market, by Component, 2023-2030 (US$ Bn)
TABLE 165 India Risk Management Software Market, by Deployment Model, 2017-2022 (US$ Bn)
TABLE 166 India Risk Management Software Market, by Deployment Model, 2023-2030 (US$ Bn)
TABLE 167 India Risk Management Software Market, by Enterprise Size, 2017-2022 (US$ Bn)
TABLE 168 India Risk Management Software Market, by Enterprise Size, 2023-2030 (US$ Bn)
TABLE 169 India Risk Management Software Market, by Industry Vertical, 2017-2022 (US$ Bn)
TABLE 170 India Risk Management Software Market, by Industry Vertical, 2023-2030 (US$ Bn)
TABLE 171 South Korea Risk Management Software Market, by Component, 2017-2022 (US$ Bn)
TABLE 172 South Korea Risk Management Software Market, by Component, 2023-2030 (US$ Bn)
TABLE 173 South Korea Risk Management Software Market, by Deployment Model, 2017-2022 (US$ Bn)
TABLE 174 South Korea Risk Management Software Market, by Deployment Model, 2023-2030 (US$ Bn)
TABLE 175 South Korea Risk Management Software Market, by Enterprise Size, 2017-2022 (US$ Bn)
TABLE 176 South Korea Risk Management Software Market, by Enterprise Size, 2023-2030 (US$ Bn)
TABLE 177 South Korea Risk Management Software Market, by Industry Vertical, 2017-2022 (US$ Bn)
TABLE 178 South Korea Risk Management Software Market, by Industry Vertical, 2023-2030 (US$ Bn)
TABLE 179 South-East Asia Risk Management Software Market, by Component, 2017-2022 (US$ Bn)
TABLE 180 South-East Asia Risk Management Software Market, by Component, 2023-2030 (US$ Bn)
TABLE 181 South-East Asia Risk Management Software Market, by Deployment Model, 2017-2022 (US$ Bn)
TABLE 182 South-East Asia Risk Management Software Market, by Deployment Model, 2023-2030 (US$ Bn)
TABLE 183 South-East Asia Risk Management Software Market, by Enterprise Size, 2017-2022 (US$ Bn)
TABLE 184 South-East Asia Risk Management Software Market, by Enterprise Size, 2023-2030 (US$ Bn)
TABLE 185 South East Asia Risk Management Software Market, by Industry Vertical, 2017-2022 (US$ Bn)
TABLE 186 South East Asia Risk Management Software Market, by Industry Vertical, 2023-2030 (US$ Bn)
TABLE 187 Rest of Asia Pacific Risk Management Software Market, by Component, 2017-2022 (US$ Bn)
TABLE 188 Rest of Asia Pacific Risk Management Software Market, by Component, 2023-2030 (US$ Bn)
TABLE 189 Rest of Asia Pacific Risk Management Software Market, by Deployment Model, 2017-2022 (US$ Bn)
TABLE 190 Rest of Asia Pacific Risk Management Software Market, by Deployment Model, 2023-2030 (US$ Bn)
TABLE 191 Rest of Asia Pacific Risk Management Software Market, by Enterprise Size, 2017-2022 (US$ Bn)
TABLE 192 Rest of Asia Pacific Risk Management Software Market, by Enterprise Size, 2023-2030 (US$ Bn)
TABLE 193 Rest of Asia Pacific Risk Management Software Market, by Industry Vertical, 2017-2022 (US$ Bn)
TABLE 194 Rest of Asia Pacific Risk Management Software Market, by Industry Vertical, 2023-2030 (US$ Bn)
TABLE 195 Latin America Risk Management Software Market, by Component, 2017-2022 (US$ Bn)
TABLE 196 Latin America Risk Management Software Market, by Component, 2023-2030 (US$ Bn)
TABLE 197 Latin America Risk Management Software Market, by Deployment Model, 2017-2022 (US$ Bn)
TABLE 198 Latin America Risk Management Software Market, by Deployment Model, 2023-2030 (US$ Bn)
TABLE 199 Latin America Risk Management Software Market, by Enterprise Size, 2017-2022 (US$ Bn)
TABLE 200 Latin America Risk Management Software Market, by Enterprise Size, 2023-2030 (US$ Bn)
TABLE 201 Latin America Risk Management Software Market, by Industry Vertical, 2017-2022 (US$ Bn)
TABLE 202 Latin America Risk Management Software Market, by Industry Vertical, 2023-2030 (US$ Bn)
TABLE 203 Brazil Risk Management Software Market, by Component, 2017-2022 (US$ Bn)
TABLE 204 Brazil Risk Management Software Market, by Component, 2023-2030 (US$ Bn)
TABLE 205 Brazil Risk Management Software Market, by Deployment Model, 2017-2022 (US$ Bn)
TABLE 206 Brazil Risk Management Software Market, by Deployment Model, 2023-2030 (US$ Bn)
TABLE 207 Brazil Risk Management Software Market, by Enterprise Size, 2017-2022 (US$ Bn)
TABLE 208 Brazil Risk Management Software Market, by Enterprise Size, 2023-2030 (US$ Bn)
TABLE 209 Brazil Risk Management Software Market, by Industry Vertical, 2017-2022 (US$ Bn)
TABLE 210 Brazil Risk Management Software Market, by Industry Vertical, 2023-2030 (US$ Bn)
TABLE 211 Argentina Risk Management Software Market, by Component, 2017-2022 (US$ Bn)
TABLE 212 Argentina Risk Management Software Market, by Component, 2023-2030 (US$ Bn)
TABLE 213 Argentina Risk Management Software Market, by Deployment Model, 2017-2022 (US$ Bn)
TABLE 214 Argentina Risk Management Software Market, by Deployment Model, 2023-2030 (US$ Bn)
TABLE 215 Argentina Risk Management Software Market, by Enterprise Size, 2017-2022 (US$ Bn)
TABLE 216 Argentina Risk Management Software Market, by Enterprise Size, 2023-2030 (US$ Bn)
TABLE 217 Argentina Risk Management Software Market, by Industry Vertical, 2017-2022 (US$ Bn)
TABLE 218 Argentina Risk Management Software Market, by Industry Vertical, 2023-2030 (US$ Bn)
TABLE 219 Rest of Latin America Risk Management Software Market, by Component, 2017-2022 (US$ Bn)
TABLE 220 Rest of Latin America Risk Management Software Market, by Component, 2023-2030 (US$ Bn)
TABLE 221 Rest of Latin America Risk Management Software Market, by Deployment Model, 2017-2022 (US$ Bn)
TABLE 222 Rest of Latin America Risk Management Software Market, by Deployment Model, 2023-2030 (US$ Bn)
TABLE 223 Rest of Latin America Risk Management Software Market, by Enterprise Size, 2017-2022 (US$ Bn)
TABLE 224 Rest of Latin America Risk Management Software Market, by Enterprise Size, 2023-2030 (US$ Bn)
TABLE 225 Rest of Latin America Risk Management Software Market, by Industry Vertical, 2017-2022 (US$ Bn)
TABLE 226 Rest of Latin America Risk Management Software Market, by Industry Vertical, 2023-2030 (US$ Bn)
TABLE 227 Middle East and Africa Risk Management Software Market, by Component, 2017-2022 (US$ Bn)
TABLE 228 Middle East and Africa Risk Management Software Market, by Component, 2023-2030 (US$ Bn)
TABLE 229 Middle East and Africa Risk Management Software Market, by Deployment Model, 2017-2022 (US$ Bn)
TABLE 230 Middle East and Africa Risk Management Software Market, by Deployment Model, 2023-2030 (US$ Bn)
TABLE 231 Middle East and Africa Risk Management Software Market, by Enterprise Size, 2017-2022 (US$ Bn)
TABLE 232 Middle East and Africa Risk Management Software Market, by Enterprise Size, 2023-2030 (US$ Bn)
TABLE 233 Middle East and Africa Risk Management Software Market, by Industry Vertical, 2017-2022 (US$ Bn)
TABLE 234 Middle East and Africa Risk Management Software Market, by Industry Vertical, 2023-2030 (US$ Bn)
TABLE 235 GCC Countries Risk Management Software Market, by Component, 2017-2022 (US$ Bn)
TABLE 236 GCC Countries Risk Management Software Market, by Component, 2023-2030 (US$ Bn)
TABLE 237 GCC Countries Risk Management Software Market, by Deployment Model, 2017-2022 (US$ Bn)
TABLE 238 GCC Countries Risk Management Software Market, by Deployment Model, 2023-2030 (US$ Bn)
TABLE 239 GCC Countries Risk Management Software Market, by Enterprise Size, 2017-2022 (US$ Bn)
TABLE 240 GCC Countries Risk Management Software Market, by Enterprise Size, 2023-2030 (US$ Bn)
TABLE 241 GCC Countries Risk Management Software Market, by Industry Vertical, 2017-2022 (US$ Bn)
TABLE 242 GCC Countries Risk Management Software Market, by Industry Vertical, 2023-2030 (US$ Bn)
TABLE 243 South Africa Risk Management Software Market, by Component, 2017-2022 (US$ Bn)
TABLE 244 South Africa Risk Management Software Market, by Component, 2023-2030 (US$ Bn)
TABLE 245 South Africa Risk Management Software Market, by Deployment Model, 2017-2022 (US$ Bn)
TABLE 246 South Africa Risk Management Software Market, by Deployment Model, 2023-2030 (US$ Bn)
TABLE 247 South Africa Risk Management Software Market, by Enterprise Size, 2017-2022 (US$ Bn)
TABLE 248 South Africa Risk Management Software Market, by Enterprise Size, 2023-2030 (US$ Bn)
TABLE 249 South Africa Risk Management Software Market, by Industry Vertical, 2017-2022 (US$ Bn)
TABLE 250 South Africa Risk Management Software Market, by Industry Vertical, 2023-2030 (US$ Bn)
TABLE 251 Rest of Middle East and Africa Risk Management Software Market, by Component, 2017-2022 (US$ Bn)
TABLE 252 Rest of Middle East and Africa Risk Management Software Market, by Component, 2023-2030 (US$ Bn)
TABLE 253 Rest of Middle East and Africa Risk Management Software Market, by Deployment Model, 2017-2022 (US$ Bn)
TABLE 254 Rest of Middle East and Africa Risk Management Software Market, by Deployment Model, 2023-2030 (US$ Bn)
TABLE 255 Rest of Middle East and Africa Risk Management Software Market, by Enterprise Size, 2017-2022 (US$ Bn)
TABLE 256 Rest of Middle East and Africa Risk Management Software Market, by Enterprise Size, 2023-2030 (US$ Bn)
TABLE 257 Rest of Middle East and Africa Risk Management Software Market, by Industry Vertical, 2017-2022 (US$ Bn)
TABLE 258 Rest of Middle East and Africa Risk Management Software Market, by Industry Vertical, 2023-2030 (US$ Bn)

Frequently Asked Questions

What is the current size of the global thermal printing market?

The global thermal printing market was valued at USD 44.2 Billion in 2022.

What is the anticipated growth rate of the thermal printing market between 2023 and 2030?

The thermal printing market is anticipated to grow at a CAGR of 4.5% between 2023 and 2030, reaching USD 60.15 Billion in 2030.

Which segment is leading the market share in terms of offering?

Printer is the leading segment by offering, holding over 62% share in terms of value in 2022.

Which technology segment governs the global demand for thermal printing?

The thermal transfer (TT) segment governs the demand for thermal printing worldwide, holding a massive share of over 42% in 2022.

Which application segment is estimated to post the highest CAGR during the forecast period?

The retail segment will post the highest CAGR during the forecast period.

Which region is fueling the growth of the thermal printing industry?

North America is fueling the rapid growth of the thermal printing industry, with an over one-third share in 2022.

Who are the major global thermal printing market players?

The top players include Zebra Technologies Corporation, Honeywell International Inc, Star Micronics Co. Ltd, and Brother International Corporation. Other major players include Toshiba TEC Corporation, Bixolon Co. Ltd, Seiko Epson Corporation, and HP India Sales Private Limited.

What are the major market drivers of the thermal printing industry?

The growing adoption of e-commerce and logistics services, increasing demand for product labeling and tracking in various sectors, advancements in printing technology leading to improved print quality and speed, and the growing need for cost-effective and reliable printing solutions are the major market drivers of the thermal printing industry.

What are the major market restraints of the thermal printing industry?

The increasing popularity of digital documentation and paperless operations, the availability of alternative printing technologies such as inkjet and laser printing, limitations in printing complex graphics and colors using thermal printing, and the ongoing transition to digitalization in various industries are the major market restraints of the thermal printing industry.

What are the major market opportunities of the thermal printing industry?

The major market opportunities of the thermal printing industry include the growing demand for on-demand printing solutions, the increasing adoption of RFID technology in various sectors, and expanding applications in healthcare, logistics, and retail industries.

Water Shoes Market

Published:
Report ID: 36602

Neck Pillows Market

Published:
Report ID: 36593

Thermoformed Plastic Products Market

Published:
Report ID: 11226

Pest Control Products and Services Market

Published:
Report ID: 9276

Luggage and Leather Goods Market

Published:
Report ID: 12212

Toilet Care Market

Published:
Report ID: 11360

Food Blenders and Mixers Market

Published:
Report ID: 5485

Builders’ Joinery And Carpentry Of Wood Market

Published:
Report ID: 3713

Botanical Supplements Market

Published:
Report ID: 3017

Baby Personal Care Market

Published:
Report ID: 1898

Bottled Water Market

Published:
Report ID: 4189

Massage Chair Market

Published:
Report ID: 36375

Purchase Options

$2999
Delivery Format: Excel.
$4999
Designed for the individual purchaser.
$6999
Users located at a single corporate site or regional office.
$7999
Allowed for unlimited sharing globally within one company.
Smallform of Sample request

Have a question?

User Profile

Don’t settle for less – trust Mitul to help you find the best solution.

Report delivery within 24 to 48 hours

– Other Info –

What people say?-

User Review

I am very impressed with the information in this report. The author clearly did their research when they came up with this product and it has already given me a lot of ideas.

Jana Schmidt
CEDAR CX Technologies

– Connect with us –

Phone

+91 6232 49 3207


support

24/7 Research Support


sales@credenceresearch.com

– Research Methodology –

Going beyond the basics: advanced techniques in research methodology

– Trusted By –

Pepshi, LG, Nestle
Motorola, Honeywell, Johnson and johnson
LG Chem, SIEMENS, Pfizer
Unilever, Samsonite, QIAGEN