
Market Overview:
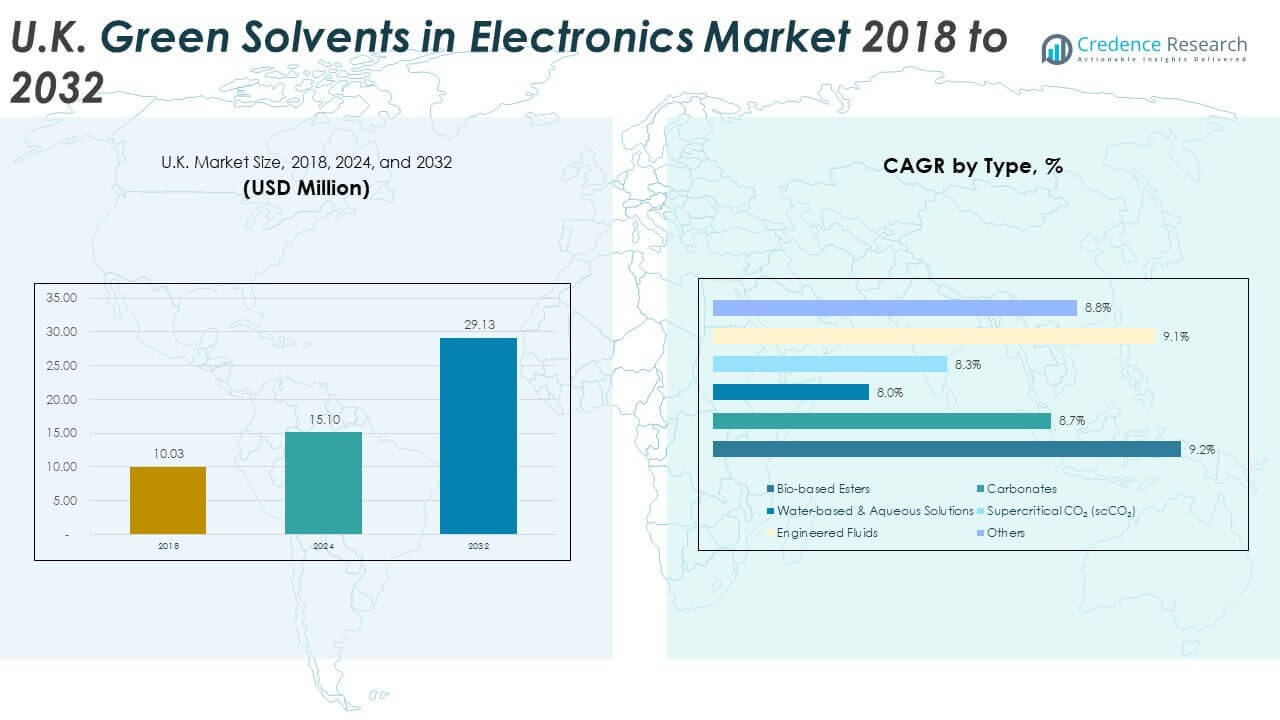
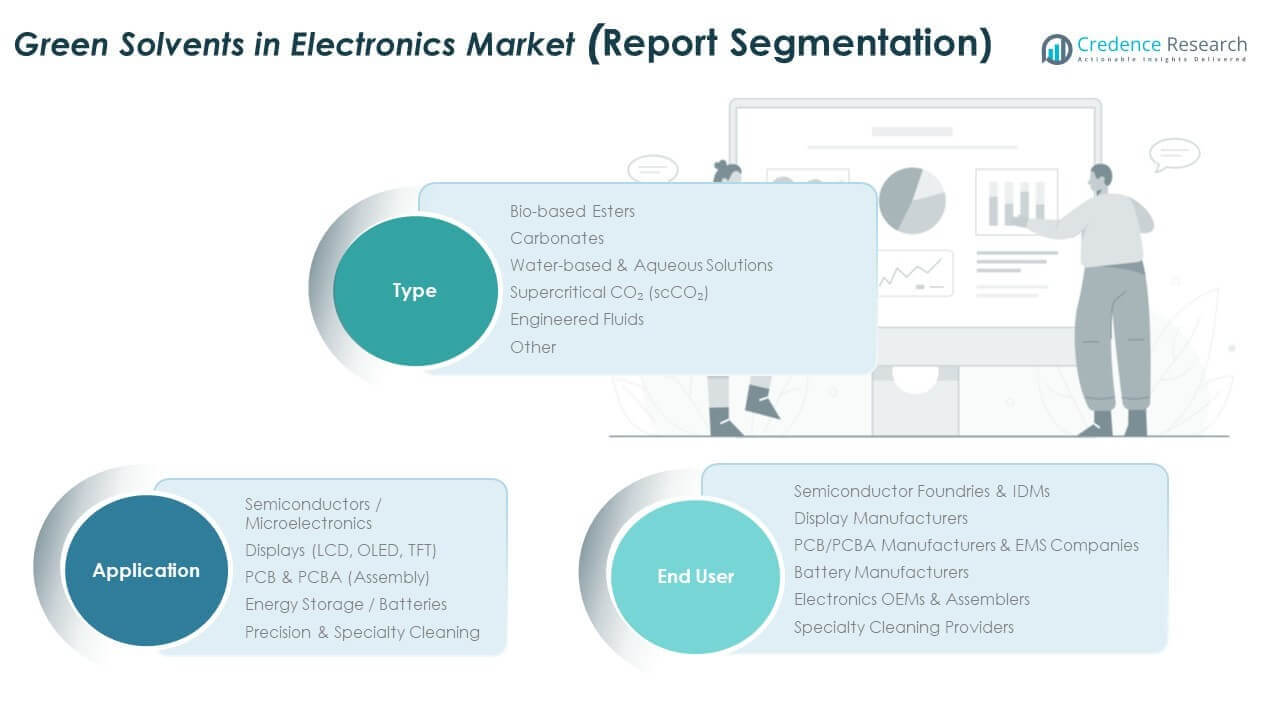
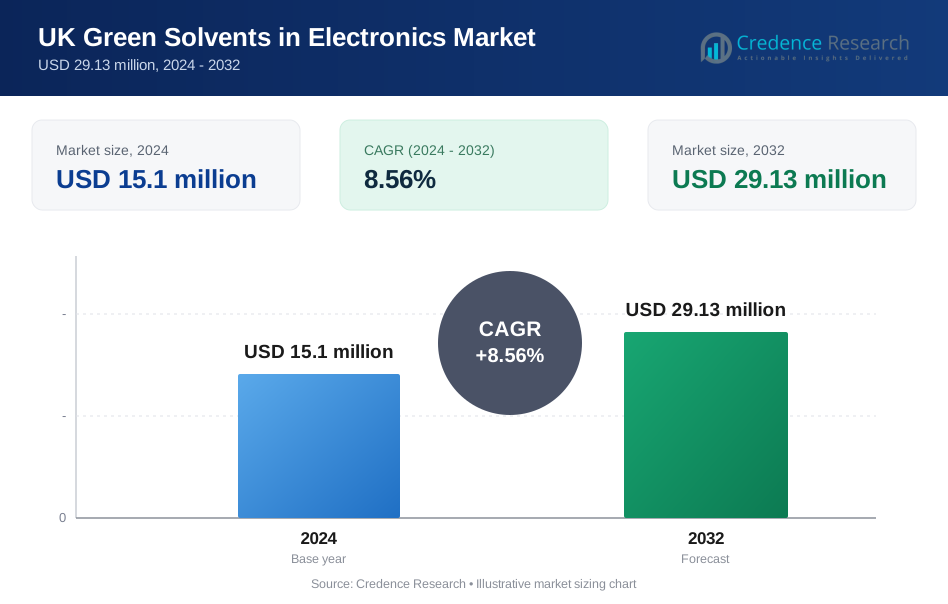
The UK Green Solvents in Electronics Market size was valued at USD 10.03 million in 2018 to USD 15.1 million in 2024 and is anticipated to reach USD 29.13 million by 2032, at a CAGR of 8.56% during the forecast period.
| REPORT ATTRIBUTE | DETAILS |
|---|---|
| Historical Period | 2020-2023 |
| Base Year | 2024 |
| Forecast Period | 2025-2032 |
| UK Green Solvents in Electronics Market Size 2024 | USD 15.1 Million |
| UK Green Solvents in Electronics Market, CAGR | 8.56% |
| UK Green Solvents in Electronics Market Size 2032 | USD 29.13 Million |
The market is driven by strong regulatory support, rising environmental awareness, and growing substitution of hazardous solvents in electronics manufacturing. Companies adopt bio-based and water-based solvents to comply with strict EU and UK environmental policies while also improving workplace safety. Expanding semiconductor, display, and PCB manufacturing activities in the UK reinforce the need for high-performance yet environmentally safe solvents. Strategic investments in R&D and partnerships with electronics OEMs further accelerate adoption across varied applications.
Regionally, Europe leads in adoption with the UK playing a critical role due to its advanced electronics design and assembly ecosystem. Countries in Asia Pacific are emerging as strong growth markets due to high production capacity, while North America shows steady adoption with a focus on innovation. Latin America and the Middle East gradually expand adoption due to regulatory harmonization and growing electronics demand. Africa remains at an early stage but holds potential as industrialization advances.
Market Insights:
- The UK Green Solvents in Electronics Market was valued at USD 10.03 million in 2018, grew to USD 15.1 million in 2024, and is projected to reach USD 29.13 million by 2032, expanding at a CAGR of 8.56%.
- England led the market with 48% share in 2024, supported by strong electronics design, PCB manufacturing, and semiconductor R&D activities, while Scotland followed with 22% share driven by renewable energy and material innovation.
- Wales and Northern Ireland together accounted for 30% share in 2024, with growth supported by PCB assembly and specialty manufacturing capabilities.
- Scotland emerged as the fastest-growing region, capturing 22% share, driven by government incentives, battery research, and rising demand from specialty cleaning providers.
- By type, bio-based esters accounted for 28% share in 2024, followed by water-based and aqueous solutions with 25%, reflecting increasing adoption in semiconductor and PCB assembly applications.
Market Drivers:
Rising Regulatory Pressure Encouraging Green Alternatives in Electronics Manufacturing:
Stringent environmental laws in the UK and EU create strong demand for sustainable solvents. Electronic manufacturers are adopting bio-based esters and water-based solutions to replace VOC-heavy chemicals. These regulations aim to reduce emissions and enhance workplace safety. Companies benefit from meeting compliance standards while improving global brand image. Research institutions also partner with industry players to support eco-innovation. The UK Green Solvents in Electronics Market benefits from strict compliance requirements that push for adoption. It drives consistent market demand by aligning sustainability with industrial needs. Manufacturers view regulatory compliance not as a burden but as a strategic advantage.
- For instance, Vertec BioSolvents, a US-based company, produces bio-based solvents derived from renewable feedstocks like corn, soybeans, and citrus. These solvents are used in various cleaning processes, including electronics, as a safer alternative to petrochemical solvents. The company's products contain no hazardous air pollutants (HAPs) or ozone-depleting chemicals (ODCs), and they hold multiple patents for their sustainable technology.
Increasing Electronics Production and Expansion of Semiconductor Manufacturing:
The UK electronics sector witness’s significant growth in semiconductors, displays, and PCBs. These industries require advanced cleaning and processing solvents that meet safety and performance standards. Green solvents deliver effective results without harming the environment. With demand for miniaturization and advanced chip designs, sustainable chemicals become essential. Companies adopt engineered fluids and carbonates for microelectronics. The UK Green Solvents in Electronics Market aligns with this growing need for advanced solutions. OEMs collaborate with solvent producers to customize eco-friendly options. Expanding semiconductor foundries and display units in the UK support this driver.
- For instance, suppliers of microelectronics like Arm and Imagination Technologies support solvent producers who customize eco-friendly solvent blends aligned with semiconductor foundry expansion. The UK Green Solvents in Electronics Market aligns with this growing need for advanced solutions.
Strong Corporate Sustainability Goals Influencing Supply Chain Adoption:
Corporations in the UK prioritize ESG compliance and set net-zero targets. This shift encourages suppliers and manufacturers to integrate green solvents into their processes. Electronics OEMs adopt green solvents to enhance sustainability credentials. Investors support companies with eco-friendly supply chains, creating financial incentives. Brands differentiate themselves through environmental stewardship, influencing buyer preference. The UK Green Solvents in Electronics Market gains momentum as large OEMs enforce sustainable sourcing. Green solvent use improves transparency and reduces long-term compliance risks. Companies that fail to adapt risk losing contracts with global leaders.
Advancements in Bio-Based and Engineered Solvent Technologies:
Continuous innovation in solvent formulations enhances performance while maintaining eco-credentials. New-generation bio-based esters offer improved cleaning power and thermal stability. Engineered fluids support high-tech applications such as battery production and microelectronics. Companies invest in R&D to ensure compatibility with modern materials. Collaborations between universities and corporations accelerate these advancements. The UK Green Solvents in Electronics Market grows as these technologies gain commercial acceptance. Innovative offerings expand application reach across precision cleaning and energy storage. Such progress creates competitive advantages for early adopters and innovators.
 Market Trends:
Rising Demand for Precision Cleaning in Advanced Electronics Applications:
Electronics manufacturers in the UK require solvents that can handle delicate components. Miniaturization of devices increases the need for high-precision cleaning. Green solvents provide effective solutions without damaging substrates. Their adoption in PCB assembly and semiconductor lines is expanding. Firms prioritize performance and sustainability simultaneously. The UK Green Solvents in Electronics Market reflects this growing reliance on advanced cleaning solutions. Demand from medical electronics and aerospace adds to the trend. High-value industries further strengthen the push for eco-friendly cleaning agents.
- For instance, CRC Industries offers solvent-based cleaning products designed specifically for delicate PCBs and semiconductor components with quick evaporation rates and low toxicity, ensuring reliability and environmental safety. The UK Green Solvents in Electronics Market reflects this growing reliance on advanced cleaning solutions. Demand from medical electronics and aerospace adds to the trend. High-value industries further strengthen the push for eco-friendly cleaning agents.
Integration of Green Solvents in Battery and Energy Storage Manufacturing:
The rise of EVs and energy storage systems drives demand for eco-friendly solvents. Manufacturers need safe alternatives that support lithium-ion battery production. Green solvents offer thermal stability and reduced toxicity. This trend expands beyond the UK to global supply chains. The UK Green Solvents in Electronics Market adapts to these requirements with tailored formulations. Battery producers focus on reducing waste and improving efficiency. Solvent adoption also supports recycling and second-life applications. This trend aligns with the UK’s sustainability and electrification goals.
- For instance, UK company Impact Solutions developed 'CellMine,' a green solvent-based technology that selectively recovers lithium-ion cathode metals with a battery-grade purity of over 99.5% at temperatures below 120°C, enhancing recycling efficiency. Solvent adoption also supports recycling and second-life applications. This trend aligns with the UK’s sustainability and electrification goals.
Expansion of Water-Based and Aqueous Solutions in Electronics Assembly:
Water-based solvents gain popularity due to safety and performance improvements. These formulations reduce VOC emissions while maintaining cleaning efficiency. Electronics assemblers prefer them for PCB and display manufacturing. They also enhance workplace safety by reducing hazardous exposure. The UK Green Solvents in Electronics Market incorporates these trends into production processes. OEMs rely on aqueous solutions to meet internal sustainability benchmarks. Strong R&D activity ensures compatibility with new substrates. Adoption increases across large and small-scale manufacturers.
Growing Focus on Local Production and Supply Chain Resilience:
Global disruptions drive UK manufacturers to strengthen local supply chains. Domestic production of solvents reduces dependency on imports. Green solvent producers scale up capacity within the UK and EU. This supports resilience against geopolitical risks and logistic disruptions. The UK Green Solvents in Electronics Market gains stability from local sourcing strategies. Manufacturers promote local partnerships to ensure consistent availability. Regional focus also enhances sustainability by reducing transport emissions. Long-term contracts between OEMs and local suppliers expand under this trend.
Market Challenges Analysis:
Higher Cost Structures Limiting Large-Scale Adoption in Price-Sensitive Segments:
Green solvents often cost more compared to conventional alternatives. This pricing gap slows adoption in highly competitive electronics manufacturing segments. Small and medium enterprises struggle to balance costs and compliance. The UK Green Solvents in Electronics Market faces challenges from cost-sensitive manufacturers. Price competitiveness remains a barrier until economies of scale improve. Companies invest in innovation to lower production expenses. Government subsidies and tax incentives may offset costs for some firms. Broader acceptance depends on narrowing the affordability gap.
Limited Awareness and Technical Compatibility Across Certain Applications:
Not all manufacturers are fully aware of green solvent capabilities. Incompatibility with specific electronic substrates limits usage. Some precision processes require solvents with specific properties that are not yet available. The UK Green Solvents in Electronics Market must address these technical challenges. Lack of awareness also affects adoption among small players. Training programs and industry collaboration can improve acceptance. Manufacturers need confidence in green solvent performance before full integration. Building trust through testing and certification becomes critical.
Market Opportunities:
Expanding Use in Emerging Electronic Applications Such as Flexible Displays and Wearables:
Flexible electronics and wearable devices create fresh opportunities for solvent use. These applications require safe cleaning agents compatible with sensitive materials. The UK Green Solvents in Electronics Market supports this growth with innovative products. Manufacturers position eco-friendly solvents as essential for next-gen consumer devices. Rapid adoption of flexible OLED and wearable sensors strengthens market prospects. R&D partnerships target tailored solvent solutions for such applications. Companies focusing on niche electronics segments gain early-mover advantages. Growing demand for consumer tech fuels this opportunity further.
Rising Collaboration Between Solvent Producers and Electronics OEMs:
Close partnerships between solvent suppliers and electronics manufacturers expand opportunities. Joint ventures enhance formulation compatibility with advanced processes. The UK Green Solvents in Electronics Market benefits from these collaborations. Customized solutions strengthen long-term client relationships and drive innovation. Strategic alliances also reduce risks linked to technology adoption. Such partnerships create new revenue streams and shared expertise. OEMs trust suppliers who provide both compliance and performance. Strong collaboration will shape the industry’s future opportunities.
Market Segmentation Analysis:
By Type
The UK Green Solvents in Electronics Market is segmented into bio-based esters, carbonates, water-based and aqueous solutions, supercritical CO₂, engineered fluids, and others. Bio-based esters and aqueous solutions are gaining strong traction due to low toxicity and environmental compliance. Supercritical CO₂ attracts attention for advanced cleaning processes in high-precision applications. Engineered fluids support demanding sectors such as battery production and microelectronics. Carbonates provide versatility in solvent functions while ensuring compatibility with multiple substrates. Demand is expanding across categories where safety and performance remain key selection criteria.
- For example, Equilibar precision back pressure regulators enable supercritical CO₂ solvent research in UK universities, allowing stable control at pressures up to 6000 psig, critical for fractionation and green solvent applications requiring fine-tuned pressure and temperature conditions. Engineered fluids support demanding sectors such as battery production and microelectronics. Carbonates provide versatility in solvent functions while ensuring compatibility with multiple substrates.
By Application
Applications include semiconductors, displays, PCB and PCBA assembly, energy storage systems, and precision cleaning. Semiconductor and microelectronics manufacturers lead adoption due to stringent purity requirements. Display makers use green solvents for LCD, OLED, and TFT manufacturing. PCB and PCBA processes rely on water-based solutions for reliable cleaning. Energy storage, including battery production, uses engineered solvents for stability. Specialty cleaning gains importance in aerospace and medical electronics. Each segment benefits from sustainable formulations suited to critical performance needs.
- For instance, in display manufacturing, companies utilizing OLED technology incorporate water-based solvent processes to maintain substrate integrity without VOC emissions, aligning with sustainability goals.
By End User
End users include semiconductor foundries, display manufacturers, PCB and PCBA producers, battery manufacturers, OEMs, and specialty cleaning providers. Semiconductor foundries and IDMs represent a dominant group due to intensive chemical use in fabrication. Display manufacturers follow with consistent adoption for environmentally responsible processes. PCB/PCBA producers and EMS companies integrate solvents for assembly precision. Battery manufacturers increasingly depend on engineered fluids for safe operations. Electronics OEMs prioritize sustainable sourcing for global supply chains. Specialty cleaning providers expand use across high-value electronic assemblies.
Segmentation:
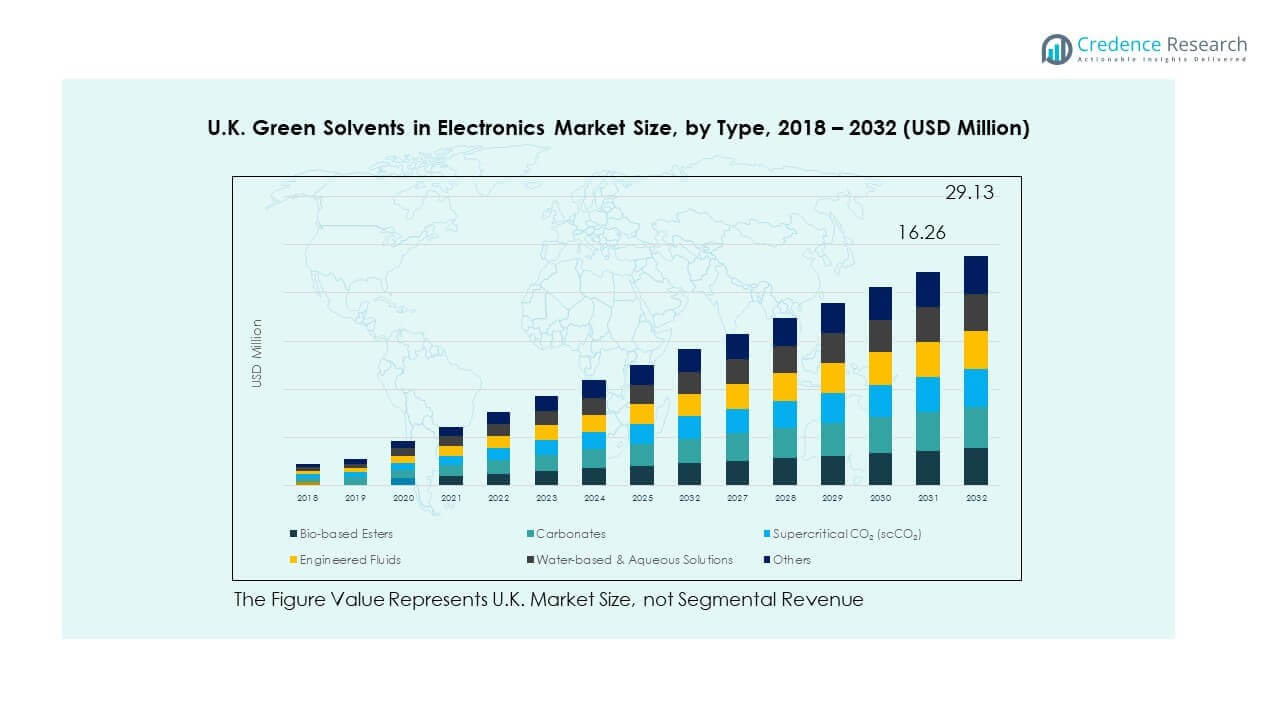
By Type
- Bio-based Esters
- Carbonates
- Water-based & Aqueous Solutions
- Supercritical CO₂ (scCO₂)
- Engineered Fluids
- Others
By Application
- Semiconductors / Microelectronics
- Displays (LCD, OLED, TFT)
- PCB & PCBA (Assembly)
- Energy Storage / Batteries
- Precision & Specialty Cleaning
By End User
- Semiconductor Foundries & IDMs
- Display Manufacturers
- PCB/PCBA Manufacturers & EMS Companies
- Battery Manufacturers
- Electronics OEMs & Assemblers
- Specialty Cleaning Providers
Regional Analysis:
England
England holds the largest share of the UK Green Solvents in Electronics Market, accounting for nearly 48% in 2024. Strong presence of electronics design houses, PCB manufacturers, and semiconductor R&D centers supports demand. London and the South East lead adoption due to their concentration of technology firms and research universities. Regulations around clean manufacturing and workplace safety reinforce the shift toward bio-based and aqueous solvents. Electronics OEMs in England also integrate green solvents to strengthen sustainability credentials. It benefits from established supply chains that allow consistent availability of eco-friendly formulations.
Scotland
Scotland represented about 22% of the market in 2024, with growth tied to renewable energy and electronics applications. Universities in Edinburgh and Glasgow collaborate with industry on advanced materials research. The semiconductor sector, though smaller, supports use of engineered fluids and precision cleaning solvents. Green technology incentives by the Scottish Government accelerate adoption in electronics manufacturing. It also sees increasing demand from specialty cleaning providers supporting aerospace and defense applications. Scotland’s growing role in battery research strengthens its position as an emerging hub for sustainable solvents.
Wales and Northern Ireland
Wales and Northern Ireland together accounted for nearly 30% of the UK Green Solvents in Electronics Market in 2024. Wales benefits from PCB assembly units and electronics component suppliers, especially around Cardiff and Newport. Northern Ireland contributes through specialty manufacturing and niche electronics production. Both regions adopt water-based and bio-based solvents to meet sustainability requirements. Local SMEs align with larger OEMs to access eco-friendly chemicals for assembly and testing. Government-backed initiatives to promote clean manufacturing further support growth. It positions these regions as important contributors despite smaller absolute market size.
Key Player Analysis:
- Corbion N.V.
- Vertec BioSolvents Inc.
- Godavari Biorefineries Ltd.
- Galactic
- UBE Corporation
- Lotte Chemical
- Sabic
- Huntsman Corporation
- Merck KGaA
- BASF SE
- Dow Inc.
- Other Key Players
Competitive Analysis:
The UK Green Solvents in Electronics Market is characterized by strong competition among global chemical giants and specialized green chemistry firms. Companies such as BASF SE, Dow Inc., Corbion N.V., Vertec BioSolvents, and Merck KGaA focus on expanding eco-friendly portfolios tailored for electronics applications. It emphasizes partnerships with OEMs, semiconductor producers, and display manufacturers to secure long-term contracts. Players invest heavily in R&D to deliver advanced bio-based esters, engineered fluids, and aqueous solutions that meet stringent performance requirements. Local collaborations and regulatory alignment strengthen competitive positioning. The market remains moderately fragmented, with large players leveraging scale while smaller firms offer niche innovations. Continuous innovation, regulatory compliance, and sustainability branding remain core strategies driving competitiveness.
Recent Developments:
- In August 2025, Corbion N.V. partnered with Kuehnle AgroSystems to develop natural astaxanthin from algae fermentation, aiming to provide bio-based antioxidant ingredients that can also support sustainable applications including in electronics.
- In early 2025, ERM and Ayming secured Innovate UK funding to drive the adoption of green solvents in sustainable medicine manufacturing, an initiative relevant to advancing bio-solvent applications and supply chain consortium development.
- In December 2024, Godavari Biorefineries Ltd. signed an international license agreement with Catalyxx Inc. to utilize advanced technology for converting ethanol into biobutanol and higher alcohols, marking a strategic move toward bio-based chemicals that can be leveraged in green solvents for varied applications including electronics.
- UBE Corporation in July 2025 launched two new environmentally certified products under its U-BE-INFINITY brand, including bio-circular caprolactam and recycled composite nylon, contributing to the circular economy with bio-based and recycled solvents.
Report Coverage:
The research report offers an in-depth analysis based on type, application, and end user. It details leading market players, providing an overview of their business, product offerings, investments, revenue streams, and key applications. Additionally, the report includes insights into the competitive environment, SWOT analysis, current market trends, as well as the primary drivers and constraints. Furthermore, it discusses various factors that have driven market expansion in recent years. The report also explores market dynamics, regulatory scenarios, and technological advancements that are shaping the industry. It assesses the impact of external factors and global economic changes on market growth. Lastly, it provides strategic recommendations for new entrants and established companies to navigate the complexities of the market.
Future Outlook:
- Growing adoption of bio-based esters and aqueous solvents in mainstream electronics manufacturing.
- Increasing integration of green solvents in semiconductor fabrication for advanced chip designs.
- Expanding use in display technologies, including OLED and flexible displays.
- Rising demand for engineered fluids in battery manufacturing and energy storage.
- Strengthening collaboration between solvent producers and UK electronics OEMs.
- Government regulations and ESG commitments accelerating sustainable chemistry adoption.
- Local production and supply chain alignment reducing reliance on imports.
- Continuous R&D improving performance compatibility across diverse applications.
- Emerging opportunities in wearable devices, sensors, and specialty cleaning.
- Market growth reinforced by investment in clean technologies and eco-friendly innovations.
Request a Free Sample
Fill in your details and we'll send you a free sample report.
- Sample data tables & charts
- Research methodology
Need a Custom Version of This Report?
Tailor the scope, geography, or segments to your exact requirements.
- Custom geography or segment scope
- Direct access to our analyst team
Frequently Asked Questions
What is the current market size for UK Green Solvents in Electronics Market, and what is its projected size in 2032?
At what Compound Annual Growth Rate is the UK Green Solvents in Electronics Market projected to grow between 2024 and 2032?
Which UK Green Solvents in Electronics Market segment held the largest share in 2024?
What are the primary factors fueling the growth of the UK Green Solvents in Electronics Market?
Who are the leading companies in the UK Green Solvents in Electronics Market?
Which region commanded the largest share of the UK Green Solvents in Electronics Market in 2024?
Table of Content
Chapter 1. Report Introduction
- 1.1 Report Description & Purpose
- 1.1.1 Report Title & Market Definition
- 1.1.2 Unique Selling Propositions (USP) & Key Differentiators
- 1.1.3 Value Proposition for Stakeholders
- 1.2 Research Objectives
- 1.2.1 Market Sizing Objectives (Volume & Revenue)
- 1.2.2 Segmentation Objectives
- 1.2.3 Competitive Intelligence Objectives
- 1.2.4 Forecast & Scenario Objectives
- 1.3 Report Scope
- 1.3.1 UK Green Solvents in Electronics Scope – Types & Subtypes Covered
- 1.3.2 Geographic Scope – Regions & Countries Covered
- 1.3.3 Historical Period, Base Year & Forecast Period (2024; forecast to 2032)
- 1.3.4 Inclusions & Exclusions
- 1.4 HS Code & Classification Framework
- 1.5 Currency, Units & Pricing Basis
- 1.6 Target Stakeholders
- 1.7 Limitations & Assumptions
Chapter 2. Executive Summary
- 2.1 Global UK Green Solvents in Electronics Market Snapshot
- 2.1.1 Market Size – Historical (2024) & Forecast (2024-2032) (2024: USD 15.1 million → 2032: USD 29.13 million)
- 2.1.2 Volume & Revenue – Global Totals
- 2.1.3 Key Market Highlights – Top Five Facts
- 2.2 UK Green Solvents in Electronics Market Segmentation Snapshot
- 2.2.1 Market Split by Region – 2024 vs. 2032
- 2.3 Competitive Snapshot
- 2.3.1 Top 10 Players by Revenue Share – 2024
- 2.3.2 Top 10 Players by Volume Share – 2024
- 2.3.3 Recent Strategic Developments (18-Month Summary)
- 2.4 Key Investment Highlights & Strategic Conclusions
Chapter 3. UK Green Solvents in Electronics Market Dynamics & Industry Analysis
- 3.1 Market Overview & Context
- 3.1.1 UK Green Solvents in Electronics Market Position in the Broader Automotive Value Chain
- 3.1.2 OEM vs. Replacement Market Dynamics
- 3.1.3 Market Maturity & Development Stage by Region
- 3.2 UK Green Solvents in Electronics Market Drivers
- 3.3 UK Green Solvents in Electronics Market Restraints & Challenges
- 3.4 UK Green Solvents in Electronics Market Opportunities
- 3.5 Porter's Five Forces Analysis
- 3.5.1 Threat of New Entrants
- 3.5.2 Bargaining Power of Suppliers
- 3.5.3 Bargaining Power of Buyers
- 3.5.4 Threat of Substitutes
- 3.5.5 Competitive Rivalry – Intensity Assessment
- 3.6 UK Green Solvents in Electronics Value Chain Analysis
- 3.6.1 Upstream – Raw Material/Input Suppliers
- 3.6.1.1 Raw Material/Input 1
- 3.6.1.2 Raw Material/Input 2
- 3.6.1.3 Raw Material/Input 3
- 3.6.2 Midstream – Production/Manufacturing/Service Delivery
- 3.6.2.1 Production/Process Overview
- 3.6.2.2 Key Facility Locations & Capacity by Manufacturer
- 3.6.3 Downstream – Distribution & End Consumer
- 3.6.3.1 Primary Channel – B2B/OEM
- 3.6.3.2 Secondary Channels – Dealer, Retail, Online, Direct
- 3.6.4 Value Chain Profitability Analysis
- 3.6.1 Upstream – Raw Material/Input Suppliers
- 3.7 PESTEL Analysis
- 3.7.1 Political Factors
- 3.7.2 Economic Factors
- 3.7.3 Social Factors
- 3.7.4 Technological Factors
- 3.7.5 Environmental Factors
- 3.7.6 Legal Factors
- 3.8 UK Green Solvents in Electronics Supply Chain Analysis
- 3.8.1 Raw Material/Input Supply Risk Assessment
- 3.8.2 Manufacturing Concentration Risk (Geographic Exposure)
- 3.8.3 Trade Disruption Impact Analysis
- 3.9 Regulatory & Policy Landscape
Note: The regulatory and policy landscape section covers regulations based on their applicability to the market, UK Green Solvents in Electronics category, geography, and scope of the study. Only regulatory frameworks with a material impact on operations, compliance, trade, sustainability, or market access are analyzed in detail.
Chapter 4. Key Investment Pockets & Opportunity Analysis
- 4.1 UK Green Solvents in Electronics Market Attractiveness Analysis
- 4.1.1 By Region – Investment Attractiveness Matrix (Volume × CAGR)
- 4.2 Absolute Revenue Growth Opportunity
- 4.2.1 By Region – Absolute USD Growth Through 2032
- 4.3 Incremental Volume Opportunity
- 4.3.1 By Region – Incremental Volume Through 2032
- 4.3.2 Segment – Incremental Volume
- 4.4 Emerging Submarket Opportunity Deep Dive (Subject to Applicability)
- 4.5 Emerging Market Opportunity Scorecards
- 4.5.1 United States
- 4.5.2 Europe
- 4.5.3 Asia
- 4.5.4 Middle East & Africa
Note: Emerging Market Opportunity Scorecards will be included based on relevance and strategic importance. Regions listed are indicative and may vary depending on data availability and market dynamics.
Chapter 5. UK Green Solvents in Electronics Import-Export Analysis & Trade Flows
- 5.1 Global Trade Overview
- 5.1.1 Global Export Value by Country (2024)
- 5.1.2 Global Export Volume by Country (2024)
- 5.1.3 Global Import Value by Country (2024)
- 5.1.4 Global Import Volume by Country (2024)
- 5.1.5 Net Trade Balance by Country (2024)
- 5.2 Export Analysis – Segment
- 5.2.1 Type 1 (HS Code)
- 5.2.2 Type 2 (HS Code)
- 5.2.3 Type 3 (HS Code)
- 5.2.4 Type 4 (HS Code)
- 5.2.5 Type 5 (HS Code)
- 5.3 Import Analysis – Segment
- 5.3.1 Type 1 (HS Code)
- 5.3.2 Type 2 (HS Code)
- 5.3.3 Type 3 (HS Code)
- 5.3.4 Type 4 (HS Code)
- 5.3.5 Type 5 (HS Code)
- 5.4 Average Unit Trade Prices
- 5.4.1 Average Export Price – Segment & Country
- 5.4.2 Average Import Price – Segment & Source Country
- 5.4.3 Price Trends (2024)
- 5.5 Key Trade Route Analysis
- 5.5.1 Trade Route 1
- 5.5.2 Trade Route 2
- 5.5.3 Trade Route 3
- 5.5.4 Trade Route 4
- 5.5.5 Trade Route 5
- 5.6 Trade Policy Impact Assessment
- 5.6.1 US Anti-Dumping & Section 301 Tariffs
- 5.6.2 EU Customs Union Impact
- 5.6.3 Major Free Trade Agreements
- 5.6.4 USMCA Rules of Origin
Note: Trade policy analysis will be included only where relevant to the UK Green Solvents in Electronics market.
Chapter 6. Competitive Landscape & Company Benchmarking
- 6.1 UK Green Solvents in Electronics Market Concentration & Structure
- 6.1.1 Herfindahl-Hirschman Index (HHI) – vs. 2024
- 6.1.2 Tier 1, Tier 2 & Tier 3 Market Structure
- 6.1.3 Global, Regional & Local Player Dynamics
- 6.2 UK Green Solvents in Electronics Market Share Analysis – 2024
- 6.2.1 Global Revenue Share by Company
- 6.2.2 Global Volume Share by Company
- 6.2.3 Regional Revenue Share
- 6.2.4 Market Share Evolution ( vs. 2024)
- 6.2.5 OEM Segment Share by Company
- 6.2.6 Replacement Segment Share by Company
- 6.3 Production/Delivery Capacity & Facility Analysis
- 6.3.1 Global Installed Capacity
- 6.3.2 Capacity Utilization Rates
- 6.3.3 Production/Output Volume
- 6.3.4 Facility Locations & Capacity Map
- 6.3.5 Planned Capacity Additions
- 6.4 UK Green Solvents in Electronics Competitive Benchmarking Matrix
- 6.4.1 Revenue, Volume, CAGR & Profitability Comparison
- 6.4.2 Channel Revenue Mix
- 6.4.3 Geographic Revenue Exposure
- 6.4.4 R&D Intensity
- 6.4.5 Sustainability Maturity
- 6.5 Strategic Developments in UK Green Solvents in Electronics (Last 24 Months)
- 6.5.1 Mergers, Acquisitions & Divestments
- 6.5.2 New UK Green Solvents in Electronics Launches
- 6.5.3 Facility Expansions
- 6.5.4 Strategic Alliances, Joint Ventures & Partnerships
- 6.5.5 Distribution Expansion & Market Entry
- 6.5.6 Sustainability & ESG Initiatives
- 6.6 Competitive Strategy Mapping
- 6.6.1 Leader, Challenger, Follower & Niche Classification
- 6.6.2 Pricing Strategy Comparison
- 6.6.3 Channel Strategy Matrix
Note: Strategic developments are included based on their materiality and the availability of reliable information.
Chapter 7. Global UK Green Solvents in Electronics Market – By Distribution Channel
- 7.1 Segment Overview
- 7.1.1 Volume & Revenue Split by Channel (2024 & 2032)
- 7.1.2 Channel Mix Evolution (2024-2032)
Chapter 8. Regional Market Analysis – Global Overview
- 8.1 Global Regional Overview
- 8.1.1 Regional Volume Share
- 8.1.2 Regional Revenue Share
- 8.1.3 Regional Volume by Region
- 8.1.4 Regional Revenue by Region
- 8.1.5 Regional Forecast Through 2032
- 8.2 Cross-Regional Segment Analysis
- 8.2.1 By Distribution Channel
- 8.2.2 By Brand/Price Tier
Chapter 9. North America UK Green Solvents in Electronics Market
- 9.1 United States
- 9.2 Canada
- 9.3 Mexico
Chapter 10. Europe UK Green Solvents in Electronics Market
- 10.1 Germany
- 10.2 France
- 10.3 Italy
- 10.4 United Kingdom
- 10.5 Spain
- 10.6 Poland
- 10.7 Russia
- 10.8 Netherlands
- 10.9 Belgium
- 10.10 Sweden
- 10.11 Denmark
- 10.12 Norway
- 10.13 Rest of Europe
Chapter 11. Asia Pacific UK Green Solvents in Electronics Market
- 11.1 China
- 11.2 India
- 11.3 Japan
- 11.4 South Korea
- 11.5 Thailand
- 11.6 Indonesia
- 11.7 Vietnam
- 11.8 Malaysia
- 11.9 Australia
- 11.10 Rest of Asia Pacific
Chapter 12. Latin America UK Green Solvents in Electronics Market
- 12.1 Brazil
- 12.2 Argentina
- 12.3 Colombia
- 12.4 Chile
- 12.5 Rest of Latin America
Chapter 13. Middle East UK Green Solvents in Electronics Market
- 13.1 Saudi Arabia
- 13.2 United Arab Emirates
- 13.3 Turkey
- 13.4 Israel
- 13.5 Iran
- 13.6 Rest of the Middle East
Chapter 14. Africa UK Green Solvents in Electronics Market
- 14.1 South Africa
- 14.2 Egypt
- 14.3 Nigeria
- 14.4 Morocco
- 14.5 Rest of Africa
Chapter 15. UK Green Solvents in Electronics Company Profiles
- 15.1 [Company 01]
- 15.1.1 Company Overview
- 15.1.2 Key Management Personnel
- 15.1.3 Products & Services Portfolio
- 15.1.4 Financial Performance
- 15.1.5 Key Market Focus & Geographic Presence
- 15.1.6 Recent Developments & Strategic Initiatives
Note: The company profile list is preliminary and may change based on research findings, market developments, data availability, and client requirements.
Chapter 16. Appendices
- Appendix A – List of Abbreviations & Acronyms
- Appendix B – Industry Classification Code Reference – Full Series
- Appendix C – Production & Capacity Data Tables
- Appendix D – End-Use & Demand Base Tables
- Appendix E – Consumption & Replacement Rate Assumptions
- Appendix F – ASP Reference Tables
- Appendix G – Manufacturing & Facility Database
- Appendix H – Import-Export Data Tables
- Appendix I – Regulatory Summary Tables
- Appendix J – Primary Research Participant List (Anonymized)
- Appendix K – Primary Research Questionnaire Framework
- Appendix L – Data Sources & Bibliography
- Appendix M – Market Size Divergence & Source Comparison
Chapter 17. Research Methodology
- 17.1 Research Framework & Philosophy
- 17.2 Secondary Research – Sources, Hierarchy & Data Extraction
- 17.3 Data Modeling – Bottom-Up & Top-Down Market Sizing
- 17.4 Primary Research – Stakeholder Framework, LOI & Sample Sizes
- 17.5 Forecast Methodology – Regression, Scenario & Sensitivity Analysis
- 17.6 Quality Control – Four-Layer Validation Framework
- 17.7 Limitations & Standard Assumptions
- 17.8 Disclaimer
