CHAPTER NO. 1 : INTRODUCTION 18
1.1.1. Report Description 18
Purpose of the Report 18
USP & Key Offerings 18
1.1.2. Key Benefits for Stakeholders 18
1.1.3. Target Audience 19
1.1.4. Report Scope 19
1.1.5. Regional Scope 20
CHAPTER NO. 2 : EXECUTIVE SUMMARY 21
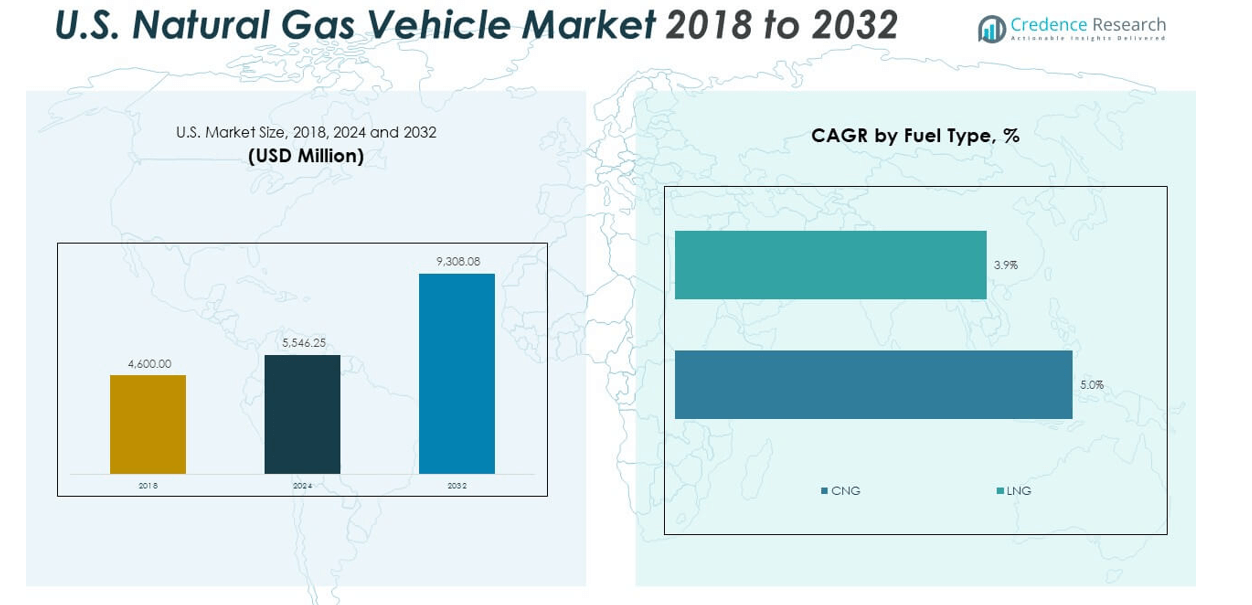
2.1. U.S. Natural Gas Vehicle Market Snapshot 21
2.1.1. U.S. Natural Gas Vehicle Market, 2020 – 2033 (Units) (USD Million) 23
2.2. Insights from Primary Respondents 24
CHAPTER NO. 3 : U.S. NATURAL GAS VEHICLE MARKET – INDUSTRY ANALYSIS 25
3.1. Introduction 25
3.2. Market Drivers 26
3.2.1. Rising Environmental Concerns and Emission Regulations 26
3.2.2. Growing Adoption in Fleet and Commercial Applications 27
3.3. Market Restraints 28
3.3.1. High Initial Vehicle and Conversion Costs 28
3.4. Market Opportunities 29
3.4.1. Market Opportunity Analysis 29
3.5. Porter’s Five Forces Analysis 30
CHAPTER NO. 4 : ANALYSIS COMPETITIVE LANDSCAPE 31
4.1. Company Market Share Analysis – 2024 31
4.1.1. U.S. Natural Gas Vehicle Market: Company Market Share, by Volume, 2024 31
4.1.2. U.S. Natural Gas Vehicle Market: Company Market Share, by Revenue, 2024 32
4.1.3. U.S. Natural Gas Vehicle Market: Top 6 Company Market Share, by Revenue, 2024 33
4.1.4. U.S. Natural Gas Vehicle Market: Top 3 Company Market Share, by Revenue, 2024 33
4.2. U.S. Natural Gas Vehicle Market Company Volume Market Share, 2023 34
4.3. U.S. Natural Gas Vehicle Market Company Revenue Market Share, 2023 35
4.4. Company Assessment Metrics, 2024 36
4.4.1. Stars 36
4.4.2. Emerging Leaders 36
4.4.3. Pervasive Players 36
4.4.4. Participants 36
4.5. Start-ups /SMEs Assessment Metrics, 2024 36
4.5.1. Progressive Companies 36
4.5.2. Responsive Companies 36
4.5.3. Dynamic Companies 36
4.5.4. Starting Blocks 36
4.6. Strategic Developments 37
4.6.1. Acquisitions & Mergers 37
4.6.2. New Product Launch 37
4.6.3. Regional Expansion 37
4.7. Key Players Product Matrix 39
CHAPTER NO. 5 : PESTEL & ADJACENT MARKET ANALYSIS 41
5.1. PESTEL 41
5.1.1. Political Factors 41
5.1.2. Economic Factors 41
5.1.3. Social Factors 41
5.1.4. Technological Factors 41
5.1.5. Environmental Factors 41
5.1.6. Legal Factors 41
5.2. Adjacent Market Analysis 41
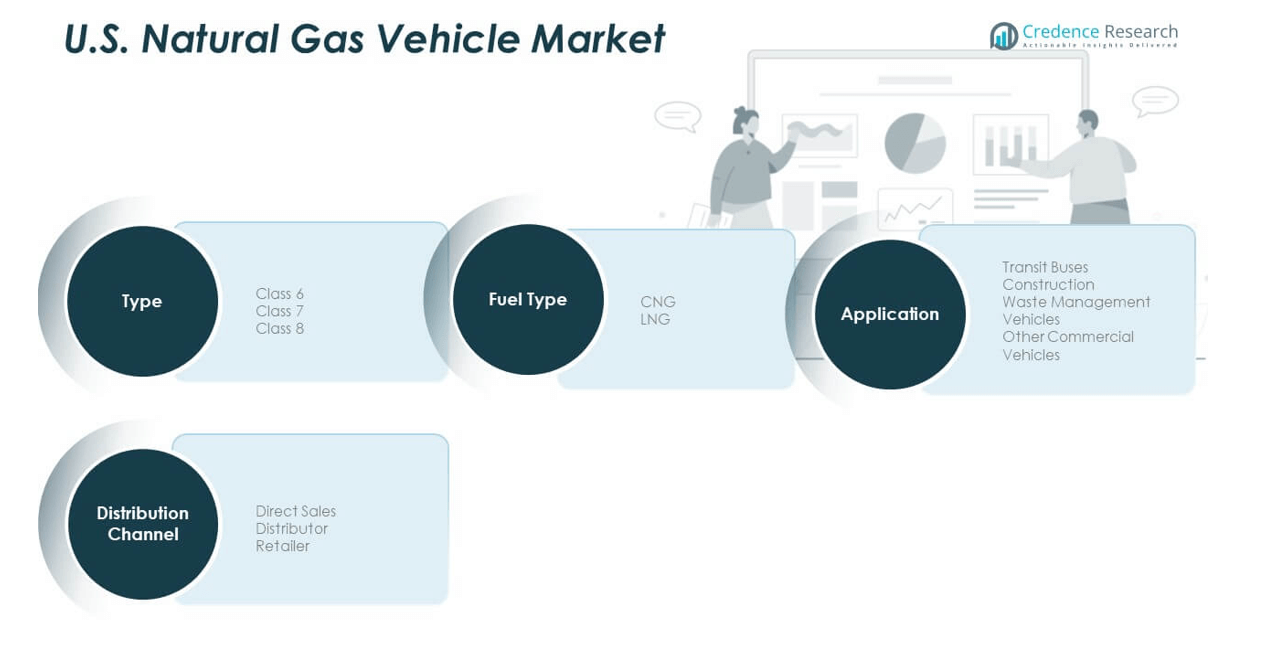
CHAPTER NO. 6 : U.S. NATURAL GAS VEHICLE MARKET – BY TYPE SEGMENT ANALYSIS 42
6.1. U.S. Natural Gas Vehicle Market Overview, by Type Segment 42
6.1.1. U.S. Natural Gas Vehicle Market Volume Share, By Type, 2024 & 2033 43
6.1.2. U.S. Natural Gas Vehicle Market Revenue Share, By Type, 2024 & 2033 43
6.1.3. U.S. Natural Gas Vehicle Market Attractiveness Analysis, By Type 44
6.1.4. Incremental Revenue Growth Opportunity, by Type, 2026 – 2033 45
6.1.5. U.S. Natural Gas Vehicle Market Revenue, By Type, 2020, 2024, 2029 & 2033 46
6.2. Class 6 47
6.3. Class 7 48
6.4. Class 8 49
CHAPTER NO. 7 : U.S. NATURAL GAS VEHICLE MARKET – BY APPLICATION SEGMENT ANALYSIS 50
7.1. U.S. Natural Gas Vehicle Market Overview, by Application Segment 50
7.1.1. U.S. Natural Gas Vehicle Market Volume Share, By Application, 2024 & 2033 51
7.1.2. U.S. Natural Gas Vehicle Market Revenue Share, By Application, 2024 & 2033 51
7.1.3. U.S. Natural Gas Vehicle Market Attractiveness Analysis, By Application 52
7.1.4. Incremental Revenue Growth Opportunity, by Application, 2026 – 2033 53
7.1.5. U.S. Natural Gas Vehicle Market Revenue, By Application, 2020, 2024, 2029 & 2033 54
7.2. Transit Buses 55
7.3. Construction 56
7.4. Waste Management Vehicles 57
7.5. Other Commercial Vehicles 58
CHAPTER NO. 8 : U.S. NATURAL GAS VEHICLE MARKET – BY FUEL TYPE SEGMENT ANALYSIS 59
8.1. U.S. Natural Gas Vehicle Market Overview, by Fuel Type Segment 59
8.1.1. U.S. Natural Gas Vehicle Market Attractiveness Analysis, By End-user 60
8.1.2. U.S. Natural Gas Vehicle Market Volume Share, By End-user, 2024 & 2033 61
8.1.3. U.S. Natural Gas Vehicle Market Revenue Share, By End-user, 2024 & 2033 61
8.1.4. Incremental Revenue Growth Opportunity, by End-user, 2026 – 2033 62
8.1.5. U.S. Natural Gas Vehicle Market Revenue, By End-user, 2020, 2024, 2029 & 2033 63
8.2. CNG 64
8.3. LNG 65
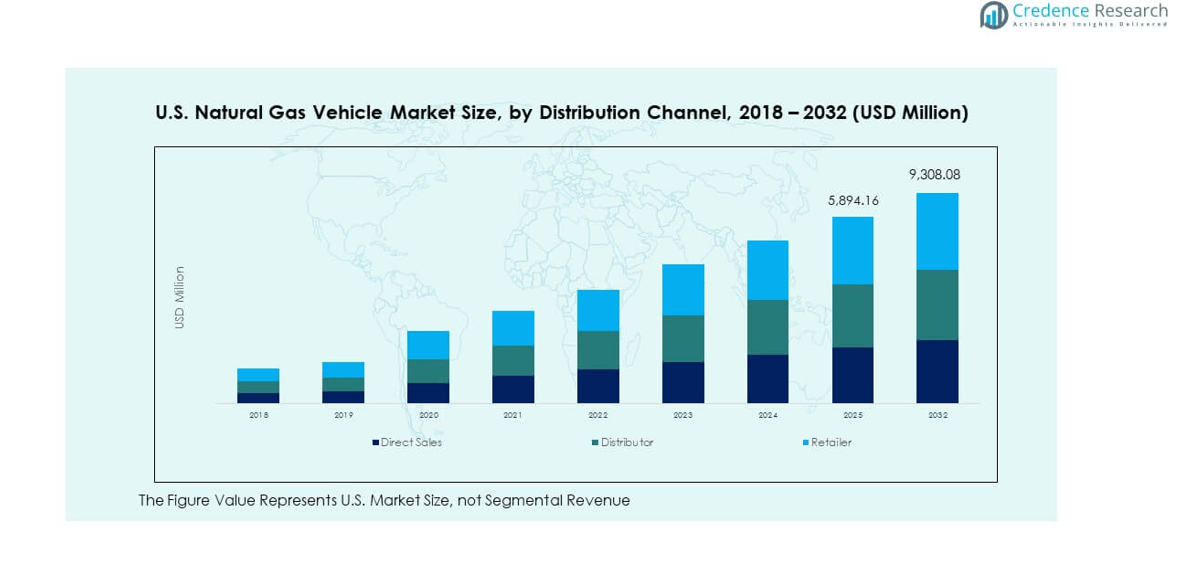
CHAPTER NO. 9 : U.S. NATURAL GAS VEHICLE MARKET – BY DISTRIBUTION CHANNEL SEGMENT ANALYSIS 66
9.1. U.S. Natural Gas Vehicle Market Overview, by Distribution Channel Segment 66
9.1.1. U.S. Natural Gas Vehicle Market Volume Share, By Distribution Channel, 2024 & 2033 67
9.1.2. U.S. Natural Gas Vehicle Market Revenue Share, By Distribution Channel, 2024 & 2033 67
9.1.3. U.S. Natural Gas Vehicle Market Attractiveness Analysis, By Distribution Channel 68
9.1.4. Incremental Revenue Growth Opportunity, by Distribution Channel, 2026 – 2033 69
9.1.5. U.S. Natural Gas Vehicle Market Revenue, By Distribution Channel, 2020, 2024, 2029 & 2033 70
9.2. Direct Sales 71
9.3. Distributor 72
9.4. Retailer 73
CHAPTER NO. 10 : NATURAL GAS VEHICLE MARKET – U.S. 74
10.1. U.S. 74
10.1.1. Key Highlights 74
10.1.2. U.S. Natural Gas Vehicle Market Volume, By States, 2020 – 2025 (Units) 75
10.1.3. U.S. Natural Gas Vehicle Market Revenue, By States, 2020 – 2025 (USD Million) 76
10.1.4. U.S. Natural Gas Vehicle Market Volume, By Type, 2020 – 2025 (Units) 77
10.1.5. U.S. Natural Gas Vehicle Market Revenue, By Type, 2020 – 2025 (USD Million) 78
10.1.6. U.S. Natural Gas Vehicle Market Volume, By Application, 2020 – 2025 (Units) 79
10.1.7. U.S. Natural Gas Vehicle Market Revenue, By Application, 2020 – 2025 (USD Million) 80
10.1.8. U.S. Natural Gas Vehicle Market Volume, By End-user, 2020 – 2025 (Units) 81
10.1.9. U.S. Natural Gas Vehicle Market Revenue, By End-user, 2020 – 2025 (USD Million) 82
10.1.10. U.S. Natural Gas Vehicle Market Volume, By Distribution Channel, 2020 – 2025 (Units) 83
10.1.11. U.S. Natural Gas Vehicle Market Revenue, By Distribution Channel, 2020 – 2025 (USD Million) 84
10.1.12. U.S. Natural Gas Vehicle Market Volume, By Sales Channel, 2020 – 2025 (Units) 85
10.1.13. U.S. Natural Gas Vehicle Market Revenue, By Sales Channel, 2020 – 2025 (USD Million) 86
CHAPTER NO. 11 : COMPANY PROFILES 87
11.1. Freightliner (Daimler Trucks North America) 87
11.1.1. Company Overview 87
11.1.2. Product Portfolio 87
11.1.3. Financial Overview 87
11.2. Kenworth (PACCAR) 88
11.3. Peterbilt (PACCAR) 88
11.4. Mack Trucks (Volvo Group) 88
11.5. Volvo Trucks North America 88
11.6. Navistar (International Trucks) 88
11.7. Greenkraft Inc. 88
11.8. NGV Global Group 88
11.9. Hexagon Agility 88
11.10. McNeilus Truck & Manufacturing 88
Disclaimer 89
List of Figures
FIG NO. 1. U.S. Natural Gas Vehicle Market Volume & Revenue, 2020 – 2033 (Units) (USD Million) 23
FIG NO. 2. Porter’s Five Forces Analysis for U.S. Natural Gas Vehicle Market 30
FIG NO. 3. Company Share Analysis, 2024 31
FIG NO. 4. Company Share Analysis, 2024 32
FIG NO. 5. Company Share Analysis, 2024 33
FIG NO. 6. Company Share Analysis, 2024 33
FIG NO. 7. U.S. Natural Gas Vehicle Market – Company Volume Market Share, 2023 34
FIG NO. 8. U.S. Natural Gas Vehicle Market – Company Revenue Market Share, 2023 35
FIG NO. 9. U.S. Natural Gas Vehicle Market Volume Share, By Type, 2024 & 2033 43
FIG NO. 10. U.S. Natural Gas Vehicle Market Revenue Share, By Type, 2024 & 2033 43
FIG NO. 11. Market Attractiveness Analysis, By Type 44
FIG NO. 12. Incremental Revenue Growth Opportunity by Type, 2026 – 2033 45
FIG NO. 13. U.S. Natural Gas Vehicle Market Revenue, By Type, 2020, 2024, 2029 & 2033 46
FIG NO. 14. U.S. Natural Gas Vehicle Market for Class 6, Volume & Revenue (Units) (USD Million) 2020 – 2033 47
FIG NO. 15. U.S. Natural Gas Vehicle Market for Class 7, Volume & Revenue (Units) (USD Million) 2020 – 2033 48
FIG NO. 16. U.S. Natural Gas Vehicle Market for Class 8, Volume & Revenue (Units) (USD Million) 2020 – 2033 49
FIG NO. 17. U.S. Natural Gas Vehicle Market Volume Share, By Application, 2024 & 2033 51
FIG NO. 18. U.S. Natural Gas Vehicle Market Revenue Share, By Application, 2024 & 2033 51
FIG NO. 19. Market Attractiveness Analysis, By Application 52
FIG NO. 20. Incremental Revenue Growth Opportunity by Application, 2026 – 2033 53
FIG NO. 21. U.S. Natural Gas Vehicle Market Revenue, By Application, 2020, 2024, 2029 & 2033 54
FIG NO. 22. U.S. Natural Gas Vehicle Market for Transit Buses, Volume & Revenue (Units) (USD Million) 2020 – 2033 55
FIG NO. 23. U.S. Natural Gas Vehicle Market for Construction, Volume & Revenue (Units) (USD Million) 2020 – 2033 56
FIG NO. 24. U.S. Natural Gas Vehicle Market for Waste Management Vehicles, Volume & Revenue (Units) (USD Million) 2020 – 2033 57
FIG NO. 25. U.S. Natural Gas Vehicle Market for Other Commercial Vehicles, Volume & Revenue (Units) (USD Million) 2020 – 2033 58
FIG NO. 26. Market Attractiveness Analysis, By End-user 60
FIG NO. 27. U.S. Natural Gas Vehicle Market Volume Share, By End-user, 2024 & 2033 61
FIG NO. 28. U.S. Natural Gas Vehicle Market Revenue Share, By End-user, 2024 & 2033 61
FIG NO. 29. Incremental Revenue Growth Opportunity by End-user, 2026 – 2033 62
FIG NO. 30. U.S. Natural Gas Vehicle Market Revenue, By End-user, 2020, 2024, 2029 & 2033 63
FIG NO. 31. U.S. Natural Gas Vehicle Market for CNG, Volume & Revenue (Units) (USD Million) 2020 – 2033 64
FIG NO. 32. U.S. Natural Gas Vehicle Market for LNG, Volume & Revenue (Units) (USD Million) 2020 – 2033 65
FIG NO. 33. U.S. Natural Gas Vehicle Market Volume Share, By Distribution Channel, 2024 & 2033 67
FIG NO. 34. U.S. Natural Gas Vehicle Market Revenue Share, By Distribution Channel, 2024 & 2033 67
FIG NO. 35. Market Attractiveness Analysis, By Distribution Channel 68
FIG NO. 36. Incremental Revenue Growth Opportunity by Distribution Channel, 2026 – 2033 69
FIG NO. 37. U.S. Natural Gas Vehicle Market Revenue, By Distribution Channel, 2020, 2024, 2029 & 2033 70
FIG NO. 38. U.S. Natural Gas Vehicle Market for Direct Sales, Volume & Revenue (Units) (USD Million) 2020 – 2033 71
FIG NO. 39. U.S. Natural Gas Vehicle Market for Distributor, Volume & Revenue (Units) (USD Million) 2020 – 2033 72
FIG NO. 40. U.S. Natural Gas Vehicle Market for Retailer, Volume & Revenue (Units) (USD Million) 2020 – 2033 73
FIG NO. 41. U.S. Natural Gas Vehicle Market Volume & Revenue, 2020 – 2033 (Units) (USD Million) 74
List of Tables
TABLE NO. 1. : U.S. Natural Gas Vehicle Market: Snapshot 21
TABLE NO. 2. : Drivers for the U.S. Natural Gas Vehicle Market: Impact Analysis 26
TABLE NO. 3. : Restraints for the U.S. Natural Gas Vehicle Market: Impact Analysis 28
TABLE NO. 4. : U.S. Natural Gas Vehicle Market Volume, By States, 2020 – 2025 (Units) 75
TABLE NO. 5. : U.S. Natural Gas Vehicle Market Volume, By States, 2026 – 2033 (Units) 75
TABLE NO. 6. : U.S. Natural Gas Vehicle Market Revenue, By States, 2020 – 2025 (USD Million) 76
TABLE NO. 7. : U.S. Natural Gas Vehicle Market Revenue, By States, 2026 – 2033 (USD Million) 76
TABLE NO. 8. : U.S. Natural Gas Vehicle Market Volume, By Type, 2020 – 2025 (Units) 77
TABLE NO. 9. : U.S. Natural Gas Vehicle Market Volume, By Type, 2026 – 2033 (Units) 77
TABLE NO. 10. : U.S. Natural Gas Vehicle Market Revenue, By Type, 2020 – 2025 (USD Million) 78
TABLE NO. 11. : U.S. Natural Gas Vehicle Market Revenue, By Type, 2026 – 2033 (USD Million) 78
TABLE NO. 12. : U.S. Natural Gas Vehicle Market Volume, By Application, 2020 – 2025 (Units) 79
TABLE NO. 13. : U.S. Natural Gas Vehicle Market Volume, By Application, 2026 – 2033 (Units) 79
TABLE NO. 14. : U.S. Natural Gas Vehicle Market Revenue, By Application, 2020 – 2025 (USD Million) 80
TABLE NO. 15. : U.S. Natural Gas Vehicle Market Revenue, By Application, 2026 – 2033 (USD Million) 80
TABLE NO. 16. : U.S. Natural Gas Vehicle Market Volume, By End-user, 2020 – 2025 (Units) 81
TABLE NO. 17. : U.S. Natural Gas Vehicle Market Volume, By End-user, 2026 – 2033 (Units) 81
TABLE NO. 18. : U.S. Natural Gas Vehicle Market Revenue, By End-user, 2020 – 2025 (USD Million) 82
TABLE NO. 19. : U.S. Natural Gas Vehicle Market Revenue, By End-user, 2026 – 2033 (USD Million) 82
TABLE NO. 20. : U.S. Natural Gas Vehicle Market Volume, By Distribution Channel, 2020 – 2025 (Units) 83
TABLE NO. 21. : U.S. Natural Gas Vehicle Market Volume, By Distribution Channel, 2026 – 2033 (Units) 83
TABLE NO. 22. : U.S. Natural Gas Vehicle Market Revenue, By Distribution Channel, 2020 – 2025 (USD Million) 84
TABLE NO. 23. : U.S. Natural Gas Vehicle Market Revenue, By Distribution Channel, 2026 – 2033 (USD Million) 84
TABLE NO. 24. : U.S. Natural Gas Vehicle Market Volume, By Sales Channel, 2020 – 2025 (Units) 85
TABLE NO. 25. : U.S. Natural Gas Vehicle Market Volume, By Sales Channel, 2026 – 2033 (Units) 85
TABLE NO. 26. : U.S. Natural Gas Vehicle Market Revenue, By Sales Channel, 2020 – 2025 (USD Million) 86
TABLE NO. 27. : U.S. Natural Gas Vehicle Market Revenue, By Sales Channel, 2026 – 2033 (USD Million) 86