
Market Overview:
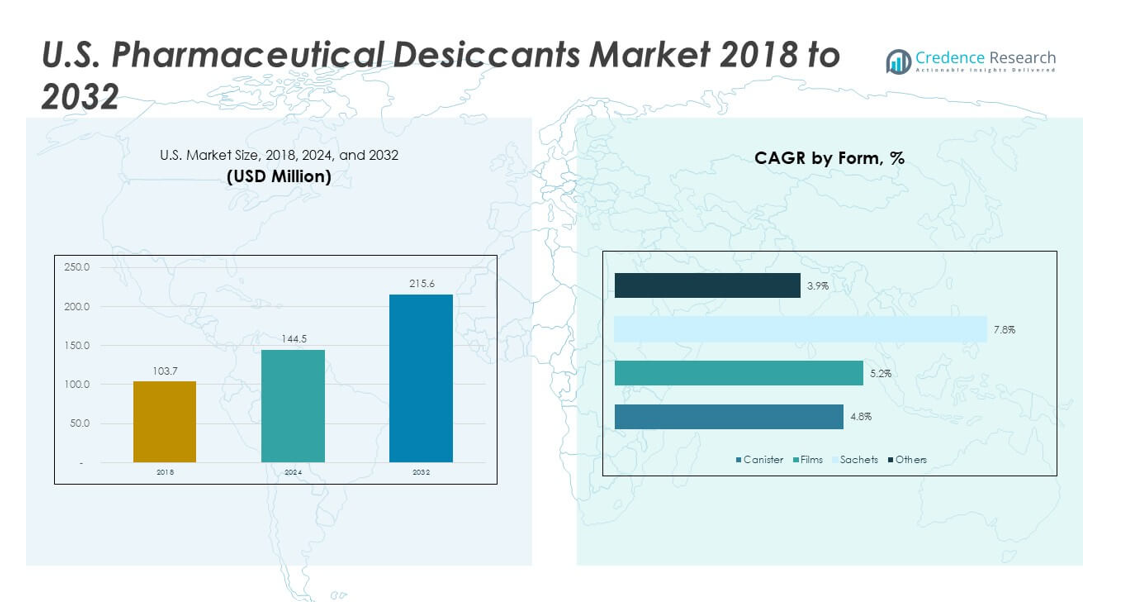
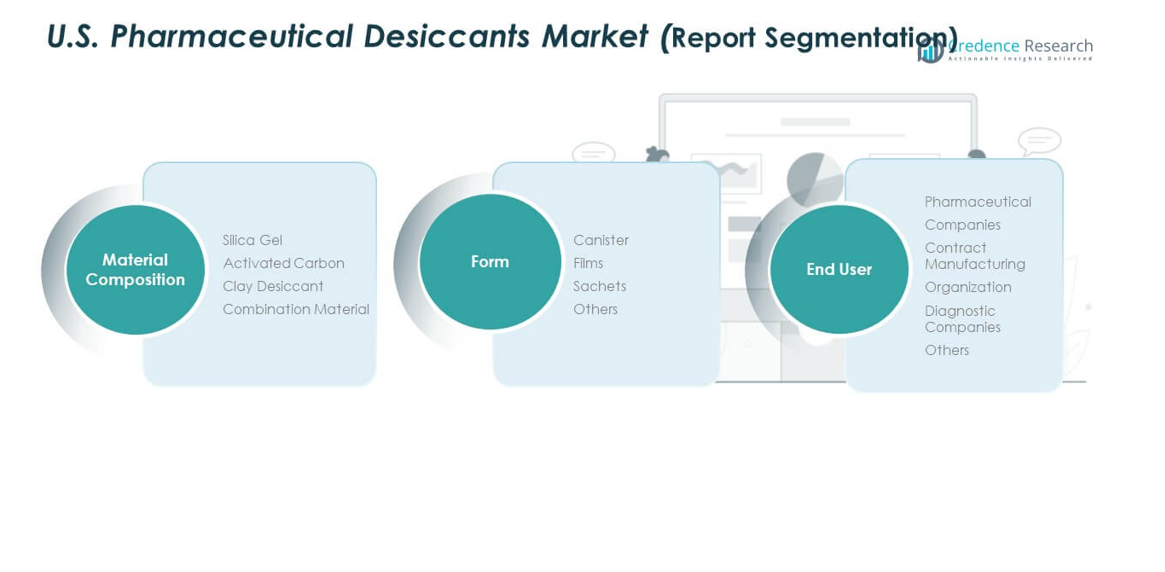
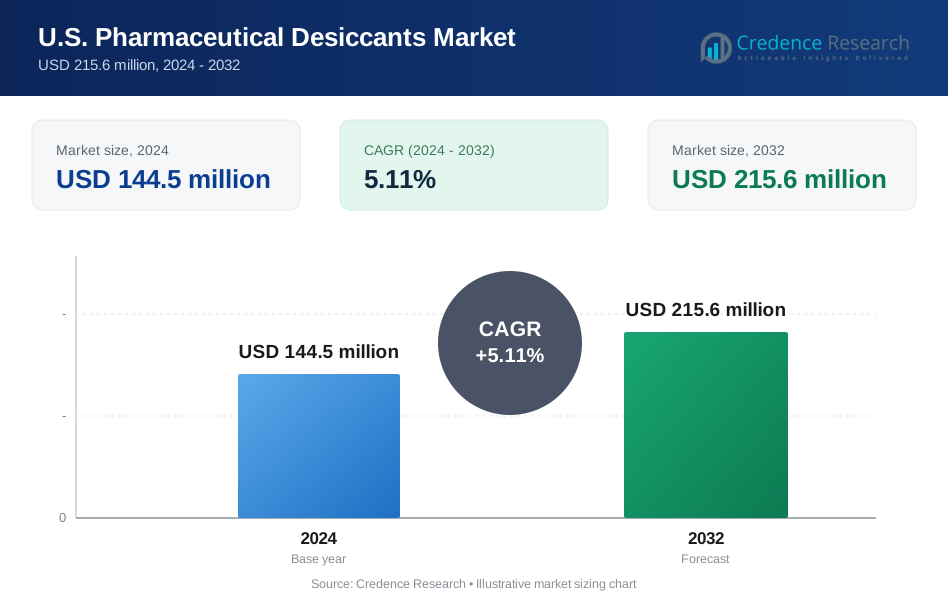
The U.S. Pharmaceutical Desiccants Market size was valued at USD 103.7 million in 2018 to USD 144.5 million in 2024 and is anticipated to reach USD 215.6 million by 2032, at a CAGR of 5.11% during the forecast period.
| REPORT ATTRIBUTE | DETAILS |
|---|---|
| Historical Period | 2020-2023 |
| Base Year | 2024 |
| Forecast Period | 2025-2032 |
| U.S. Pharmaceutical Desiccants Market Size 2024 | USD 144.5 million |
| U.S. Pharmaceutical Desiccants Market, CAGR | 5.11% |
| U.S. Pharmaceutical Desiccants Market Size 2032 | USD 215.6 million |
Growth in the U.S. market is driven by rising production of moisture-sensitive medicines, strong demand for stable packaging formats, and expanding cold-chain logistics. Drug makers prefer advanced silica gel, molecular sieves, and hybrid desiccants that offer higher absorption strength. It benefits from rapid growth in biologics, where stability needs are high. Rising focus on product integrity boosts adoption across blister packs, bottle packaging, and bulk containers. Strict regulatory rules on drug safety encourage wider integration of protection systems. Growth in contract manufacturing also helps expand usage across varied drug formats.
Geographically, the U.S. Pharmaceutical Desiccants Market gains strong support from leading drug manufacturing hubs on the East Coast and Midwest. These regions host major production units, packaging centres, and distribution clusters that rely on controlled-environment packaging. Growth in Southern states is rising due to expanding investment in pharma plants and supportive tax structures. Western states show emerging potential with rising biotechnology activity. Strong infrastructure, skilled labour, and dense supply chains help traditional hubs retain leadership, while newer clusters grow due to diversification and increased biologics production.
Market Insights:
- The U.S. Pharmaceutical Desiccants Market was USD 103.7 million in 2018, reached USD 144.5 million in 2024, and is projected to hit USD 215.6 million by 2032, growing at a 11% CAGR driven by rising demand for moisture-controlled pharmaceutical packaging.
- The Northeast leads with ~38% share, supported by dense pharma clusters and advanced packaging infrastructure, followed by the Midwest at ~27% with large-scale manufacturing plants, while the South & West hold ~35% due to expanding biotech and generics production.
- The West emerges as the fastest-growing region, holding part of the combined 35% Southern–Western share, driven by biotechnology hubs, diagnostic kit production, and expanding self-care device manufacturing.
- Based on the image, silica gel accounts for the largest share at roughly ~40%, supported by strong compatibility with oral solids and stable adsorption capacity across drug formats.
- Activated carbon (~25%) and clay desiccants (~20%) follow, while combination materials (~15%) grow steadily due to balanced moisture-control properties suited for sensitive formulations.
Market Drivers:
Rising Demand for Moisture-Controlled Packaging
Growth in the U.S. Pharmaceutical Desiccants Market is driven by rising use of moisture-sensitive drugs. It supports protection needs in tablets, capsules, and high-value biologics. Companies focus on improving product stability to meet strict quality rules. Drug makers integrate desiccants into bottles, sachets, and blister formats. Rising output in oral solids strengthens demand across key sites. Contract manufacturers expand usage to maintain long-term storage quality. Strong compliance needs encourage continued investment across packaging lines.
- For instance, Clariant’s EQius® desiccant line supports humidity-regulated packaging and is used in pharma applications requiring consistent adsorption performance, with units engineered to deliver calibrated moisture control.
Growth in Biologics and High-Potency Drugs
Increasing production of biologics fuels strong demand for controlled-environment packaging. The U.S. Pharmaceutical Desiccants Market benefits from rapid expansion in biotech pipelines. It supports stability needs for moisture-reactive formulations. Manufacturers deploy advanced desiccants to maintain drug purity during transit. Growing cold-chain activity pushes wider adoption across shipping units. Biologics developers seek reliable systems to protect sensitive batches. Rising investment in specialty drugs strengthens long-term consumption patterns.
- For instance, Sanner’s AdPack® canisters are widely used for high-potency and biologic medicines and are tested to deliver high adsorption capacity under accelerated stability conditions.
Regulatory Pressure to Maintain Product Integrity
Strict U.S. regulations drive wider adoption of high-performance desiccants across packaging stages. It helps drug makers meet stability, safety, and potency rules. Regulatory audits push companies to upgrade protection materials. Packaging teams integrate smarter desiccant systems to reduce failure risks. Growth in sterile manufacturing encourages tighter control on humidity exposure. FDA requirements promote solutions that safeguard long storage cycles. Compliance pressure creates steady and predictable demand across major facilities.
Expansion of Contract Manufacturing and Packaging
Growth in outsourcing activities supports strong demand for protective packaging solutions. The U.S. Pharmaceutical Desiccants Market gains traction from rising production partnerships. It benefits from expanding facilities that handle diverse drug formats. Contract packagers integrate desiccants into multiple delivery systems. Rising project volumes create consistent procurement cycles. Flexible capacity encourages broader use across short-run batches. Outsourcing trends help extend market reach into small and mid-scale drug makers.
Market Trends:
Shift Toward Smart and Functional Desiccant Systems
Emerging smart desiccants create new momentum across drug packaging lines. The U.S. Pharmaceutical Desiccants Market observes rising interest in indicators and colour-changing formats. It supports higher visibility in moisture tracking for sensitive drugs. Manufacturers adopt systems that provide quick checks during storage. Smart formats allow faster decision cycles in quality teams. Demand grows for units that integrate well with digital tools. Research drives new solutions that enhance real-time monitoring.
- For instance, Multisorb’s StripPax® sorbents incorporate humidity-indicator technology compatible with rapid visual inspections in pharma storage workflows.
Rising Focus on Sustainable and Eco-Friendly Materials
Sustainability trends shape new innovations in desiccant design. The U.S. Pharmaceutical Desiccants Market sees strong interest in recyclable and low-waste formats. It aligns with industry goals to reduce environmental impact. Packaging teams test plant-based or biodegradable components. Drug makers prefer low-energy production materials. Green packaging goals push evaluation of alternative absorbents. Sustainability rules encourage wider pilot projects across major brands. Early adoption grows among firms with public sustainability commitments.
- For instance, Wisesorbent’s eco-friendly desiccant packets use reduced-plastic designs aligned with global packaging sustainability guidelines.
Integration of Desiccants in High-Barrier Packaging Formats
Demand grows for pairing desiccants with stronger barrier materials. The U.S. Pharmaceutical Desiccants Market supports packaging built for long storage cycles. It improves protection for moisture-intense environments. Drug makers use engineered films and coated laminates. Growth in global shipping networks increases reliance on stronger barriers. Pairing formats enhances reliability for complex molecules. Companies test hybrid systems that merge barrier layers with internal absorbents.
Rising Adoption in Advanced Delivery Systems
New drug delivery systems expand the scope for integrated desiccants. The U.S. Pharmaceutical Desiccants Market benefits from devices that need tight humidity control. It supports inhalers, pens, diagnostic kits, and implantable units. Designers add micro-desiccants to preserve device stability. Growth in self-administration tools widens this need. Companies focus on compact formats that fit into small chambers. Demand increases as home-care devices gain broader use.
Market Challenges Analysis:
Complex Integration Needs Across Modern Packaging Designs
Diverse packaging formats create growing challenges for efficient desiccant placement. The U.S. Pharmaceutical Desiccants Market faces issues when teams work with miniature, high-density drug systems. It requires precise positioning to maintain balanced humidity levels. Complex device geometries raise compatibility concerns. Companies test multiple formats before reaching final approval. Regulatory testing extends timelines for new product rollouts. It increases design complexity during early development phases. Technical hurdles slow wider use in emerging delivery systems.
High Regulatory Burden and Rising Validation Requirements
Regulatory pressure remains a major challenge for manufacturers. The U.S. Pharmaceutical Desiccants Market must meet strict rules for purity, stability, and material safety. It demands extensive validation across production cycles. Small producers struggle with compliance cost burdens. Frequent audits increase documentation needs for packaging teams. Long approval cycles delay upgrades to new desiccant systems. Teams manage high testing loads across multiple product categories. Rising standards continue to stretch operational capacity.
Market Opportunities:
Growth of Biotech Manufacturing Clusters Across the U.S.
Expanding biotech hubs create strong opportunities for advanced desiccant solutions. The U.S. Pharmaceutical Desiccants Market gains exposure to high-value biologics pipelines. It supports new facilities that require stable moisture control. Companies seek custom formats for novel molecules. Biotech clusters expand procurement volumes each year. High-potency drug development strengthens long-term demand. Growth in specialty segments widens entry points for new suppliers.
Adoption of High-Performance Hybrid and Smart Materials
Innovation in hybrid and smart desiccants opens new revenue channels for manufacturers. The U.S. Pharmaceutical Desiccants Market benefits from rising demand for functional packaging. It offers value through real-time visibility and extended stability performance. Companies explore advanced absorbents for complex formulations. Smart indicators help teams monitor moisture during long storage periods. Hybrid blends support stronger protection in large-scale shipping. This shift creates space for next-generation technology suppliers.
Market Segmentation Analysis:
By Material Composition
The U.S. Pharmaceutical Desiccants Market features strong demand across silica gel, activated carbon, clay desiccants, and combination materials. Silica gel holds wide acceptance due to stable adsorption capacity. Activated carbon supports odor control and complex drug protection needs. Clay desiccants gain traction for cost efficiency in large-volume packaging. Combination materials offer balanced moisture absorption for sensitive formulations. It supports varied product categories that require controlled humidity across long storage cycles. Growth in specialty drugs expands the role of advanced blends across packaging lines.
- For instance, Fuji Silysia Chemical produces silica gel grades that support pharmaceutical applications with controlled pore structure and consistent adsorption kinetics.
By Form
Key forms include canisters, films, sachets, and other customized units. Canisters lead usage in bottle packaging due to ease of insertion and strong moisture uptake. Films support compact applications in device chambers. Sachets remain common across tablets, capsules, and bulk container formats. Other forms, such as engineered inserts, grow with complex drug delivery systems. It allows packaging teams to match absorbent format with drug profile needs. Growth in miniaturized devices drives demand for thinner and flexible solutions.
- For instance, Sanner, the world's leading manufacturer of desiccant closures and effervescent packaging solutions, produces plastic partseach year for standard and customized packaging solutions.
By End User
End users include pharmaceutical companies, CMOs, diagnostic companies, and other healthcare producers. Pharmaceutical companies drive major consumption due to strict stability needs. CMOs adopt varied formats to serve diverse product portfolios. Diagnostic companies rely on desiccants to protect test kits and reagents. Other users adopt protection solutions for niche healthcare products. It gains traction across facilities that prioritize long-term drug integrity and compliance. Growth in outsourcing continues to expand demand across all end-user categories.
Segmentation:
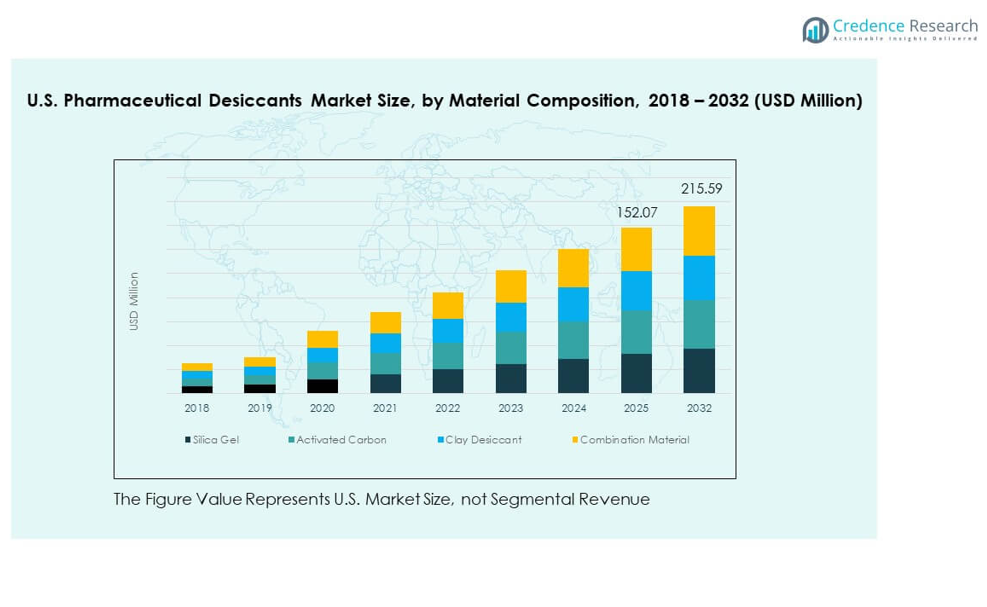
By Material Composition
- Silica Gel
- Activated Carbon
- Clay Desiccant
- Combination Material
By Form
- Canister
- Films
- Sachets
- Others
By End User
- Pharmaceutical Companies
- Contract Manufacturing Organizations (CMOs)
- Diagnostic Companies
- Others
Regional Analysis:
Northeast Region
The U.S. Pharmaceutical Desiccants Market records strong leadership in the Northeast, holding an estimated 38% share. The region hosts dense pharmaceutical clusters, major biotech hubs, and advanced packaging facilities. It benefits from strong R&D spending and high adoption of controlled-environment packaging. Large-scale drug manufacturers integrate desiccants across diverse production lines. Contract packagers in this region maintain strict quality systems that support wider usage. It gains steady demand from biologics producers that rely on stable humidity control for sensitive molecules.
Midwest Region
The Midwest secures an estimated 27% share, driven by large manufacturing plants, bulk drug producers, and efficient logistics networks. The U.S. Pharmaceutical Desiccants Market sees steady adoption in this region due to strong industrial capability. It supports major pill, capsule, and injectable production sites that require consistent moisture protection. Growing investment in advanced packaging expands demand for silica gel and hybrid solutions. CMOs across the Midwest integrate desiccants into full-service packaging workflows. Strong supply chain access strengthens long-term usage across varied drug categories.
South & West Regions
Southern and Western states together account for roughly 35% share, supported by rising pharma expansion and growing biotech activity. The U.S. Pharmaceutical Desiccants Market gains momentum in the South due to new manufacturing plants and favorable operating costs. It supports rising investment in generics and specialty drug facilities. Western states gain demand from fast-growing biotechnology hubs and diagnostic kit producers. Growth in home-care device manufacturing expands usage of films and micro-desiccants. These regions continue to emerge as attractive expansion zones for producers seeking diversified geographic presence.
Key Player Analysis:
- Desiccare Inc
- Fuji Silysia Chemical Ltd.
- Pharma Desiccants
- Porocel
- Silica Gel Desiccant
- WISESORBENT TECHNOLOGY LLC
- Clariant
- Baltimore Innovations
- Sanner
- Other Key Players
Competitive Analysis:
Competition in the U.S. Pharmaceutical Desiccants Market centers on material innovation, product reliability, and performance in high-value drug packaging. Leading players focus on silica gel, activated carbon, clay, and hybrid solutions to meet diverse stability needs. It benefits from strong participation by specialized desiccant manufacturers and packaging technology firms. Companies differentiate through high-capacity adsorption systems, compact formats, and regulatory-compliant materials. Strategic expansion by CMOs increases demand for flexible formats and integrated solutions. Players also invest in automation and process upgrades to support large-scale production. Market concentration remains moderate, with strong rivalry across product, form, and application categories.
Recent Developments:
- In November 2025, Clariant celebrated the completion of its strategic CHF 80 million (USD 99.8 million) investment to expand its Care Chemicals facility at Daya Bay, China. This significant expansion substantially boosted Clariant's manufacturing capabilities in one of its key growth markets, specifically enhancing pharmaceutical capabilities through the addition of a second spray tower designed to serve customers in south China. The pharmaceutical capabilities expansion positioned Clariant as a key supplier for both Active Pharmaceutical Ingredients (APIs) in laxatives and pharmaceutical excipients throughout China. This facility now maintains consistent quality standards across China and worldwide, serving as a cornerstone of Clariant's healthcare business. The investment reinforced Clariant's position as a leading supplier of high-quality specialty chemicals in Asia, addressing the increasing quality and performance expectations of Chinese consumers and industries.
- In May 2025, Sanner Group, a German-based medtech contract development and manufacturing organization (CDMO), formally introduced an optimized version of its TabTec CR packaging solution, a pill and capsule dispenser for single-dose oral solid dosage (OSD) products. Building on its original announcement from October 2019, Sanner enhanced the design with improved closure tightness and tailored desiccant selection to cater to the demands of OSD producers for brand differentiation, moisture protection, and efficient packaging processes. The improvements, which were previewed in November 2024, included enhanced tightness and tailored desiccants that provide optimal moisture protection even for highly sensitive active ingredients. Sanner's "Advance with Agility" program helped identify the right desiccant solution for manufacturers and enabled rapid product launches using predictive stability modeling to achieve stability targets.
- In May 2024, the pharmaceutical desiccants industry witnessed a significant consolidation event when Sorbead India and Swambe Chemicals announced their merger to form Sorbchem India Private Limited. This acquisition, initially disclosed in January 2024, was successfully completed on 29 April 2024, with formal closure of the sale transaction. The merged entity now operates under Zeochem (Chemistry Division of the CPH Chemie + Papier Group), representing a strategic advancement in global expansion efforts. Sorbead India, which had been committed to protecting products from moisture and humidity damage through specialized expertise in adsorbents and desiccants, combined its strengths with Swambe Chemicals, a pioneer founded in 1973 that specialized in silica gel and allied products, particularly for column chromatographic techniques and air and gas drying applications. This consolidation enables the merged entity to expand its product range and deliver superior moisture protection solutions across the packaging and pharmaceutical sectors.
Report Coverage:
The research report offers an in-depth analysis based on material composition, form, and end-user segments. It details leading market players, providing an overview of their business, product offerings, investments, revenue streams, and key applications. Additionally, the report includes insights into the competitive environment, SWOT analysis, current market trends, as well as the primary drivers and constraints. Furthermore, it discusses various factors that have driven market expansion in recent years. The report also explores market dynamics, regulatory scenarios, and technological advancements that are shaping the industry. It assesses the impact of external factors and global economic changes on market growth. Lastly, it provides strategic recommendations for new entrants and established companies to navigate the complexities of the market.
Future Outlook:
- Rising demand for moisture-sensitive oral solid drugs will strengthen long-term adoption.
- Growth in biologics production will increase the need for advanced moisture-control formats.
- CMOs will expand usage as outsourcing gains momentum across drug manufacturing.
- High-barrier packaging innovations will support integration of hybrid desiccant materials.
- Smart desiccants with indicator features will gain traction in quality-focused facilities.
- Diagnostic kit expansion will lift demand for films and compact absorbent units.
- Sustainability goals will push producers toward recyclable and eco-friendly materials.
- Automation in packaging lines will improve compatibility with fast-insert desiccant formats.
- Emerging biotech hubs will widen geographic demand and diversify procurement patterns.
- Regulatory pressure on drug stability will reinforce steady growth across all segments.
Request a Free Sample
Fill in your details and we'll send you a free sample report.
- Sample data tables & charts
- Research methodology
Need a Custom Version of This Report?
Tailor the scope, geography, or segments to your exact requirements.
- Custom geography or segment scope
- Direct access to our analyst team
Frequently Asked Questions
What is the current market size for the U.S. Pharmaceutical Desiccants Market, and what is its projected size in 2032?
At what Compound Annual Growth Rate is the U.S. Pharmaceutical Desiccants Market projected to grow between 2024 and 2032?
Which U.S. Pharmaceutical Desiccants Market segment held the largest share in 2024?
What are the primary factors fueling the growth of the U.S. Pharmaceutical Desiccants Market?
Who are the leading companies in the U.S. Pharmaceutical Desiccants Market?
Which region commanded the largest share of the U.S. Pharmaceutical Desiccants Market in 2024?
Table of Content
Chapter 1. Report Introduction
- 1.1 Report Description & Purpose
- 1.1.1 Report Title & Market Definition
- 1.1.2 Unique Selling Propositions (USP) & Key Differentiators
- 1.1.3 Value Proposition for Stakeholders
- 1.2 Research Objectives
- 1.2.1 Market Sizing Objectives (Volume & Revenue)
- 1.2.2 Segmentation Objectives
- 1.2.3 Competitive Intelligence Objectives
- 1.2.4 Forecast & Scenario Objectives
- 1.3 Report Scope
- 1.3.1 U.S. Pharmaceutical Desiccants Scope – Types & Subtypes Covered
- 1.3.2 Geographic Scope – Regions & Countries Covered
- 1.3.3 Historical Period, Base Year & Forecast Period (2024; forecast to 2032)
- 1.3.4 Inclusions & Exclusions
- 1.4 HS Code & Classification Framework
- 1.5 Currency, Units & Pricing Basis
- 1.6 Target Stakeholders
- 1.7 Limitations & Assumptions
Chapter 2. Executive Summary
- 2.1 Global U.S. Pharmaceutical Desiccants Market Snapshot
- 2.1.1 Market Size – Historical (2024) & Forecast (2024-2032) (2024: USD 144.5 million → 2032: USD 215.6 million)
- 2.1.2 Volume & Revenue – Global Totals
- 2.1.3 Key Market Highlights – Top Five Facts
- 2.2 U.S. Pharmaceutical Desiccants Market Segmentation Snapshot
- 2.2.1 Market Split by Region – 2024 vs. 2032
- 2.3 Competitive Snapshot
- 2.3.1 Top 10 Players by Revenue Share – 2024
- 2.3.2 Top 10 Players by Volume Share – 2024
- 2.3.3 Recent Strategic Developments (18-Month Summary)
- 2.4 Key Investment Highlights & Strategic Conclusions
Chapter 3. U.S. Pharmaceutical Desiccants Market Dynamics & Industry Analysis
- 3.1 Market Overview & Context
- 3.1.1 U.S. Pharmaceutical Desiccants Market Position in the Broader Automotive Value Chain
- 3.1.2 OEM vs. Replacement Market Dynamics
- 3.1.3 Market Maturity & Development Stage by Region
- 3.2 U.S. Pharmaceutical Desiccants Market Drivers
- 3.3 U.S. Pharmaceutical Desiccants Market Restraints & Challenges
- 3.4 U.S. Pharmaceutical Desiccants Market Opportunities
- 3.5 Porter's Five Forces Analysis
- 3.5.1 Threat of New Entrants
- 3.5.2 Bargaining Power of Suppliers
- 3.5.3 Bargaining Power of Buyers
- 3.5.4 Threat of Substitutes
- 3.5.5 Competitive Rivalry – Intensity Assessment
- 3.6 U.S. Pharmaceutical Desiccants Value Chain Analysis
- 3.6.1 Upstream – Raw Material/Input Suppliers
- 3.6.1.1 Raw Material/Input 1
- 3.6.1.2 Raw Material/Input 2
- 3.6.1.3 Raw Material/Input 3
- 3.6.2 Midstream – Production/Manufacturing/Service Delivery
- 3.6.2.1 Production/Process Overview
- 3.6.2.2 Key Facility Locations & Capacity by Manufacturer
- 3.6.3 Downstream – Distribution & End Consumer
- 3.6.3.1 Primary Channel – B2B/OEM
- 3.6.3.2 Secondary Channels – Dealer, Retail, Online, Direct
- 3.6.4 Value Chain Profitability Analysis
- 3.6.1 Upstream – Raw Material/Input Suppliers
- 3.7 PESTEL Analysis
- 3.7.1 Political Factors
- 3.7.2 Economic Factors
- 3.7.3 Social Factors
- 3.7.4 Technological Factors
- 3.7.5 Environmental Factors
- 3.7.6 Legal Factors
- 3.8 U.S. Pharmaceutical Desiccants Supply Chain Analysis
- 3.8.1 Raw Material/Input Supply Risk Assessment
- 3.8.2 Manufacturing Concentration Risk (Geographic Exposure)
- 3.8.3 Trade Disruption Impact Analysis
- 3.9 Regulatory & Policy Landscape
Note: The regulatory and policy landscape section covers regulations based on their applicability to the market, U.S. Pharmaceutical Desiccants category, geography, and scope of the study. Only regulatory frameworks with a material impact on operations, compliance, trade, sustainability, or market access are analyzed in detail.
Chapter 4. Key Investment Pockets & Opportunity Analysis
- 4.1 U.S. Pharmaceutical Desiccants Market Attractiveness Analysis
- 4.1.1 By Region – Investment Attractiveness Matrix (Volume × CAGR)
- 4.2 Absolute Revenue Growth Opportunity
- 4.2.1 By Region – Absolute USD Growth Through 2032
- 4.3 Incremental Volume Opportunity
- 4.3.1 By Region – Incremental Volume Through 2032
- 4.3.2 Segment – Incremental Volume
- 4.4 Emerging Submarket Opportunity Deep Dive (Subject to Applicability)
- 4.5 Emerging Market Opportunity Scorecards
- 4.5.1 United States
- 4.5.2 Europe
- 4.5.3 Asia
- 4.5.4 Middle East & Africa
Note: Emerging Market Opportunity Scorecards will be included based on relevance and strategic importance. Regions listed are indicative and may vary depending on data availability and market dynamics.
Chapter 5. U.S. Pharmaceutical Desiccants Import-Export Analysis & Trade Flows
- 5.1 Global Trade Overview
- 5.1.1 Global Export Value by Country (2024)
- 5.1.2 Global Export Volume by Country (2024)
- 5.1.3 Global Import Value by Country (2024)
- 5.1.4 Global Import Volume by Country (2024)
- 5.1.5 Net Trade Balance by Country (2024)
- 5.2 Export Analysis – Segment
- 5.2.1 Type 1 (HS Code)
- 5.2.2 Type 2 (HS Code)
- 5.2.3 Type 3 (HS Code)
- 5.2.4 Type 4 (HS Code)
- 5.2.5 Type 5 (HS Code)
- 5.3 Import Analysis – Segment
- 5.3.1 Type 1 (HS Code)
- 5.3.2 Type 2 (HS Code)
- 5.3.3 Type 3 (HS Code)
- 5.3.4 Type 4 (HS Code)
- 5.3.5 Type 5 (HS Code)
- 5.4 Average Unit Trade Prices
- 5.4.1 Average Export Price – Segment & Country
- 5.4.2 Average Import Price – Segment & Source Country
- 5.4.3 Price Trends (2024)
- 5.5 Key Trade Route Analysis
- 5.5.1 Trade Route 1
- 5.5.2 Trade Route 2
- 5.5.3 Trade Route 3
- 5.5.4 Trade Route 4
- 5.5.5 Trade Route 5
- 5.6 Trade Policy Impact Assessment
- 5.6.1 US Anti-Dumping & Section 301 Tariffs
- 5.6.2 EU Customs Union Impact
- 5.6.3 Major Free Trade Agreements
- 5.6.4 USMCA Rules of Origin
Note: Trade policy analysis will be included only where relevant to the U.S. Pharmaceutical Desiccants market.
Chapter 6. Competitive Landscape & Company Benchmarking
- 6.1 U.S. Pharmaceutical Desiccants Market Concentration & Structure
- 6.1.1 Herfindahl-Hirschman Index (HHI) – vs. 2024
- 6.1.2 Tier 1, Tier 2 & Tier 3 Market Structure
- 6.1.3 Global, Regional & Local Player Dynamics
- 6.2 U.S. Pharmaceutical Desiccants Market Share Analysis – 2024
- 6.2.1 Global Revenue Share by Company
- 6.2.2 Global Volume Share by Company
- 6.2.3 Regional Revenue Share
- 6.2.4 Market Share Evolution ( vs. 2024)
- 6.2.5 OEM Segment Share by Company
- 6.2.6 Replacement Segment Share by Company
- 6.3 Production/Delivery Capacity & Facility Analysis
- 6.3.1 Global Installed Capacity
- 6.3.2 Capacity Utilization Rates
- 6.3.3 Production/Output Volume
- 6.3.4 Facility Locations & Capacity Map
- 6.3.5 Planned Capacity Additions
- 6.4 U.S. Pharmaceutical Desiccants Competitive Benchmarking Matrix
- 6.4.1 Revenue, Volume, CAGR & Profitability Comparison
- 6.4.2 Channel Revenue Mix
- 6.4.3 Geographic Revenue Exposure
- 6.4.4 R&D Intensity
- 6.4.5 Sustainability Maturity
- 6.5 Strategic Developments in U.S. Pharmaceutical Desiccants (Last 24 Months)
- 6.5.1 Mergers, Acquisitions & Divestments
- 6.5.2 New U.S. Pharmaceutical Desiccants Launches
- 6.5.3 Facility Expansions
- 6.5.4 Strategic Alliances, Joint Ventures & Partnerships
- 6.5.5 Distribution Expansion & Market Entry
- 6.5.6 Sustainability & ESG Initiatives
- 6.6 Competitive Strategy Mapping
- 6.6.1 Leader, Challenger, Follower & Niche Classification
- 6.6.2 Pricing Strategy Comparison
- 6.6.3 Channel Strategy Matrix
Note: Strategic developments are included based on their materiality and the availability of reliable information.
Chapter 7. Global U.S. Pharmaceutical Desiccants Market – By Distribution Channel
- 7.1 Segment Overview
- 7.1.1 Volume & Revenue Split by Channel (2024 & 2032)
- 7.1.2 Channel Mix Evolution (2024-2032)
Chapter 8. Regional Market Analysis – Global Overview
- 8.1 Global Regional Overview
- 8.1.1 Regional Volume Share
- 8.1.2 Regional Revenue Share
- 8.1.3 Regional Volume by Region
- 8.1.4 Regional Revenue by Region
- 8.1.5 Regional Forecast Through 2032
- 8.2 Cross-Regional Segment Analysis
- 8.2.1 By Distribution Channel
- 8.2.2 By Brand/Price Tier
Chapter 9. North America U.S. Pharmaceutical Desiccants Market
- 9.1 United States
- 9.2 Canada
- 9.3 Mexico
Chapter 10. Europe U.S. Pharmaceutical Desiccants Market
- 10.1 Germany
- 10.2 France
- 10.3 Italy
- 10.4 United Kingdom
- 10.5 Spain
- 10.6 Poland
- 10.7 Russia
- 10.8 Netherlands
- 10.9 Belgium
- 10.10 Sweden
- 10.11 Denmark
- 10.12 Norway
- 10.13 Rest of Europe
Chapter 11. Asia Pacific U.S. Pharmaceutical Desiccants Market
- 11.1 China
- 11.2 India
- 11.3 Japan
- 11.4 South Korea
- 11.5 Thailand
- 11.6 Indonesia
- 11.7 Vietnam
- 11.8 Malaysia
- 11.9 Australia
- 11.10 Rest of Asia Pacific
Chapter 12. Latin America U.S. Pharmaceutical Desiccants Market
- 12.1 Brazil
- 12.2 Argentina
- 12.3 Colombia
- 12.4 Chile
- 12.5 Rest of Latin America
Chapter 13. Middle East U.S. Pharmaceutical Desiccants Market
- 13.1 Saudi Arabia
- 13.2 United Arab Emirates
- 13.3 Turkey
- 13.4 Israel
- 13.5 Iran
- 13.6 Rest of the Middle East
Chapter 14. Africa U.S. Pharmaceutical Desiccants Market
- 14.1 South Africa
- 14.2 Egypt
- 14.3 Nigeria
- 14.4 Morocco
- 14.5 Rest of Africa
Chapter 15. U.S. Pharmaceutical Desiccants Company Profiles
- 15.1 [Company 01]
- 15.1.1 Company Overview
- 15.1.2 Key Management Personnel
- 15.1.3 Products & Services Portfolio
- 15.1.4 Financial Performance
- 15.1.5 Key Market Focus & Geographic Presence
- 15.1.6 Recent Developments & Strategic Initiatives
Note: The company profile list is preliminary and may change based on research findings, market developments, data availability, and client requirements.
Chapter 16. Appendices
- Appendix A – List of Abbreviations & Acronyms
- Appendix B – Industry Classification Code Reference – Full Series
- Appendix C – Production & Capacity Data Tables
- Appendix D – End-Use & Demand Base Tables
- Appendix E – Consumption & Replacement Rate Assumptions
- Appendix F – ASP Reference Tables
- Appendix G – Manufacturing & Facility Database
- Appendix H – Import-Export Data Tables
- Appendix I – Regulatory Summary Tables
- Appendix J – Primary Research Participant List (Anonymized)
- Appendix K – Primary Research Questionnaire Framework
- Appendix L – Data Sources & Bibliography
- Appendix M – Market Size Divergence & Source Comparison
Chapter 17. Research Methodology
- 17.1 Research Framework & Philosophy
- 17.2 Secondary Research – Sources, Hierarchy & Data Extraction
- 17.3 Data Modeling – Bottom-Up & Top-Down Market Sizing
- 17.4 Primary Research – Stakeholder Framework, LOI & Sample Sizes
- 17.5 Forecast Methodology – Regression, Scenario & Sensitivity Analysis
- 17.6 Quality Control – Four-Layer Validation Framework
- 17.7 Limitations & Standard Assumptions
- 17.8 Disclaimer
