
Market Overview:
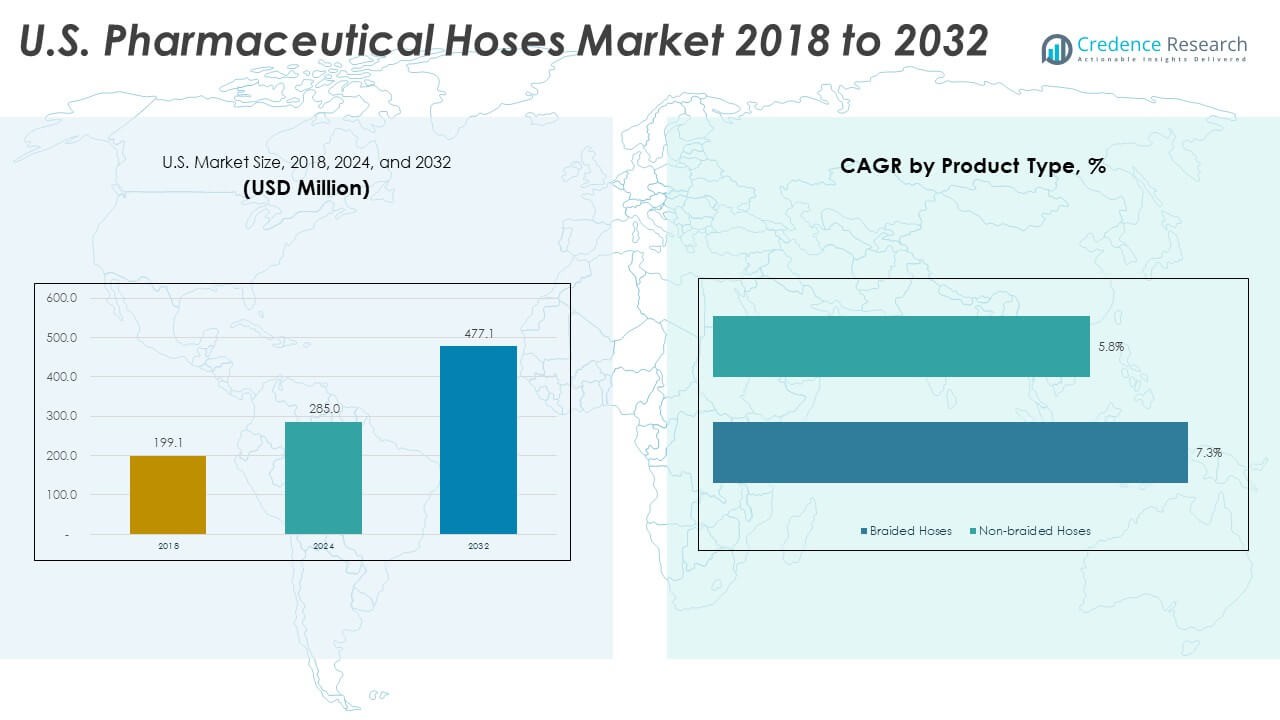
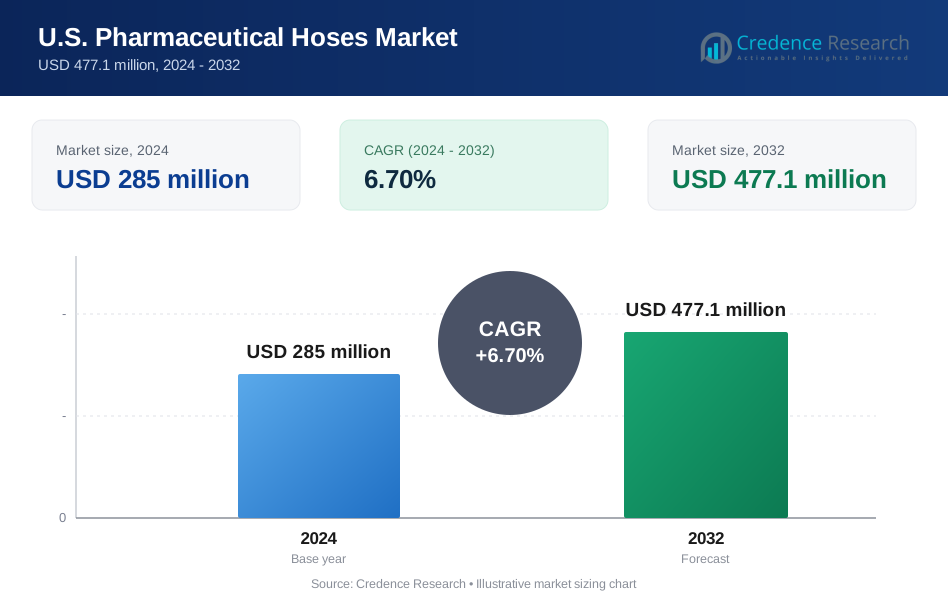
The U.S. Pharmaceutical Hoses Market size was valued at USD 199.1 million in 2018 to USD 285 million in 2024 and is anticipated to reach USD 477.1 million by 2032, at a CAGR of 6.70% during the forecast period. Growth reflects rising demand for safe transfer systems. Strict quality rules guide material choices across key plants.
| REPORT ATTRIBUTE | DETAILS |
|---|---|
| Historical Period | 2020-2023 |
| Base Year | 2024 |
| Forecast Period | 2025-2032 |
| U.S. Pharmaceutical Hoses Market Size 2024 | USD 285 Million |
| U.S. Pharmaceutical Hoses Market, CAGR | 6.70% |
| U.S. Pharmaceutical Hoses Market Size 2032 | USD 477.1 Million |
Strong drivers include rising production of sterile drugs and biologics. Pharma plants prefer hoses that handle pressure, temperature, and chemical stress. Safety rules push wider use of certified materials that reduce contamination risks.
Regional demand remains strongest in the United States due to advanced pharma hubs. Leading states hold large drug-manufacturing networks and strict compliance needs. Emerging growth appears in expanding biotech clusters supported by new facilities.
Market Insights:
- The S. Pharmaceutical Hoses Market was valued at USD 199.1 million in 2018, reached USD 285 million in 2024, and is projected to hit USD 477.07 million by 2032, advancing at a 6.70% CAGR driven by stricter purity rules and expanding biologics output.
- North America holds 78%, driven by strong drug-manufacturing hubs and strict regulatory oversight; Europe follows with 15% due to established pharma clusters; Asia-Pacific accounts for 7% supported by modernizing sterile-processing infrastructure.
- Asia-Pacific is the fastest-growing region with a 7% share, supported by rising contract manufacturing, rapid biologics expansion, and growing compliance alignment with U.S. and EU standards.
- Fluid Transfer dominates segment share in the image, showing the highest contribution across all years due to its central role in sterile drug movement.
- Bioreactors rank second in share, reflecting growing biologics production and higher adoption of reinforced hoses for upstream processing.
Market Drivers:
Growing Use of High-Purity Materials Across Critical Drug Production
Demand rises in the U.S. Pharmaceutical Hoses Market due to fast expansion of sterile and high-potency drug output. Manufacturers prefer hoses that handle harsh cleaning cycles without losing structural integrity. Drug plants adopt PTFE and silicone hoses to keep purity during fluid transfer. Rising injectable production strengthens installation of certified tubing across key lines. Biologics facilities push more spending on hoses with smooth bore surfaces that limit particle shedding. Safety rules drive interest in hoses that deliver chemical resistance and stable flow. It supports better contamination control across sensitive drug batches. Strong adoption across new production sites keeps momentum steady.
- For instance, Saint-Gobain’s Sani-Tech® STHT®-C silicone tubing withstands repeated autoclaving and tolerates intermittent high temperatures up to 260°C (500°F), supporting high-purity operations that need repeated sterilization-in-place (SIP) cycles.
Rising Regulatory Pressure for Contamination-Free Transfer Systems
Regulators demand cleaner equipment that prevents microbial or particulate exposure. Plants upgrade hose assemblies that comply with USP-Class VI and FDA standards. Manufacturers introduce reinforced hoses that tolerate vacuum stress during media transfer. Growth in continuous manufacturing strengthens interest in durable fluid-handling components. Drug processors choose hoses with documented traceability for every batch. Interest in validated equipment increases procurement of premium-grade hoses. It supports stronger compliance culture across production floors. Rising inspections push plants to replace outdated equipment quickly.
- For instance, AdvantaPure's AdvantaFlex® TPE tubing is compatible with gamma sterilization and is available with a validated sterility assurance of 10⁻⁶ via a single gamma irradiation cycle, per ISO 11137 method VDmax 25.
Expansion of Fill-Finish Infrastructure Across Pharma and Biotech
Fill-finish units depend on hoses that maintain pressure stability during high-speed operations. Producers scale investment in sterile transfer systems to support complex formulations. Growth in vaccine production encourages adoption of temperature-stable hoses. New biologic lines need hoses with tight bend radius control for compact layouts. High-volume packaging areas rely on hoses that perform under frequent washdowns. It reinforces strong demand within regulated facilities. Contract manufacturers purchase advanced hoses to meet global quality needs. Industry expansion keeps procurement levels high.
Increasing Shift Toward Automation and High-Throughput Processing
Automation raises the need for hoses that support consistent flow under repetitive cycles. Smart plants deploy assemblies that integrate with automated monitoring tools. Strong push toward batch uniformity lifts demand for performance-tested hoses. Drug makers prefer hoses with stable flex durability for robotic transfer arms. High-throughput lines require hoses that minimize turbulence during rapid movement. It improves production stability across wider drug portfolios. Technology upgrades drive frequent hose replacement cycles. Automated plants increase installation volume across multiple stages.
Market Trends:
Shift Toward Single-Use Hose Assemblies in Bioprocessing Environments
Single-use adoption grows across biotech plants that handle sensitive cell-based products. Firms choose pre-sterilized hose sets that lower cleaning needs and downtime. Rising biologic production encourages movement toward disposable transfer pathways. Plants see value in quicker changeover cycles that boost operational flexibility. Suppliers introduce gamma-stable hoses to meet sterilization requirements. It supports broader use across pilot and commercial batches. Interest in single-use skids expands the market footprint. Flexible design options improve compatibility across equipment.
- For instance, Watson-Marlow’s PureWeld® XL tubing delivers a service life up to 7 times longer than standard weldable tubing in flex-fatigue tests, strengthening adoption in single-use systems.
Integration of Smart Monitoring Features in Fluid-Handling Systems
Producers adopt hoses equipped with embedded sensors for pressure and temperature tracking. Smart units send alerts when stress levels rise beyond safe limits. Firms seek predictive-maintenance tools that reduce unplanned downtime. Hose manufacturers develop systems that record performance data for audits. Digital tracking supports stronger risk-management frameworks. It improves traceability across regulated plants. Automation partners integrate smart hoses into advanced control systems. Tech-enabled upgrades strengthen value for long-term users.
- For instance, GORE® STA-PURE® Series PCS tubing uses a unique composite structure of silicone in an expanded polytetrafluoroethylene (ePTFE) lattice, offering high purity and durability. This tubing maintains structural integrity under pressures up to 100 psi (pounds per square inch) and is designed for use in peristaltic pumps found in automated bioprocess equipment.
Growing Preference for High-Performance Polymer Blends for Extreme Conditions
Producers look for hoses that deliver stability under wide thermal ranges. Polymer innovation supports growth of chemical-resistant and flame-resistant grades. Biotech plants adopt hoses that hold integrity during solvent exposure. Firms choose multilayer designs that manage pulsation and high pressure. Material advances boost durability under repeated flex cycles. It promotes wider use across upstream and downstream workflows. Manufacturers push R&D toward hybrid designs with reinforced structure. High-performance materials reshape product selection patterns.
Rise of Custom-Engineered Hose Systems Tailored to Specialized Drug Lines
Drug makers request custom lengths, fittings, and reinforcement strength for niche operations. Specialty formulations need hoses with defined flow characteristics. Producers offer engineered solutions aligned with plant layouts. Growth in advanced therapy lines drives custom requests. Firms use tailored hoses to meet strict stability and purity goals. It improves operational compatibility across varied equipment settings. Custom engineering supports faster installation cycles. Demand rises across high-mix, low-volume operations.
Market Challenges Analysis:
High Compliance Burden and Frequent Replacement Needs Across Regulated Plants
The U.S. Pharmaceutical Hoses Market faces strict compliance rules that increase operational pressure. Plants must replace hoses often to meet safety requirements. Frequent validation adds cost burdens for large production sites. High testing demands extend procurement timelines for new systems. It forces firms to maintain heavy inventories to avoid workflow delays. Complex drug lines need more documentation for each hose batch. Regulatory shifts push manufacturers to update designs. Cleaning rules create rapid wear on hose assemblies.
Harsh Processing Environments and Limited Compatibility With New Formulations
Biologic and high-solvent formulations create stress that damages standard hoses. Plants struggle with compatibility as new drug types expand. High heat and repeated sterilization cycles reduce hose lifespan. It limits long-term stability across high-output plants. Firms face risk of flow disruptions due to frequent failures. Custom materials cost more and raise procurement challenges. Damage risks increase in fully automated lines. Complex setups make troubleshooting more difficult.
Market Opportunities:
Rising Expansion of Biotech Clusters and High-Purity Processing Facilities
Opportunities strengthen in the U.S. Pharmaceutical Hoses Market with rapid growth of biologics hubs. New facilities need high-purity assemblies for sterile media transfer. Drug makers upgrade older sites that lack modern fluid-handling capacity. It supports broader installation of premium hoses across new and legacy plants. Growth in cell-therapy and gene-therapy lines boosts long-term adoption. Procurement teams shift toward certified hoses that reduce contamination risk. Expansion of cleanroom infrastructure opens fresh supply opportunities. Emerging players benefit from rising contract-manufacturing demand.
Increasing Demand for Advanced Materials, Smart Features, and Custom Configurations
Producers explore new materials that enhance strength and flow stability. Interest grows in hoses with embedded monitoring for real-time alerts. Custom configurations attract buyers with unique layout needs. It leads to more specialized designs in regulated facilities. Technology suppliers offer integrated solutions that streamline fluid control. High-purity polymer development supports broader innovation. Adoption expands in high-mix drug portfolios. Suppliers gain long-term traction with tailored solutions.
Market Segmentation Analysis:
By Product Type
The U.S. Pharmaceutical Hoses Market divides into braided hoses and non-braided hoses. Braided hoses lead due to strong reinforcement that supports pressure stability in sterile drug processes. They suit high-performance transfer tasks where durability matters. Non-braided hoses gain traction in flexible setups that require easy handling. These options support low-pressure transfer lines and general-use operations. Demand shifts toward products that maintain purity while meeting compliance needs. It strengthens product selection across varied production environments.
- For instance, Titeflex’s PTFE braided hoses handle pressures above 2,000 psi depending on size, supporting high-demand pharmaceutical transfer needs.
By Application
Key applications include fluid transfer, bioreactors, sterilization, and other operational tasks. Fluid transfer dominates due to its central role in drug manufacturing. Bioreactors need hoses with chemical resistance and stable flow performance. Sterilization workflows rely on heat-tolerant hoses that withstand repeated cycles. Other applications support cleaning, media handling, and ancillary systems. Growth aligns with expanding biologics production across regulated facilities. It increases hose demand across upstream and downstream stages.
- For instance, Gore® High-Purity PTFE hoses maintain permeability rates near zero under bioreactor conditions, enabling stable flow and protecting sensitive media.
By Material
Material segmentation covers silicone hoses, PTFE hoses, and other polymers. Silicone remains preferred for purity, flexibility, and thermal stability. PTFE offers strong chemical resistance that supports aggressive processing needs. Other materials serve niche requirements across varied drug lines. Plants choose materials based on durability, flow stability, and regulatory fit. It drives continuous upgrades in high-performance polymer design.
By End User
End users include pharmaceutical companies, biotechnology firms, contract manufacturers, and others. Pharmaceutical companies lead due to high output and strict compliance norms. Biotechnology companies adopt advanced hoses for biologic and cell-based workflows. Contract manufacturers expand usage to support multi-client operations. Other users include research labs and pilot-scale facilities. It reflects wide adoption across different processing intensities.
Segmentation:
By Product Type
- Braided Hoses
- Non-braided Hoses
By Application
- Fluid Transfer
- Bioreactors
- Sterilization
- Others
By Material
- Silicone Hoses
- Polytetrafluoroethylene (PTFE) Hoses
- Others
By End User
- Pharmaceutical Companies
- Biotechnology Companies
- Contract Manufacturers
- Others
Regional Analysis:
North America Leadership
The U.S. Pharmaceutical Hoses Market holds the dominant share in North America, accounting for nearly 78% of the regional demand due to its strong pharmaceutical manufacturing base and strict quality regulations. Major drug producers invest in high-purity hose systems that support sterile processing and biologic workflows. Large biotech clusters in states such as Massachusetts and California strengthen procurement volumes across upstream and downstream operations. Contract manufacturers in the region adopt advanced hose assemblies to meet varied formulation needs. Strong regulatory enforcement encourages frequent equipment upgrades. It supports continued adoption across new and existing production sites.
Europe’s Steady Growth Path
Europe accounts for around 15% of the total demand due to established drug manufacturing facilities in Germany, Switzerland, France, and the U.K. The region invests in high-performance hose materials that support complex formulations and temperature-sensitive workflows. Biotech expansion in Western Europe drives higher use of hoses that withstand rapid sterilization cycles. Pharmaceutical companies in the EU follow strict documentation requirements, which influence product selection and traceability standards. Contract manufacturers across Belgium, Ireland, and Italy support steady orders. It maintains long-term purchasing cycles across regulated environments.
Asia-Pacific’s Emerging Potential
Asia-Pacific holds nearly 7% of the market and shows the fastest growth due to rising investments in biologics and sterile injectable facilities. Countries such as China, India, South Korea, and Singapore expand high-purity production lines that rely on advanced hose systems. Local plants upgrade infrastructure to meet international compliance norms, pushing demand for certified materials. Rising contract manufacturing activity increases procurement of hoses suited for multiproduct facilities. Regional supply chains improve as global players partner with local producers. It unlocks broader adoption across early-stage and large-scale units.
Key Player Analysis:
- Western Rubbers
- Exactseal Inc.
- Flexotech
- Brigade Group
- MTG Pharma
- Kuriyama of America, Inc.
- Italprotec
- Casella Process Solutions
- Titeflex
- Other Key Players
Competitive Analysis:
The U.S. Pharmaceutical Hoses Market features a mix of established manufacturers and specialized suppliers that compete on product purity, certification standards, and durability. Leading players strengthen their positions through advanced material engineering and expanded hose portfolios tailored for sterile processes. Firms invest in high-purity silicone, PTFE, and reinforced hose lines that align with strict compliance needs. Contract manufacturers seek scalable solutions, which drives demand for validated assemblies. Competition intensifies as companies upgrade designs to support biologics and high-potency workflows. It encourages continuous R&D activity focused on stronger chemical resistance and improved lifecycle performance. Industry focus on customization further shapes competitive advantage across major brands.
Recent Developments:
- In November 2025, Exact Sciences. was the subject of a major acquisition deal when Abbott announced a definitive agreement to acquire Exact Sciences for approximately $21 billion. The acquisition, expected to close in the second quarter of 2026, is poised to accelerate innovation and expand access to advanced diagnostics and precision oncology products, further enhancing the companies’ reach in the U.S. healthcare and pharmaceutical sectors.
- In Brigade Group, July and September 2025 marked a series of strategic joint development agreements, especially in India’s real estate sector, but there have been no partnerships or product launches directly relevant to the U.S. pharmaceutical hoses space identified for this period.
Report Coverage:
The research report offers an in-depth analysis based on product type, application, material, and end-user segments. It details leading market players, providing an overview of their business, product offerings, investments, revenue streams, and key applications. Additionally, the report includes insights into the competitive environment, SWOT analysis, current market trends, as well as the primary drivers and constraints. Furthermore, it discusses various factors that have driven market expansion in recent years. The report also explores market dynamics, regulatory scenarios, and technological advancements that are shaping the industry. It assesses the impact of external factors and global economic changes on market growth. Lastly, it provides strategic recommendations for new entrants and established companies to navigate the complexities of the market.
Future Outlook:
- Demand will rise with growing biologics production and expanding sterile workflows across drug plants.
- Adoption of high-purity hose materials will gain momentum due to strict safety rules.
- Single-use hose systems will grow as facilities focus on faster changeovers.
- Smart monitoring features will enter advanced production environments.
- Custom-engineered hose assemblies will support complex facility layouts.
- Contract manufacturers will increase procurement to meet multiproduct needs.
- New drug lines will push suppliers to create stronger chemical-resistant designs.
- Regional biotech clusters will drive fresh installation cycles.
- Sustainability programs will influence material development and replacement cycles.
- Industry digitalization will shape long-term sourcing and maintenance patterns.
Request a Free Sample
Fill in your details and we'll send you a free sample report.
- Sample data tables & charts
- Research methodology
Need a Custom Version of This Report?
Tailor the scope, geography, or segments to your exact requirements.
- Custom geography or segment scope
- Direct access to our analyst team
Frequently Asked Questions
What is the current market size for the U.S. Pharmaceutical Hoses Market, and what is its projected size in 2032?
At what Compound Annual Growth Rate is the U.S. Pharmaceutical Hoses Market projected to grow between 2024 and 2032?
Which U.S. Pharmaceutical Hoses Market segment held the largest share in 2024?
What are the primary factors fueling the growth of the U.S. Pharmaceutical Hoses Market?
Who are the leading companies in the U.S. Pharmaceutical Hoses Market?
Which region commanded the largest share of the U.S. Pharmaceutical Hoses Market in 2024?
Table of Content
Chapter 1. Report Introduction
- 1.1 Report Description & Purpose
- 1.1.1 Report Title & Market Definition
- 1.1.2 Unique Selling Propositions (USP) & Key Differentiators
- 1.1.3 Value Proposition for Stakeholders
- 1.2 Research Objectives
- 1.2.1 Market Sizing Objectives (Volume & Revenue)
- 1.2.2 Segmentation Objectives
- 1.2.3 Competitive Intelligence Objectives
- 1.2.4 Forecast & Scenario Objectives
- 1.3 Report Scope
- 1.3.1 U.S. Pharmaceutical Hoses Scope – Types & Subtypes Covered
- 1.3.2 Geographic Scope – Regions & Countries Covered
- 1.3.3 Historical Period, Base Year & Forecast Period (2024; forecast to 2032)
- 1.3.4 Inclusions & Exclusions
- 1.4 HS Code & Classification Framework
- 1.5 Currency, Units & Pricing Basis
- 1.6 Target Stakeholders
- 1.7 Limitations & Assumptions
Chapter 2. Executive Summary
- 2.1 Global U.S. Pharmaceutical Hoses Market Snapshot
- 2.1.1 Market Size – Historical (2024) & Forecast (2024-2032) (2024: USD 285 million → 2032: USD 477.1 million)
- 2.1.2 Volume & Revenue – Global Totals
- 2.1.3 Key Market Highlights – Top Five Facts
- 2.2 U.S. Pharmaceutical Hoses Market Segmentation Snapshot
- 2.2.1 Market Split by Region – 2024 vs. 2032
- 2.3 Competitive Snapshot
- 2.3.1 Top 10 Players by Revenue Share – 2024
- 2.3.2 Top 10 Players by Volume Share – 2024
- 2.3.3 Recent Strategic Developments (18-Month Summary)
- 2.4 Key Investment Highlights & Strategic Conclusions
Chapter 3. U.S. Pharmaceutical Hoses Market Dynamics & Industry Analysis
- 3.1 Market Overview & Context
- 3.1.1 U.S. Pharmaceutical Hoses Market Position in the Broader Automotive Value Chain
- 3.1.2 OEM vs. Replacement Market Dynamics
- 3.1.3 Market Maturity & Development Stage by Region
- 3.2 U.S. Pharmaceutical Hoses Market Drivers
- 3.3 U.S. Pharmaceutical Hoses Market Restraints & Challenges
- 3.4 U.S. Pharmaceutical Hoses Market Opportunities
- 3.5 Porter's Five Forces Analysis
- 3.5.1 Threat of New Entrants
- 3.5.2 Bargaining Power of Suppliers
- 3.5.3 Bargaining Power of Buyers
- 3.5.4 Threat of Substitutes
- 3.5.5 Competitive Rivalry – Intensity Assessment
- 3.6 U.S. Pharmaceutical Hoses Value Chain Analysis
- 3.6.1 Upstream – Raw Material/Input Suppliers
- 3.6.1.1 Raw Material/Input 1
- 3.6.1.2 Raw Material/Input 2
- 3.6.1.3 Raw Material/Input 3
- 3.6.2 Midstream – Production/Manufacturing/Service Delivery
- 3.6.2.1 Production/Process Overview
- 3.6.2.2 Key Facility Locations & Capacity by Manufacturer
- 3.6.3 Downstream – Distribution & End Consumer
- 3.6.3.1 Primary Channel – B2B/OEM
- 3.6.3.2 Secondary Channels – Dealer, Retail, Online, Direct
- 3.6.4 Value Chain Profitability Analysis
- 3.6.1 Upstream – Raw Material/Input Suppliers
- 3.7 PESTEL Analysis
- 3.7.1 Political Factors
- 3.7.2 Economic Factors
- 3.7.3 Social Factors
- 3.7.4 Technological Factors
- 3.7.5 Environmental Factors
- 3.7.6 Legal Factors
- 3.8 U.S. Pharmaceutical Hoses Supply Chain Analysis
- 3.8.1 Raw Material/Input Supply Risk Assessment
- 3.8.2 Manufacturing Concentration Risk (Geographic Exposure)
- 3.8.3 Trade Disruption Impact Analysis
- 3.9 Regulatory & Policy Landscape
Note: The regulatory and policy landscape section covers regulations based on their applicability to the market, U.S. Pharmaceutical Hoses category, geography, and scope of the study. Only regulatory frameworks with a material impact on operations, compliance, trade, sustainability, or market access are analyzed in detail.
Chapter 4. Key Investment Pockets & Opportunity Analysis
- 4.1 U.S. Pharmaceutical Hoses Market Attractiveness Analysis
- 4.1.1 By Region – Investment Attractiveness Matrix (Volume × CAGR)
- 4.2 Absolute Revenue Growth Opportunity
- 4.2.1 By Region – Absolute USD Growth Through 2032
- 4.3 Incremental Volume Opportunity
- 4.3.1 By Region – Incremental Volume Through 2032
- 4.3.2 Segment – Incremental Volume
- 4.4 Emerging Submarket Opportunity Deep Dive (Subject to Applicability)
- 4.5 Emerging Market Opportunity Scorecards
- 4.5.1 United States
- 4.5.2 Europe
- 4.5.3 Asia
- 4.5.4 Middle East & Africa
Note: Emerging Market Opportunity Scorecards will be included based on relevance and strategic importance. Regions listed are indicative and may vary depending on data availability and market dynamics.
Chapter 5. U.S. Pharmaceutical Hoses Import-Export Analysis & Trade Flows
- 5.1 Global Trade Overview
- 5.1.1 Global Export Value by Country (2024)
- 5.1.2 Global Export Volume by Country (2024)
- 5.1.3 Global Import Value by Country (2024)
- 5.1.4 Global Import Volume by Country (2024)
- 5.1.5 Net Trade Balance by Country (2024)
- 5.2 Export Analysis – Segment
- 5.2.1 Type 1 (HS Code)
- 5.2.2 Type 2 (HS Code)
- 5.2.3 Type 3 (HS Code)
- 5.2.4 Type 4 (HS Code)
- 5.2.5 Type 5 (HS Code)
- 5.3 Import Analysis – Segment
- 5.3.1 Type 1 (HS Code)
- 5.3.2 Type 2 (HS Code)
- 5.3.3 Type 3 (HS Code)
- 5.3.4 Type 4 (HS Code)
- 5.3.5 Type 5 (HS Code)
- 5.4 Average Unit Trade Prices
- 5.4.1 Average Export Price – Segment & Country
- 5.4.2 Average Import Price – Segment & Source Country
- 5.4.3 Price Trends (2024)
- 5.5 Key Trade Route Analysis
- 5.5.1 Trade Route 1
- 5.5.2 Trade Route 2
- 5.5.3 Trade Route 3
- 5.5.4 Trade Route 4
- 5.5.5 Trade Route 5
- 5.6 Trade Policy Impact Assessment
- 5.6.1 US Anti-Dumping & Section 301 Tariffs
- 5.6.2 EU Customs Union Impact
- 5.6.3 Major Free Trade Agreements
- 5.6.4 USMCA Rules of Origin
Note: Trade policy analysis will be included only where relevant to the U.S. Pharmaceutical Hoses market.
Chapter 6. Competitive Landscape & Company Benchmarking
- 6.1 U.S. Pharmaceutical Hoses Market Concentration & Structure
- 6.1.1 Herfindahl-Hirschman Index (HHI) – vs. 2024
- 6.1.2 Tier 1, Tier 2 & Tier 3 Market Structure
- 6.1.3 Global, Regional & Local Player Dynamics
- 6.2 U.S. Pharmaceutical Hoses Market Share Analysis – 2024
- 6.2.1 Global Revenue Share by Company
- 6.2.2 Global Volume Share by Company
- 6.2.3 Regional Revenue Share
- 6.2.4 Market Share Evolution ( vs. 2024)
- 6.2.5 OEM Segment Share by Company
- 6.2.6 Replacement Segment Share by Company
- 6.3 Production/Delivery Capacity & Facility Analysis
- 6.3.1 Global Installed Capacity
- 6.3.2 Capacity Utilization Rates
- 6.3.3 Production/Output Volume
- 6.3.4 Facility Locations & Capacity Map
- 6.3.5 Planned Capacity Additions
- 6.4 U.S. Pharmaceutical Hoses Competitive Benchmarking Matrix
- 6.4.1 Revenue, Volume, CAGR & Profitability Comparison
- 6.4.2 Channel Revenue Mix
- 6.4.3 Geographic Revenue Exposure
- 6.4.4 R&D Intensity
- 6.4.5 Sustainability Maturity
- 6.5 Strategic Developments in U.S. Pharmaceutical Hoses (Last 24 Months)
- 6.5.1 Mergers, Acquisitions & Divestments
- 6.5.2 New U.S. Pharmaceutical Hoses Launches
- 6.5.3 Facility Expansions
- 6.5.4 Strategic Alliances, Joint Ventures & Partnerships
- 6.5.5 Distribution Expansion & Market Entry
- 6.5.6 Sustainability & ESG Initiatives
- 6.6 Competitive Strategy Mapping
- 6.6.1 Leader, Challenger, Follower & Niche Classification
- 6.6.2 Pricing Strategy Comparison
- 6.6.3 Channel Strategy Matrix
Note: Strategic developments are included based on their materiality and the availability of reliable information.
Chapter 7. Global U.S. Pharmaceutical Hoses Market – By Distribution Channel
- 7.1 Segment Overview
- 7.1.1 Volume & Revenue Split by Channel (2024 & 2032)
- 7.1.2 Channel Mix Evolution (2024-2032)
Chapter 8. Regional Market Analysis – Global Overview
- 8.1 Global Regional Overview
- 8.1.1 Regional Volume Share
- 8.1.2 Regional Revenue Share
- 8.1.3 Regional Volume by Region
- 8.1.4 Regional Revenue by Region
- 8.1.5 Regional Forecast Through 2032
- 8.2 Cross-Regional Segment Analysis
- 8.2.1 By Distribution Channel
- 8.2.2 By Brand/Price Tier
Chapter 9. North America U.S. Pharmaceutical Hoses Market
- 9.1 United States
- 9.2 Canada
- 9.3 Mexico
Chapter 10. Europe U.S. Pharmaceutical Hoses Market
- 10.1 Germany
- 10.2 France
- 10.3 Italy
- 10.4 United Kingdom
- 10.5 Spain
- 10.6 Poland
- 10.7 Russia
- 10.8 Netherlands
- 10.9 Belgium
- 10.10 Sweden
- 10.11 Denmark
- 10.12 Norway
- 10.13 Rest of Europe
Chapter 11. Asia Pacific U.S. Pharmaceutical Hoses Market
- 11.1 China
- 11.2 India
- 11.3 Japan
- 11.4 South Korea
- 11.5 Thailand
- 11.6 Indonesia
- 11.7 Vietnam
- 11.8 Malaysia
- 11.9 Australia
- 11.10 Rest of Asia Pacific
Chapter 12. Latin America U.S. Pharmaceutical Hoses Market
- 12.1 Brazil
- 12.2 Argentina
- 12.3 Colombia
- 12.4 Chile
- 12.5 Rest of Latin America
Chapter 13. Middle East U.S. Pharmaceutical Hoses Market
- 13.1 Saudi Arabia
- 13.2 United Arab Emirates
- 13.3 Turkey
- 13.4 Israel
- 13.5 Iran
- 13.6 Rest of the Middle East
Chapter 14. Africa U.S. Pharmaceutical Hoses Market
- 14.1 South Africa
- 14.2 Egypt
- 14.3 Nigeria
- 14.4 Morocco
- 14.5 Rest of Africa
Chapter 15. U.S. Pharmaceutical Hoses Company Profiles
- 15.1 [Company 01]
- 15.1.1 Company Overview
- 15.1.2 Key Management Personnel
- 15.1.3 Products & Services Portfolio
- 15.1.4 Financial Performance
- 15.1.5 Key Market Focus & Geographic Presence
- 15.1.6 Recent Developments & Strategic Initiatives
Note: The company profile list is preliminary and may change based on research findings, market developments, data availability, and client requirements.
Chapter 16. Appendices
- Appendix A – List of Abbreviations & Acronyms
- Appendix B – Industry Classification Code Reference – Full Series
- Appendix C – Production & Capacity Data Tables
- Appendix D – End-Use & Demand Base Tables
- Appendix E – Consumption & Replacement Rate Assumptions
- Appendix F – ASP Reference Tables
- Appendix G – Manufacturing & Facility Database
- Appendix H – Import-Export Data Tables
- Appendix I – Regulatory Summary Tables
- Appendix J – Primary Research Participant List (Anonymized)
- Appendix K – Primary Research Questionnaire Framework
- Appendix L – Data Sources & Bibliography
- Appendix M – Market Size Divergence & Source Comparison
Chapter 17. Research Methodology
- 17.1 Research Framework & Philosophy
- 17.2 Secondary Research – Sources, Hierarchy & Data Extraction
- 17.3 Data Modeling – Bottom-Up & Top-Down Market Sizing
- 17.4 Primary Research – Stakeholder Framework, LOI & Sample Sizes
- 17.5 Forecast Methodology – Regression, Scenario & Sensitivity Analysis
- 17.6 Quality Control – Four-Layer Validation Framework
- 17.7 Limitations & Standard Assumptions
- 17.8 Disclaimer
