
Market Overview:
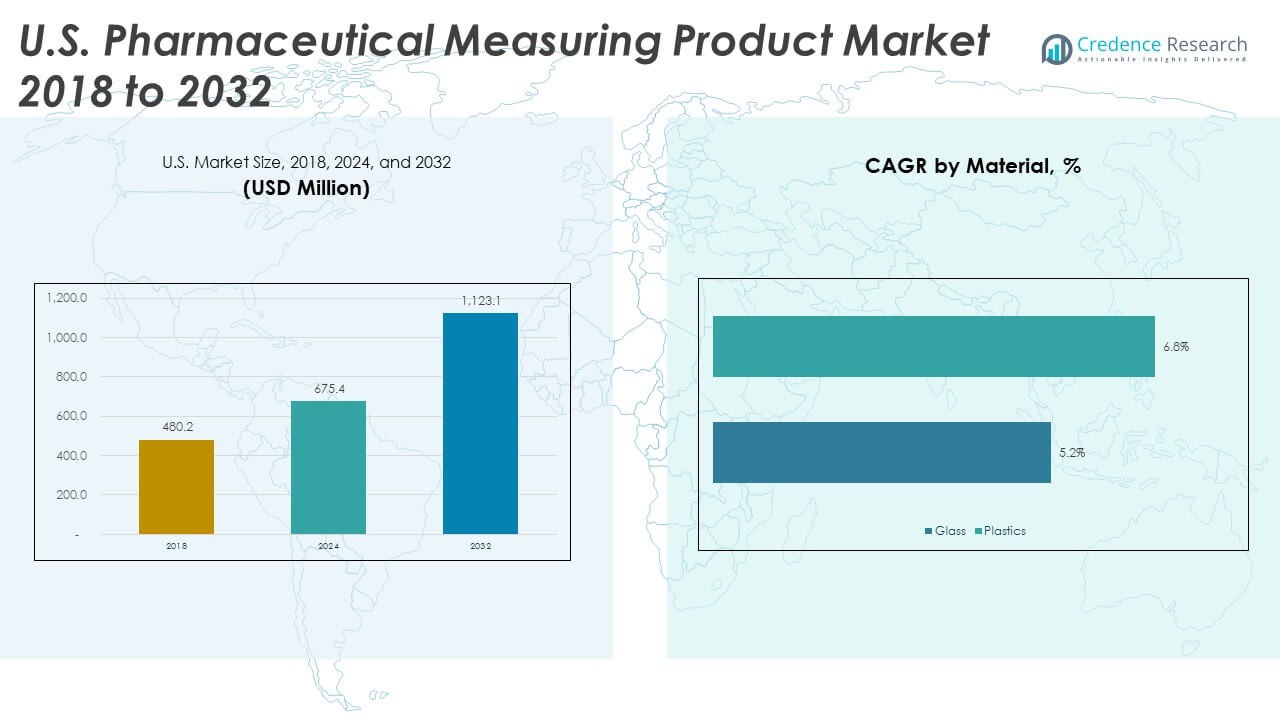
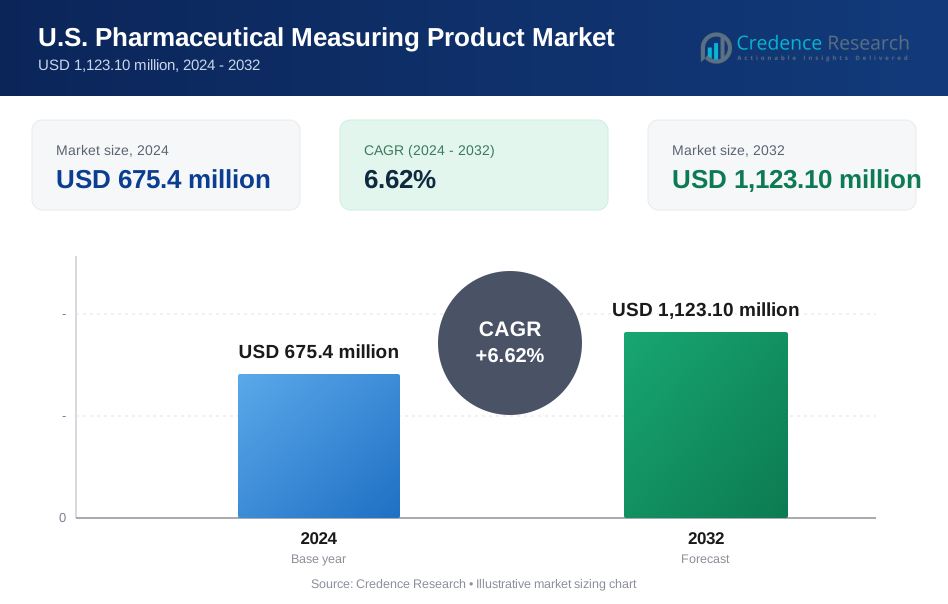
The U.S. Pharmaceutical Measuring Product Market size was valued at USD 480.2 million in 2018 to USD 675.4 million in 2024 and is anticipated to reach USD 1,123.10 million by 2032, at a CAGR of 6.62% during the forecast period.
| REPORT ATTRIBUTE | DETAILS |
|---|---|
| Historical Period | 2020-2023 |
| Base Year | 2024 |
| Forecast Period | 2025-2032 |
| U.S. Pharmaceutical Hoses Market Size 2024 | USD 675.4 Million |
| U.S. Pharmaceutical Hoses Market, CAGR | 6.62% |
| U.S. Pharmaceutical Hoses Market Size 2032 | USD 1,123.10 Million |
Strong market drivers include rising medication use across chronic illness groups and expanding self-administration trends. Producers supply advanced cups, syringes, droppers, and calibrated devices that support correct dosing practice. Drugmakers apply precision tools across manufacturing floors to meet uniformity needs. Hospitals focus on devices that improve patient safety during treatment cycles. Home-care users depend on clear markings that support correct measuring practice. The sector benefits from greater awareness of dosing errors and the demand for standardized tools. Growth remains steady due to expanding pharmaceutical production in the country. Device makers also develop ergonomic designs that improve user comfort and satisfaction.
Regional growth patterns remain concentrated across major U.S. healthcare hubs. States with large hospital networks lead adoption due to high patient volume and strong compliance norms. Regions with growing life sciences clusters show rising demand due to increased drug development and packaging activity. Emerging states adopt calibrated tools as they expand outpatient care and home-care programs. Strong pharmaceutical manufacturing corridors further accelerate uptake of dosing devices. Retail pharmacies across urban and suburban regions support wide distribution. Overall demand remains consistent nationwide due to rising medication usage and stronger emphasis on dosing accuracy across all care settings.
Market Insights:
- The U.S. Pharmaceutical Measuring Product Market grew from USD 480.2 million in 2018 to USD 675.4 million in 2024 and is projected to hit USD 1,123.10 million by 2032, supported by a 6.62% CAGR driven by stronger dosing accuracy needs.
- The Northeast (32%), Midwest (28%), and South (26%) lead the market due to dense pharma clusters, strong manufacturing bases, and extensive hospital networks that rely on calibrated measuring tools.
- The West (14%) is the fastest-growing region, driven by expanding biotechnology ecosystems, high R&D activity, and strong adoption of advanced dosing technologies.
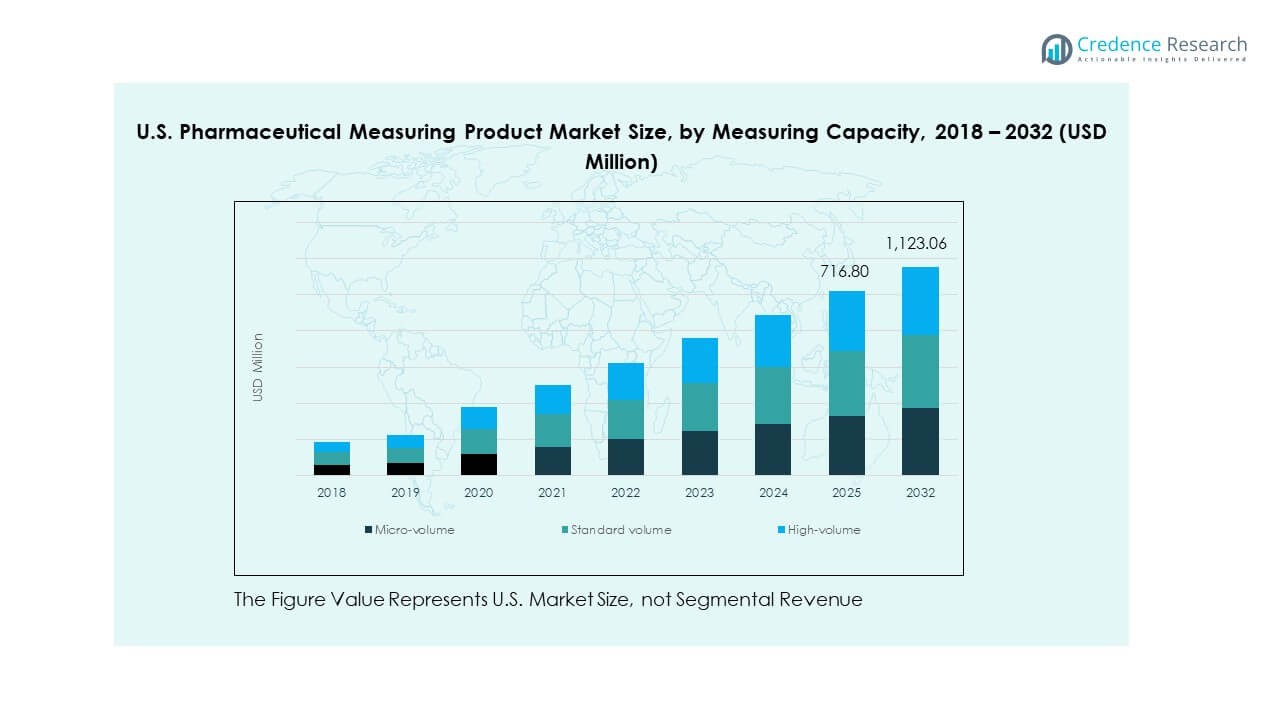
- Standard-volume tools dominate segment share at roughly 45%, supported by their wide use in hospitals, pharmacies, and routine medication workflows across the country.
- High-volume products hold about 35%, while micro-volume formats account for nearly 20%, reflecting balanced demand across compounding labs, diagnostics, and specialized dosing applications.
Market Drivers:
Growing Need For Accurate Medication Dosing Across Clinical And Home-Care Settings
The U.S. Pharmaceutical Measuring Product Market grows due to rising demand for precise dosing tools that support patient safety. Healthcare providers rely on calibrated devices to avoid errors during treatment cycles and drug administration. Home-care users prefer clear markings that guide correct dosage for liquid medicines. Manufacturers upgrade measuring cups, droppers, and syringes to improve readability and handling comfort. Drugmakers integrate precision tools across production lines to maintain dose uniformity. Hospitals enforce strict dosing standards that increase procurement of high-accuracy devices. Retail pharmacies promote products that support safer medication habits. Strong focus on error prevention lifts adoption across varied user groups.
- For instance, Baxter’s Exacta-Mix system is used across more than 1,500 hospitals in the U.S. and supports automated compounding of formula combinations with validated dosing accuracy.
Rising Use Of Chronic Disease Medication And Expanding Self-Administration Practices
Chronic illnesses increase medication frequency, which drives higher demand for reliable dosing tools. Patients managing long-term therapies depend on calibrated devices that support safe consumption patterns. The U.S. Pharmaceutical Measuring Product Market benefits from rising interest in tools that improve dose clarity. Medical professionals encourage self-administration with devices that reduce confusion during daily use. Product developers design ergonomic shapes that support handling by seniors and children. Hospitals recommend measuring tools that prevent mistakes during liquid drug intake. Community clinics support use of high-visibility markings that guide treatment accuracy. Growing patient education programs further expand product usage.
- For instance, BD (Becton, Dickinson and Company) produces more than 34 billionmedical devices annually. While only a portion of these are safety-engineered injection devices, the company has expanded its manufacturing capacity in this area, adding hundreds of millions of units annually to support safer self-administration and controlled dosing for chronic patients.
Stricter Quality Standards And Regulatory Focus On Dosing Safety
Tighter guidelines from regulatory bodies increase demand for devices that meet accuracy norms. Manufacturers improve quality control steps to align with evolving compliance rules. Product designs shift toward materials that support clear marking stability. The U.S. Pharmaceutical Measuring Product Market sees stronger adoption due to strict oversight of drug handling tools. Hospitals audit measuring devices to maintain consistent dosing reliability. Retail channels stock certified tools that match national safety expectations. Production facilities deploy calibrated tools that enhance quality checks. Growing enforcement of labelling standards shapes new product development.
Integration Of Advanced Materials And User-Centric Product Engineering
Producers adopt advanced polymers and improved molding techniques to achieve stronger precision. Device surfaces now support enhanced clarity for dosage lines. The U.S. Pharmaceutical Measuring Product Market gains traction as companies develop products with higher durability. Hospitals seek tools that withstand repeated cleaning without marking erosion. Home-care buyers value soft-grip elements that support daily handling comfort. Manufacturers explore lean designs that reduce weight while maintaining strength. Retailers promote innovations that improve dose visibility among older adults. User-centric engineering encourages broader adoption across diverse care settings.
Market Trends:
Shift Toward Digital And Smart Measuring Tools Across Pharmaceutical Workflows
The growing adoption of digital dosing devices shapes new product preferences. Smart tools integrate sensors that support accurate tracking during medication intake. Hospitals explore connected devices that guide safe drug administration steps. The U.S. Pharmaceutical Measuring Product Market adapts to demand for advanced features that reduce manual effort. Producers test digital readout designs that improve visibility for low-vision patients. Self-administration routines benefit from tools that provide dosage reminders. Pharmaceutical labs review smart tools that support precision during compounding tasks. Retail channels begin introducing digital options for home users seeking enhanced accuracy.
- For instance, Aptar Pharma’s digital inhaler platform logs up to 200 inhalation events and transmits real-time usage data to mobile applications for adherence management.
Growth Of Sustainable And Eco-Friendly Measuring Product Designs
Manufacturers increase use of recyclable materials to align with environmental goals. Products shift toward low-waste designs that reduce the need for frequent replacement. The U.S. Pharmaceutical Measuring Product Market observes rising interest in bio-based polymers. Hospitals evaluate sustainable measuring cups and syringes to lower plastic use. Retailers highlight eco-friendly lines to match consumer awareness trends. Product designers develop lightweight structures that cut material consumption. Drug packaging units review greener alternatives that support compliance. Sustainability goals influence new investment decisions across factories.
- For instance, Corning’s Valor® Glass reduces particulate contamination by up to 96% and drastically lowers container damage during filling operations, supporting cleaner and more sustainable pharmaceutical workflows.
Rising Adoption Of High-Visibility And Color-Coded Dosing Tools
Color-coded designs support error prevention during busy clinical workflows. Home-care users prefer bright markings that simplify daily medicine routines. The U.S. Pharmaceutical Measuring Product Market expands with new products designed for visual clarity. Manufacturers create high-contrast measurement lines to guide accurate dosing. Pediatric care units favor color-coded droppers that support safe administration. Hospitals adopt multicolor systems to separate drug categories. User-friendly visuals help patients follow treatment schedules. Wider focus on clear communication drives continuous design upgrades.
Greater Integration Of User Education And Instruction-Aligned Tool Designs
Manufacturers provide tools that align with educational guidelines shared by nurses and pharmacists. Hospitals promote devices that pair with easy-to-read instructions. The U.S. Pharmaceutical Measuring Product Market evolves with products that support simplified training. Retailers provide packaged kits that include clear dosage guides. Home-care programs endorse tools that align with literacy needs. Pediatric centers request products with visual cues that help caregivers. Device developers collaborate with clinicians to improve functional design. User education efforts encourage stronger trust in calibrated devices.
Market Challenges Analysis:
Quality Variation Across Low-Cost Products And Limited Standardization In Certain Segments
Variation in product quality creates confusion for buyers who seek consistent accuracy. Many low-cost devices fail to maintain marking clarity after repeated cleaning cycles. The U.S. Pharmaceutical Measuring Product Market faces pressure due to inconsistent quality control among smaller producers. Hospitals avoid unreliable tools, which narrows options for budget-sensitive users. Retail outlets often carry mixed-grade products that complicate purchase decisions. Manufacturers with weaker compliance frameworks struggle to meet regulatory expectations. User trust declines when devices display fading measurement lines. Limited standardization slows broader acceptance of new product formats.
High Regulatory Burden And Slow Product Approval Timelines
Stringent testing requirements extend the time needed to bring new tools to market. Firms face complex labelling rules that demand frequent design changes. The U.S. Pharmaceutical Measuring Product Market navigates ongoing cost pressure linked to certification processes. Smaller producers struggle with resource constraints during regulatory reviews. Hospitals delay procurement when new criteria emerge without transition guidance. Retailers adjust inventories cautiously due to shifting compliance needs. Manufacturers handle repeated audits that drain operational bandwidth. These hurdles slow innovation and restrict launch momentum.
 Market Opportunities:
Advancement Of Smart Dosing Technologies And Integration With Digital Health Tools
Smart measuring tools that connect with digital platforms create large growth potential. Hospitals consider devices that support automated dosage verification. The U.S. Pharmaceutical Measuring Product Market can benefit from tools linked to monitoring apps. Home-care users value digital prompts that support treatment adherence. Manufacturers explore sensors that record dosage events for clinical reviews. Retailers may offer digital bundles that expand product reach. Partnerships with software firms can unlock new use cases across care settings. Broader integration with telehealth strengthens demand for modern dosing tools.
Rising Demand For Ergonomic And Patient-Friendly Designs Across Diverse User Groups
Ergonomic enhancements create strong openings for new product lines. Hospitals prefer tools with better grip features for busy clinical routines. The U.S. Pharmaceutical Measuring Product Market gains potential from designs that support low-vision and senior users. Child-friendly tools appeal to pediatric units that need safer dosing support. Home-care buyers value simplified structures that guide correct handling. Retail channels promote comfort-focused designs to improve patient trust. Producers can expand portfolios with inclusive products for varied abilities. User-centric innovation shapes long-term opportunity for leading brands.
Market Segmentation Analysis:
By Product
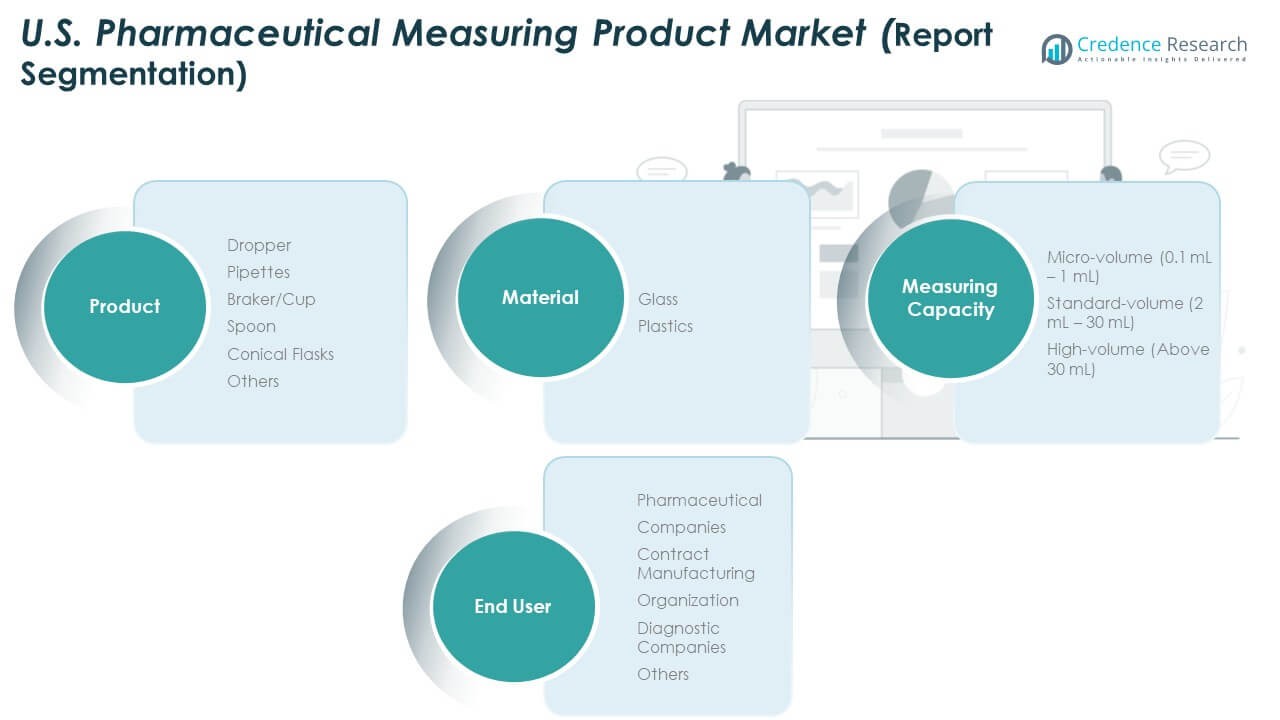
The U.S. Pharmaceutical Measuring Product Market shows strong demand across droppers, pipettes, beakers or cups, spoons, conical flasks, and other formats. Droppers lead usage in liquid dosing for both clinical and home-care settings. Pipettes gain traction in labs that require controlled transfer of micro-volumes. Beakers and cups support high-volume dispensing across production lines. Spoons remain common for pediatric and general oral medication needs. Conical flasks serve compounding and research workflows that need accurate calibration. Other products cover specialized tools designed for niche pharmaceutical tasks. Product variety supports broad adoption across diverse operations.
- For instance, Eppendorf Research plus pipettes are engineered for high precision and are designed to be extremely reliable and durable, with testing demonstrating they can withstand over 200,000 pipetting strokes and over 100,000 tip attachment cycles. While engineered for robust performance, these precision instruments require regular calibration and maintenance to ensure continued laboratory-grade accuracy, especially for specific liquids or at high altitudes
By Material
Glass and plastics define material preferences across regulated settings. Glass maintains demand due to chemical resistance and stable calibration lines. Plastic options dominate high-volume distribution due to low cost and light structure. It supports safe handling during transportation and non-breakable use in busy care units. Rising interest in cleanroom-grade materials lifts adoption of premium plastics.
- For instance, Gerresheimer produces over 17 billion pharmaceutical glass and plastic products each year, including precision-molded dosing and packaging tools used across global healthcare systems.
By Measuring Capacity
Micro-volume tools support precision dosing between 0.1 mL and 1 mL in specialized labs. Standard-volume devices between 2 mL and 30 mL dominate routine administration needs. High-volume formats above 30 mL serve bulk preparation tasks and industrial workflows.
By End User
Pharmaceutical companies lead demand with strong procurement for production and quality control units. Contract manufacturing organizations use calibrated tools to ensure batch accuracy. Diagnostic companies rely on precise instruments for sample handling. Others include hospitals, clinics, and home-care buyers that require consistent dosing support.
Segmentation:
By Product
- Dropper
- Pipettes
- Beaker/Cup
- Spoon
- Conical Flasks
- Others
By Material
- Glass
- Plastics
By Measuring Capacity
- Micro-volume (0.1 mL – 1 mL)
- Standard-volume (2 mL – 30 mL)
- High-volume (Above 30 mL)
By End User
- Pharmaceutical Companies
- Contract Manufacturing Organizations
- Diagnostic Companies
- Others
Regional Analysis:
Northeast Region
The U.S. Pharmaceutical Measuring Product Market holds a strong base in the Northeast, which accounts for 32% of national share. The region benefits from dense pharmaceutical clusters and research institutions that depend on high-precision dosing tools. Hospitals and specialty clinics adopt calibrated devices to meet strict quality norms. It gains steady demand from contract labs that require micro-volume and standard-volume instruments. Drug manufacturers in New Jersey and Pennsylvania drive procurement of high-accuracy products. Retail pharmacy networks support wide availability of consumer-grade measuring tools. Strong regulatory compliance across the region supports consistent growth.
Midwest and South Regions
The Midwest captures 28% of market share with strong adoption in industrial pharmaceutical hubs. It relies on advanced measuring tools for large-scale production and diagnostic testing. University research centers in states such as Illinois and Minnesota support growing use of lab-focused devices. The South holds 26% share due to large hospital chains and expanding manufacturing corridors. It shows rising demand for high-volume formats used in compounding and batch preparation. Retail expansion across fast-growing metro areas increases product penetration. It continues to gain traction due to rising healthcare infrastructure investment.
West Region
The West region accounts for 14% share, supported by strong biotechnology activity and high innovation uptake. The U.S. Pharmaceutical Measuring Product Market benefits from the presence of advanced research labs in California. Healthcare providers demand ergonomic products that support diverse outpatient care needs. It sees growing use of digital-friendly measuring tools that align with technology adoption patterns. Pharmacy chains across urban centers maintain steady stock of calibrated cups, droppers, and spoons. Diagnostic firms in the region prefer micro-volume devices for sample accuracy. Growth remains stable due to strong R&D culture and expanding home-care use.
Key Player Analysis:
- Desiccare Inc.
- Fuji Silysia Chemical Ltd.
- Pharma Desiccants
- Porocel
- Silica Gel Desiccant
- WISESORBENT TECHNOLOGY LLC
- Clariant
- Baltimore Innovations
- Sanner
Competitive Analysis:
The U.S. Pharmaceutical Measuring Product Market features strong competition driven by product innovation, regulatory alignment, and multi-segment expansion. Leading companies enhance portfolios with calibrated droppers, pipettes, cups, and high-visibility dosing tools. It gains competitive momentum from firms that invest in durable materials and clear marking technologies. Manufacturers focus on precision engineering to meet dosing standards across clinical, diagnostic, and home-care settings. New entrants target low-cost, high-volume tools, while established players emphasize premium accuracy solutions. Strategic partnerships with pharmaceutical producers help expand distribution channels. Companies also refine ergonomic designs to increase user safety and reduce error rates. The market remains shaped by material selection, manufacturing quality, and compliance strength.
Recent Developments:
- In November 2024, Sanner announced major strategic updates for the pharmaceutical packaging industry. The company revealed plans to optimize its TabTec CR desiccated container system, designed specifically for on-the-go self-care applications. The optimized design features improved tightness and tailored desiccants to provide optimal moisture protection for highly sensitive active ingredients.
- In June 2023, Clariant launched Desi Pak ECO, a new line of plastic‑free, bio‑based bentonite clay desiccant packets designed to reduce the environmental impact of moisture‑adsorbing solutions while maintaining high adsorption efficiency for sensitive packaged goods, including healthcare and pharmaceutical products, with packet sizes ranging from 1 g to 33 g and manufactured using sustainably grown raw materials and water‑based inks and adhesives.
Report Coverage:
The research report offers an in-depth analysis based on product, material, measuring capacity, and end-user segments. It details leading market players, providing an overview of their business, product offerings, investments, revenue streams, and key applications. Additionally, the report includes insights into the competitive environment, SWOT analysis, current market trends, as well as the primary drivers and constraints. Furthermore, it discusses various factors that have driven market expansion in recent years. The report also explores market dynamics, regulatory scenarios, and technological advancements that are shaping the industry. It assesses the impact of external factors and global economic changes on market growth. Lastly, it provides strategic recommendations for new entrants and established companies to navigate the complexities of the market.
Future Outlook:
- Demand for high-clarity dosing tools will rise due to stricter clinical accuracy norms.
- Ergonomic designs will gain traction among home-care and senior users nationwide.
- Micro-volume instruments will expand usage across diagnostics and research labs.
- Smart and digital-friendly dosing tools will attract long-term investment plans.
- Glass products will retain value in chemical-resistant applications across labs.
- Plastic measuring tools will dominate high-volume distribution in retail and pharma units.
- Contract manufacturing demand will rise with stronger outsourcing trends.
- High-volume tools will gain wider use in compounding and batch preparation facilities.
- Regional growth will strengthen in the Northeast due to dense pharma clusters.
- New product innovations will help firms improve safety, clarity, and calibration standards.
Request a Free Sample
Fill in your details and we'll send you a free sample report.
- Sample data tables & charts
- Research methodology
Need a Custom Version of This Report?
Tailor the scope, geography, or segments to your exact requirements.
- Custom geography or segment scope
- Direct access to our analyst team
Frequently Asked Questions
What is the current market size for the U.S. Pharmaceutical Measuring Product Market, and what is its projected size in 2032?
At what Compound Annual Growth Rate is the U.S. Pharmaceutical Measuring Product Market projected to grow between 2024 and 2032?
Which U.S. Pharmaceutical Measuring Product Market segment held the largest share in 2024?
What are the primary factors fueling growth in the U.S. Pharmaceutical Measuring Product Market?
Who are the leading companies in the U.S. Pharmaceutical Measuring Product Market?
Which region commanded the largest share of the U.S. Pharmaceutical Measuring Product Market in 2024?
Table of Content
Chapter 1. Report Introduction
- 1.1 Report Description & Purpose
- 1.1.1 Report Title & Market Definition
- 1.1.2 Unique Selling Propositions (USP) & Key Differentiators
- 1.1.3 Value Proposition for Stakeholders
- 1.2 Research Objectives
- 1.2.1 Market Sizing Objectives (Volume & Revenue)
- 1.2.2 Segmentation Objectives
- 1.2.3 Competitive Intelligence Objectives
- 1.2.4 Forecast & Scenario Objectives
- 1.3 Report Scope
- 1.3.1 U.S. Pharmaceutical Measuring Product Scope – Types & Subtypes Covered
- 1.3.2 Geographic Scope – Regions & Countries Covered
- 1.3.3 Historical Period, Base Year & Forecast Period (2024; forecast to 2032)
- 1.3.4 Inclusions & Exclusions
- 1.4 HS Code & Classification Framework
- 1.5 Currency, Units & Pricing Basis
- 1.6 Target Stakeholders
- 1.7 Limitations & Assumptions
Chapter 2. Executive Summary
- 2.1 Global U.S. Pharmaceutical Measuring Product Market Snapshot
- 2.1.1 Market Size – Historical (2024) & Forecast (2024-2032) (2024: USD 675.4 million → 2032: USD 1,123.10 million)
- 2.1.2 Volume & Revenue – Global Totals
- 2.1.3 Key Market Highlights – Top Five Facts
- 2.2 U.S. Pharmaceutical Measuring Product Market Segmentation Snapshot
- 2.2.1 Market Split by Region – 2024 vs. 2032
- 2.3 Competitive Snapshot
- 2.3.1 Top 10 Players by Revenue Share – 2024
- 2.3.2 Top 10 Players by Volume Share – 2024
- 2.3.3 Recent Strategic Developments (18-Month Summary)
- 2.4 Key Investment Highlights & Strategic Conclusions
Chapter 3. U.S. Pharmaceutical Measuring Product Market Dynamics & Industry Analysis
- 3.1 Market Overview & Context
- 3.1.1 U.S. Pharmaceutical Measuring Product Market Position in the Broader Automotive Value Chain
- 3.1.2 OEM vs. Replacement Market Dynamics
- 3.1.3 Market Maturity & Development Stage by Region
- 3.2 U.S. Pharmaceutical Measuring Product Market Drivers
- 3.3 U.S. Pharmaceutical Measuring Product Market Restraints & Challenges
- 3.4 U.S. Pharmaceutical Measuring Product Market Opportunities
- 3.5 Porter's Five Forces Analysis
- 3.5.1 Threat of New Entrants
- 3.5.2 Bargaining Power of Suppliers
- 3.5.3 Bargaining Power of Buyers
- 3.5.4 Threat of Substitutes
- 3.5.5 Competitive Rivalry – Intensity Assessment
- 3.6 U.S. Pharmaceutical Measuring Product Value Chain Analysis
- 3.6.1 Upstream – Raw Material/Input Suppliers
- 3.6.1.1 Raw Material/Input 1
- 3.6.1.2 Raw Material/Input 2
- 3.6.1.3 Raw Material/Input 3
- 3.6.2 Midstream – Production/Manufacturing/Service Delivery
- 3.6.2.1 Production/Process Overview
- 3.6.2.2 Key Facility Locations & Capacity by Manufacturer
- 3.6.3 Downstream – Distribution & End Consumer
- 3.6.3.1 Primary Channel – B2B/OEM
- 3.6.3.2 Secondary Channels – Dealer, Retail, Online, Direct
- 3.6.4 Value Chain Profitability Analysis
- 3.6.1 Upstream – Raw Material/Input Suppliers
- 3.7 PESTEL Analysis
- 3.7.1 Political Factors
- 3.7.2 Economic Factors
- 3.7.3 Social Factors
- 3.7.4 Technological Factors
- 3.7.5 Environmental Factors
- 3.7.6 Legal Factors
- 3.8 U.S. Pharmaceutical Measuring Product Supply Chain Analysis
- 3.8.1 Raw Material/Input Supply Risk Assessment
- 3.8.2 Manufacturing Concentration Risk (Geographic Exposure)
- 3.8.3 Trade Disruption Impact Analysis
- 3.9 Regulatory & Policy Landscape
Note: The regulatory and policy landscape section covers regulations based on their applicability to the market, U.S. Pharmaceutical Measuring Product category, geography, and scope of the study. Only regulatory frameworks with a material impact on operations, compliance, trade, sustainability, or market access are analyzed in detail.
Chapter 4. Key Investment Pockets & Opportunity Analysis
- 4.1 U.S. Pharmaceutical Measuring Product Market Attractiveness Analysis
- 4.1.1 By Region – Investment Attractiveness Matrix (Volume × CAGR)
- 4.2 Absolute Revenue Growth Opportunity
- 4.2.1 By Region – Absolute USD Growth Through 2032
- 4.3 Incremental Volume Opportunity
- 4.3.1 By Region – Incremental Volume Through 2032
- 4.3.2 Segment – Incremental Volume
- 4.4 Emerging Submarket Opportunity Deep Dive (Subject to Applicability)
- 4.5 Emerging Market Opportunity Scorecards
- 4.5.1 United States
- 4.5.2 Europe
- 4.5.3 Asia
- 4.5.4 Middle East & Africa
Note: Emerging Market Opportunity Scorecards will be included based on relevance and strategic importance. Regions listed are indicative and may vary depending on data availability and market dynamics.
Chapter 5. U.S. Pharmaceutical Measuring Product Import-Export Analysis & Trade Flows
- 5.1 Global Trade Overview
- 5.1.1 Global Export Value by Country (2024)
- 5.1.2 Global Export Volume by Country (2024)
- 5.1.3 Global Import Value by Country (2024)
- 5.1.4 Global Import Volume by Country (2024)
- 5.1.5 Net Trade Balance by Country (2024)
- 5.2 Export Analysis – Segment
- 5.2.1 Type 1 (HS Code)
- 5.2.2 Type 2 (HS Code)
- 5.2.3 Type 3 (HS Code)
- 5.2.4 Type 4 (HS Code)
- 5.2.5 Type 5 (HS Code)
- 5.3 Import Analysis – Segment
- 5.3.1 Type 1 (HS Code)
- 5.3.2 Type 2 (HS Code)
- 5.3.3 Type 3 (HS Code)
- 5.3.4 Type 4 (HS Code)
- 5.3.5 Type 5 (HS Code)
- 5.4 Average Unit Trade Prices
- 5.4.1 Average Export Price – Segment & Country
- 5.4.2 Average Import Price – Segment & Source Country
- 5.4.3 Price Trends (2024)
- 5.5 Key Trade Route Analysis
- 5.5.1 Trade Route 1
- 5.5.2 Trade Route 2
- 5.5.3 Trade Route 3
- 5.5.4 Trade Route 4
- 5.5.5 Trade Route 5
- 5.6 Trade Policy Impact Assessment
- 5.6.1 US Anti-Dumping & Section 301 Tariffs
- 5.6.2 EU Customs Union Impact
- 5.6.3 Major Free Trade Agreements
- 5.6.4 USMCA Rules of Origin
Note: Trade policy analysis will be included only where relevant to the U.S. Pharmaceutical Measuring Product market.
Chapter 6. Competitive Landscape & Company Benchmarking
- 6.1 U.S. Pharmaceutical Measuring Product Market Concentration & Structure
- 6.1.1 Herfindahl-Hirschman Index (HHI) – vs. 2024
- 6.1.2 Tier 1, Tier 2 & Tier 3 Market Structure
- 6.1.3 Global, Regional & Local Player Dynamics
- 6.2 U.S. Pharmaceutical Measuring Product Market Share Analysis – 2024
- 6.2.1 Global Revenue Share by Company
- 6.2.2 Global Volume Share by Company
- 6.2.3 Regional Revenue Share
- 6.2.4 Market Share Evolution ( vs. 2024)
- 6.2.5 OEM Segment Share by Company
- 6.2.6 Replacement Segment Share by Company
- 6.3 Production/Delivery Capacity & Facility Analysis
- 6.3.1 Global Installed Capacity
- 6.3.2 Capacity Utilization Rates
- 6.3.3 Production/Output Volume
- 6.3.4 Facility Locations & Capacity Map
- 6.3.5 Planned Capacity Additions
- 6.4 U.S. Pharmaceutical Measuring Product Competitive Benchmarking Matrix
- 6.4.1 Revenue, Volume, CAGR & Profitability Comparison
- 6.4.2 Channel Revenue Mix
- 6.4.3 Geographic Revenue Exposure
- 6.4.4 R&D Intensity
- 6.4.5 Sustainability Maturity
- 6.5 Strategic Developments in U.S. Pharmaceutical Measuring Product (Last 24 Months)
- 6.5.1 Mergers, Acquisitions & Divestments
- 6.5.2 New U.S. Pharmaceutical Measuring Product Launches
- 6.5.3 Facility Expansions
- 6.5.4 Strategic Alliances, Joint Ventures & Partnerships
- 6.5.5 Distribution Expansion & Market Entry
- 6.5.6 Sustainability & ESG Initiatives
- 6.6 Competitive Strategy Mapping
- 6.6.1 Leader, Challenger, Follower & Niche Classification
- 6.6.2 Pricing Strategy Comparison
- 6.6.3 Channel Strategy Matrix
Note: Strategic developments are included based on their materiality and the availability of reliable information.
Chapter 7. Global U.S. Pharmaceutical Measuring Product Market – By Distribution Channel
- 7.1 Segment Overview
- 7.1.1 Volume & Revenue Split by Channel (2024 & 2032)
- 7.1.2 Channel Mix Evolution (2024-2032)
Chapter 8. Regional Market Analysis – Global Overview
- 8.1 Global Regional Overview
- 8.1.1 Regional Volume Share
- 8.1.2 Regional Revenue Share
- 8.1.3 Regional Volume by Region
- 8.1.4 Regional Revenue by Region
- 8.1.5 Regional Forecast Through 2032
- 8.2 Cross-Regional Segment Analysis
- 8.2.1 By Distribution Channel
- 8.2.2 By Brand/Price Tier
Chapter 9. North America U.S. Pharmaceutical Measuring Product Market
- 9.1 United States
- 9.2 Canada
- 9.3 Mexico
Chapter 10. Europe U.S. Pharmaceutical Measuring Product Market
- 10.1 Germany
- 10.2 France
- 10.3 Italy
- 10.4 United Kingdom
- 10.5 Spain
- 10.6 Poland
- 10.7 Russia
- 10.8 Netherlands
- 10.9 Belgium
- 10.10 Sweden
- 10.11 Denmark
- 10.12 Norway
- 10.13 Rest of Europe
Chapter 11. Asia Pacific U.S. Pharmaceutical Measuring Product Market
- 11.1 China
- 11.2 India
- 11.3 Japan
- 11.4 South Korea
- 11.5 Thailand
- 11.6 Indonesia
- 11.7 Vietnam
- 11.8 Malaysia
- 11.9 Australia
- 11.10 Rest of Asia Pacific
Chapter 12. Latin America U.S. Pharmaceutical Measuring Product Market
- 12.1 Brazil
- 12.2 Argentina
- 12.3 Colombia
- 12.4 Chile
- 12.5 Rest of Latin America
Chapter 13. Middle East U.S. Pharmaceutical Measuring Product Market
- 13.1 Saudi Arabia
- 13.2 United Arab Emirates
- 13.3 Turkey
- 13.4 Israel
- 13.5 Iran
- 13.6 Rest of the Middle East
Chapter 14. Africa U.S. Pharmaceutical Measuring Product Market
- 14.1 South Africa
- 14.2 Egypt
- 14.3 Nigeria
- 14.4 Morocco
- 14.5 Rest of Africa
Chapter 15. U.S. Pharmaceutical Measuring Product Company Profiles
- 15.1 [Company 01]
- 15.1.1 Company Overview
- 15.1.2 Key Management Personnel
- 15.1.3 Products & Services Portfolio
- 15.1.4 Financial Performance
- 15.1.5 Key Market Focus & Geographic Presence
- 15.1.6 Recent Developments & Strategic Initiatives
Note: The company profile list is preliminary and may change based on research findings, market developments, data availability, and client requirements.
Chapter 16. Appendices
- Appendix A – List of Abbreviations & Acronyms
- Appendix B – Industry Classification Code Reference – Full Series
- Appendix C – Production & Capacity Data Tables
- Appendix D – End-Use & Demand Base Tables
- Appendix E – Consumption & Replacement Rate Assumptions
- Appendix F – ASP Reference Tables
- Appendix G – Manufacturing & Facility Database
- Appendix H – Import-Export Data Tables
- Appendix I – Regulatory Summary Tables
- Appendix J – Primary Research Participant List (Anonymized)
- Appendix K – Primary Research Questionnaire Framework
- Appendix L – Data Sources & Bibliography
- Appendix M – Market Size Divergence & Source Comparison
Chapter 17. Research Methodology
- 17.1 Research Framework & Philosophy
- 17.2 Secondary Research – Sources, Hierarchy & Data Extraction
- 17.3 Data Modeling – Bottom-Up & Top-Down Market Sizing
- 17.4 Primary Research – Stakeholder Framework, LOI & Sample Sizes
- 17.5 Forecast Methodology – Regression, Scenario & Sensitivity Analysis
- 17.6 Quality Control – Four-Layer Validation Framework
- 17.7 Limitations & Standard Assumptions
- 17.8 Disclaimer
