
Market Overview
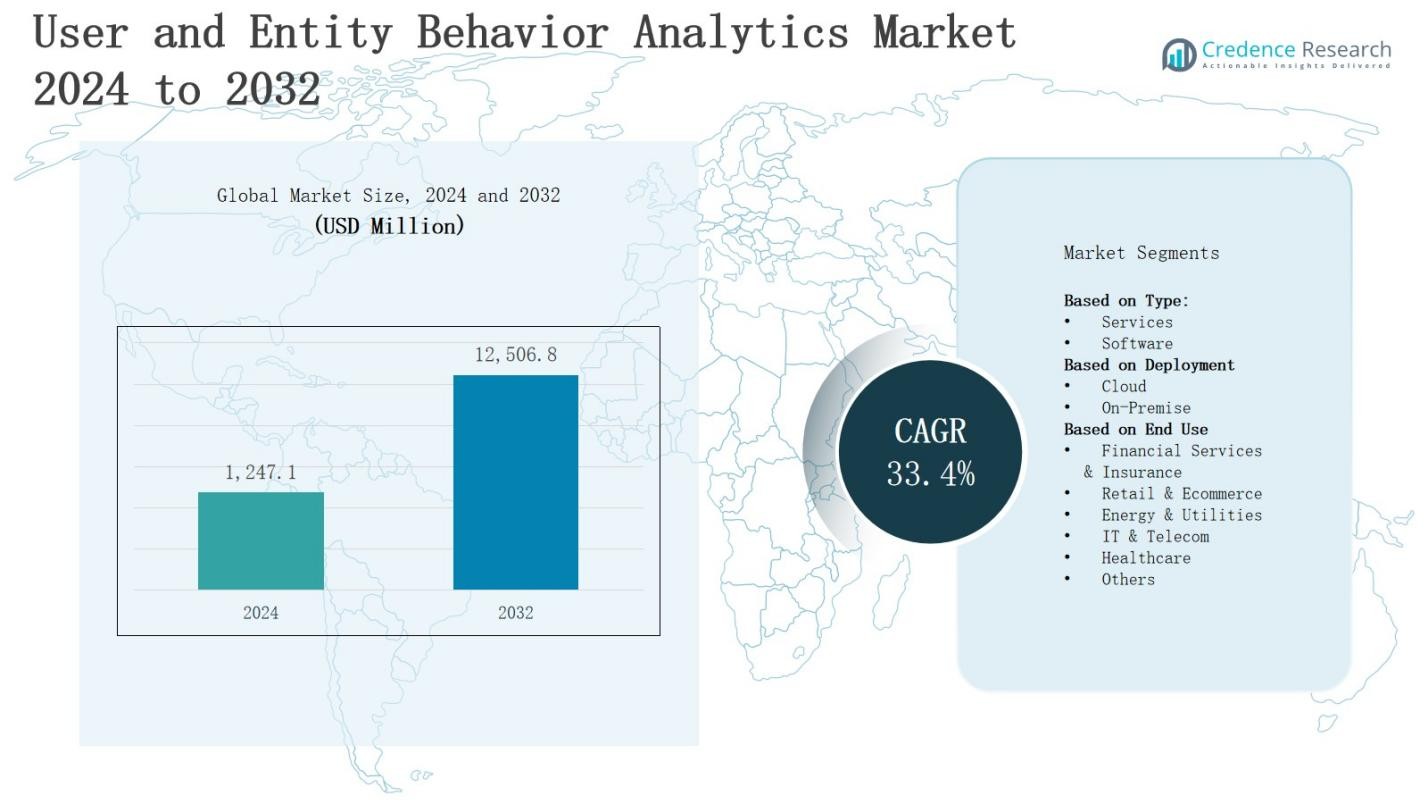
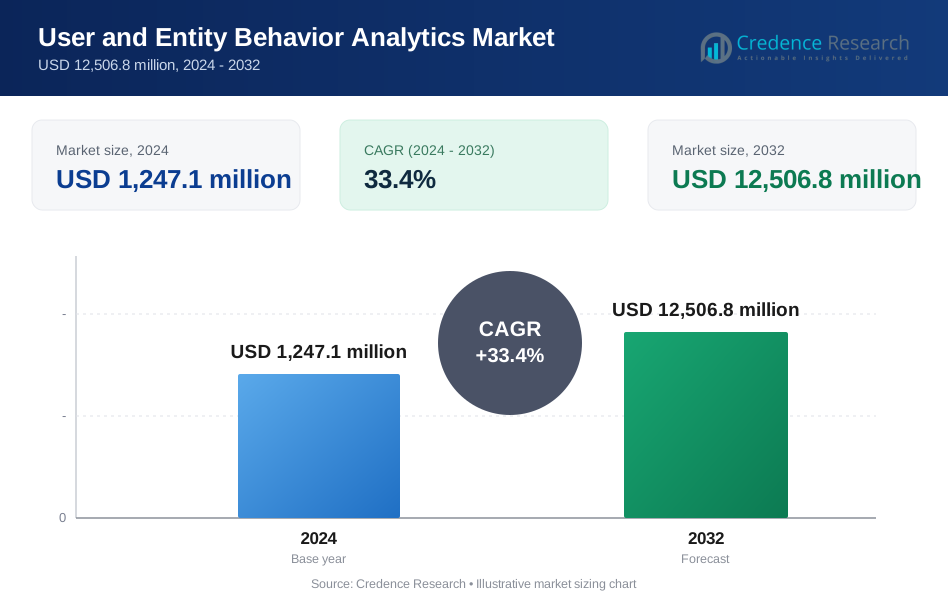
The user and entity behavior analytics market is projected to grow from USD 1,247.1 million in 2024 to USD 12,506.8 million by 2032, registering a robust CAGR of 33.4% during the forecast period.
| REPORT ATTRIBUTE | DETAILS |
|---|---|
| Historical Period | 2020-2024 |
| Base Year | 2024 |
| Forecast Period | 2025-2032 |
| User and Entity Behavior Analytics Market Size 2024 | USD 1,247.1 Million |
| User and Entity Behavior Analytics Market, CAGR | 33.4% |
| User and Entity Behavior Analytics Market Size 2032 | USD 12,506.8 Million |
Market growth in the user and entity behavior analytics market is driven by the rising frequency of cyber threats, insider attacks, and data breaches, prompting organizations to adopt advanced security analytics for proactive threat detection. Increasing adoption of cloud services, remote work models, and IoT devices is expanding attack surfaces, further fueling demand. Integration of AI and machine learning is enhancing anomaly detection accuracy and reducing false positives, while regulatory compliance requirements are pushing enterprises toward robust security frameworks. Trends include the shift toward real-time analytics, automated response systems, and the incorporation of UEBA into broader security information and event management platforms.
The user and entity behavior analytics market spans North America, Europe, Asia-Pacific, and the Rest of the World, each contributing uniquely to global growth. North America leads with advanced cybersecurity infrastructure and high adoption across industries, while Europe benefits from stringent data protection laws. Asia-Pacific shows rapid expansion driven by digital transformation and rising cyber threats, and the Rest of the World gains momentum through smart city and digital banking initiatives. Key players include Niara, Inc, Gurucul, Bay Dynamics, Securonix, Splunk, Inc, Rapid7, Exabeam, Inc, Sqrrl Data, Inc, Varonis Systems, Inc, and Dtex Systems.
Market Insights
- The user and entity behavior analytics market is set to grow from USD 1,247.1 million in 2024 to USD 12,506.8 million by 2032, at a CAGR of 33.4%, driven by rising cyber threats, insider attacks, and the need for proactive detection.
- Cloud adoption, remote work, and IoT proliferation are expanding attack surfaces, prompting demand for advanced UEBA solutions that secure hybrid and distributed environments.
- AI and machine learning integration is enhancing detection accuracy, reducing false positives, and enabling predictive threat intelligence capabilities.
- Regulatory frameworks like GDPR, HIPAA, and CCPA are pushing enterprises toward compliance-ready security analytics with robust monitoring and reporting functions.
- High implementation costs, specialized expertise requirements, and data privacy challenges remain significant barriers to adoption in small and mid-sized enterprises.
- North America leads with 42% market share, followed by Europe at 28%, Asia-Pacific at 20%, and the Rest of the World at 10%, each with distinct growth drivers.
- Key players include Niara, Inc, Gurucul, Bay Dynamics, Securonix, Splunk, Inc, Rapid7, Exabeam, Inc, Sqrrl Data, Inc, Varonis Systems, Inc, and Dtex Systems, focusing on innovation, integration, and sector-specific solutions.
Market Drivers
Rising Incidence of Cybersecurity Threats and Insider Attacks
The user and entity behavior analytics market is witnessing strong growth due to the escalating volume and sophistication of cyber threats, including insider attacks and advanced persistent threats. Organizations face challenges in identifying subtle anomalies within large volumes of user activity data. It enables faster detection by analyzing patterns and deviations from normal behavior. Businesses are adopting UEBA to address risks posed by compromised credentials, malicious insiders, and targeted cyber intrusions effectively.
- For instance, Teramind’s UEBA system monitors user activities such as unusual file downloads or access times to detect insider threats and automatically triggers alerts or restrictions when risky behavior is detected.
Expansion of Cloud Services and Remote Workforce
Cloud migration and the rise of remote work environments are driving the adoption of UEBA solutions. Distributed access points increase vulnerability, requiring continuous monitoring of user behavior across devices and networks. It helps detect unusual activities that bypass traditional security controls. Enterprises seek advanced analytics to secure hybrid environments, safeguard sensitive data, and maintain operational resilience amid evolving digital transformation initiatives and diverse endpoint connections.
Integration of Artificial Intelligence and Machine Learning
Advancements in AI and machine learning are enhancing the capabilities of UEBA platforms by improving anomaly detection accuracy and minimizing false positives. It allows security teams to focus on high-priority threats without being overwhelmed by irrelevant alerts. AI-driven models learn and adapt to evolving attack techniques, providing predictive threat intelligence. This innovation is driving demand across industries seeking proactive and adaptive security measures.
- For instance, ManageEngine's UEBA module, which uses machine learning algorithms to establish behavioral baselines for users and entities, flagging deviations that indicate potential security risks like abnormal login times or unusual file access patterns.
Regulatory Compliance and Data Protection Mandates
Increasing regulatory frameworks such as GDPR, HIPAA, and CCPA are compelling organizations to implement advanced monitoring and reporting tools. The user and entity behavior analytics market benefits from this compliance-driven demand, offering solutions that ensure audit readiness and accountability. It enables organizations to maintain transparent security processes, protect customer data, and meet strict governance requirements. Compliance-driven adoption ensures long-term integration of UEBA into enterprise security strategies.
Market Trends
Shift Toward Real-Time Threat Detection and Automated Response
The user and entity behavior analytics market is experiencing a notable shift toward real-time monitoring and automated incident response capabilities. Organizations are integrating UEBA with security orchestration tools to shorten response times and reduce manual intervention. It enables continuous analysis of user activities, quickly flagging anomalies and triggering automated containment measures. This approach improves operational efficiency, reduces breach impact, and supports the proactive defense strategies demanded by evolving cyber threat landscapes.
- For instance, Evolve Security Automation applies automated incident response workflows to contain ransomware attacks and insider threats instantly, minimizing damage with little to no manual intervention.
Integration with Broader Security Ecosystems
UEBA solutions are increasingly being embedded within larger security information and event management (SIEM) and extended detection and response (XDR) platforms. This trend allows enterprises to centralize security operations, consolidate threat intelligence, and enhance correlation across diverse data sources. It strengthens the value of UEBA by enabling comprehensive visibility and contextual insights. Such integration supports a unified security architecture capable of handling complex attack vectors in modern IT environments.
- For instance, Rapid7’s InsightIDR integrates SIEM with XDR and UEBA, leveraging machine learning to tag and investigate threats, with alerts that automatically create investigations outlining relevant behavior chains.
Adoption Across Diverse Industry Verticals
The application scope of UEBA is expanding beyond traditional sectors like finance and government into healthcare, retail, manufacturing, and critical infrastructure. It addresses industry-specific challenges such as protecting patient records, securing payment data, and preventing operational disruptions. Organizations in regulated industries adopt UEBA to safeguard sensitive assets while meeting compliance obligations. This vertical diversification broadens the market base and accelerates solution innovation tailored to unique operational contexts.
AI-Driven Predictive and Adaptive Security Models
A major trend involves the deployment of AI-powered predictive analytics to anticipate threats before they materialize. It leverages machine learning models that continuously adapt to new attack patterns and evolving user behavior. These adaptive models reduce reliance on static rules, enabling more dynamic and context-aware threat detection. Such advancements are positioning UEBA as a critical component in next-generation cybersecurity frameworks focused on resilience and agility.
Market Challenges Analysis
High Implementation Costs and Resource Constraints
The user and entity behavior analytics market faces challenges from high initial investment requirements and ongoing operational costs. Deploying advanced UEBA solutions often involves integrating with existing IT infrastructure, acquiring skilled personnel, and maintaining continuous updates. It can strain the budgets of small and mid-sized enterprises, limiting adoption. Complex configuration and tuning processes demand specialized expertise, which is not readily available in all organizations. Limited financial and human resources hinder scalability and long-term utilization.
Data Privacy Concerns and Integration Complexities
Strict data privacy regulations and cross-border data transfer restrictions create hurdles for UEBA deployment. The user and entity behavior analytics market must address concerns about monitoring employee activities without violating privacy rights. It also faces integration challenges when connecting with diverse systems, applications, and legacy infrastructure. Poor data quality or fragmented sources can reduce detection accuracy and increase false positives. Overcoming these challenges requires robust data governance frameworks and seamless interoperability between multiple security platforms.
Market Opportunities
Growing Demand for Proactive Threat Intelligence Solutions
The user and entity behavior analytics market holds significant potential through the rising demand for proactive threat detection capabilities. Organizations are increasingly seeking solutions that can identify vulnerabilities and detect anomalies before they escalate into security breaches. It enables predictive threat intelligence by leveraging machine learning and behavioral analytics. Expanding adoption across industries with sensitive data, such as healthcare, finance, and government, presents growth avenues. The push for stronger cybersecurity postures enhances the appeal of advanced UEBA platforms.
Expansion in Emerging Markets and New Industry Segments
Rapid digital transformation in emerging economies offers untapped opportunities for UEBA adoption. The user and entity behavior analytics market can benefit from the surge in cloud-based deployments and growing awareness of cybersecurity best practices. It can expand into sectors such as manufacturing, retail, and critical infrastructure, where security gaps are becoming more evident. Vendors introducing scalable, cost-effective, and industry-specific solutions can capture these high-growth segments. Strategic partnerships with regional system integrators can further accelerate market penetration.
Market Segmentation Analysis:
By Type
The user and entity behavior analytics market is segmented into services and software, each addressing distinct organizational needs. Software solutions dominate due to their role in automating threat detection, anomaly identification, and integration with broader security frameworks. It offers scalable and customizable platforms that can adapt to diverse IT environments. Services, including consulting, integration, and managed security, are gaining traction among enterprises seeking expert guidance and faster implementation without heavy in-house resource commitments.
For instance, IBM’s QRadar leverages machine learning to establish baselines of normal user behavior and detect anomalies, providing user risk scoring and watchlists for ongoing monitoring.
By Deployment
Deployment models include cloud and on-premise, catering to varied security and infrastructure preferences. Cloud-based UEBA solutions are expanding rapidly due to their scalability, lower upfront costs, and ability to support remote workforces. It facilitates real-time monitoring and analytics from distributed locations. On-premise deployments remain essential for organizations with stringent data control requirements, especially in highly regulated sectors, offering greater customization and adherence to internal compliance frameworks.
- For instance, Union Bank implemented a UEBA solution to aggregate DLP events, establishing behavioral baselines that filtered false positives and prioritized high-risk alerts, thereby improving detection of unusual activity effectively.
By End Use
End-use segments cover financial services and insurance, retail and ecommerce, energy and utilities, IT and telecom, healthcare, and others. Financial institutions lead adoption, leveraging UEBA for fraud prevention and compliance adherence. It also sees strong uptake in healthcare for patient data protection and in IT and telecom for safeguarding critical networks. Retailers employ UEBA to secure transaction data and customer information, while energy and utilities use it to protect operational technology from cyber threats.
Segments:
Based on Type:
- Services
- Software
Based on Deployment
- Cloud
- On-Premise
Based on End Use
- Financial Services & insurance
- Retail & Ecommerce
- Energy & Utilities
- IT & Telecom
- Healthcare
- Others
Based on the Geography:
- North America
- U.S.
- Canada
- Mexico
- Europe
- Germany
- France
- U.K.
- Italy
- Spain
- Rest of Europe
- Asia Pacific
- China
- Japan
- India
- South Korea
- South-east Asia
- Rest of Asia Pacific
- Latin America
- Brazil
- Argentina
- Rest of Latin America
- Middle East & Africa
- GCC Countries
- South Africa
- Rest of the Middle East and Africa
Regional Analysis
North America
North America holds the largest share of the user and entity behavior analytics market, accounting for 42% of global revenue. The region’s dominance is driven by the presence of leading cybersecurity vendors, advanced IT infrastructure, and high awareness of proactive threat detection. It benefits from strong regulatory frameworks such as HIPAA and GDPR-equivalent state laws, which push enterprises toward robust security measures. The adoption of UEBA is high across sectors like finance, healthcare, and IT, with heavy investment in AI-driven analytics. Increasing insider threat incidents and sophisticated cyberattacks are accelerating demand for integrated, real-time monitoring platforms. Strategic partnerships between technology providers and enterprises are further strengthening market growth.
Europe
Europe accounts for 28% of the user and entity behavior analytics market, supported by stringent data protection regulations such as GDPR and NIS directives. The region prioritizes advanced monitoring solutions to secure sensitive corporate and customer data. It is witnessing rising adoption in banking, energy, and manufacturing sectors, driven by the need for compliance and operational resilience. Government-backed initiatives to strengthen cybersecurity infrastructure are fostering market penetration. Leading economies like Germany, the UK, and France are investing heavily in AI-based UEBA platforms. Cross-border data security concerns are also influencing widespread adoption of on-premise and hybrid deployment models.
Asia-Pacific
Asia-Pacific represents 20% of the user and entity behavior analytics market, with growth fueled by rapid digital transformation, expanding e-commerce, and increasing cybercrime rates. It is witnessing strong adoption in emerging economies such as India, China, and Indonesia, where cloud-based deployments are gaining preference. Rising awareness among SMEs and large enterprises about insider threat detection is contributing to adoption. Governments are implementing stricter cybersecurity policies, pushing organizations toward continuous monitoring solutions. The IT and telecom sectors lead regional demand, supported by high data traffic volumes and a growing remote workforce. Strategic collaborations with global vendors are accelerating regional market maturity.
Rest of the World
The Rest of the World holds 10% of the user and entity behavior analytics market, with adoption concentrated in Latin America, the Middle East, and Africa. It is driven by growing investments in digital banking, smart city initiatives, and public sector cybersecurity programs. Countries in the Gulf Cooperation Council are adopting UEBA to protect critical infrastructure and government data. Latin America shows rising deployment in retail and financial services to counter payment fraud. Limited skilled cybersecurity resources remain a challenge, but vendor-led training and managed service models are expanding accessibility. Increasing connectivity and regional policy reforms are supporting gradual growth.
Key Player Analysis
- Niara, Inc
- Gurucul
- Bay Dynamics
- Securonix
- Splunk, Inc
- Rapid7
- Exabeam, Inc
- Sqrrl Data, Inc
- Varonis Systems, Inc
- Dtex Systems
Competitive Analysis
The user and entity behavior analytics market is characterized by intense competition among established cybersecurity vendors and specialized analytics providers. It is driven by continuous innovation in AI and machine learning to enhance anomaly detection accuracy and reduce false positives. Key players such as Niara, Inc, Gurucul, Bay Dynamics, Securonix, Splunk, Inc, Rapid7, Exabeam, Inc, Sqrrl Data, Inc, Varonis Systems, Inc, and Dtex Systems compete through product enhancements, strategic partnerships, and industry-specific solutions. Vendors focus on integrating UEBA capabilities with SIEM, XDR, and cloud security platforms to deliver unified threat detection and response frameworks. The market is witnessing consolidation through mergers and acquisitions aimed at expanding portfolios and customer reach. Leading companies invest in advanced behavioral models, real-time analytics, and seamless deployment options to cater to both cloud and on-premise environments. Growing demand across sectors such as finance, healthcare, IT, and energy is prompting players to strengthen global distribution networks and develop scalable solutions capable of meeting diverse compliance and operational requirements.
Recent Developments
- In May 2025, LaunchDarkly rolled out its Product Analytics capability, allowing teams to analyze product usage, experiments, and user behavior directly within data warehouses such as Snowflake, BigQuery, and Databricks, improving governance and eliminating the need for separate analytics systems.
- On April 28, 2025, CrowdStrike unveiled Falcon Adversary OverWatch Next‑Gen SIEM, featuring enhanced AI-driven UEBA, case management, and identity security automation to significantly improve threat detection and response workflows.
- In November 2023, Rapid7 introduced an AI-powered cloud anomaly detection feature. It identifies behavioral anomalies in cloud environments—especially in API activity—without the need for agents. It works by analyzing audit logs, establishing activity patterns, and evaluating anomalies in under 10 minutes.
- In January 2024, Exabeam launched "Exabeam IoT Sentinel," the industry's first UEBA solution designed specifically for Internet of Things (IoT) devices. It uses machine learning to establish baseline behavior patterns for various IoT devices and detect anomalies indicating security breaches.
Market Concentration & Characteristics
The user and entity behavior analytics market exhibits a moderately high level of concentration, with a mix of established cybersecurity leaders and specialized analytics providers dominating global revenues. It is characterized by continuous innovation in AI-driven anomaly detection, behavioral modeling, and integration with broader security ecosystems such as SIEM and XDR platforms. Leading players compete on technological capabilities, scalability, and industry-specific customization. The market serves diverse sectors, including finance, healthcare, IT, energy, and retail, where proactive threat detection is critical. Cloud-based deployments are expanding rapidly, supported by the need for real-time monitoring and flexible infrastructure. Regulatory compliance requirements further shape product design, driving demand for solutions with advanced reporting and audit capabilities. Partnerships, mergers, and acquisitions are common strategies to expand market presence and enhance product portfolios. Vendors focus on improving detection accuracy, reducing false positives, and delivering seamless integration with existing enterprise security frameworks to maintain a competitive edge.
Report Coverage
The research report offers an in-depth analysis based on Type, Deployment, End-Use and Geography. It details leading market players, providing an overview of their business, product offerings, investments, revenue streams, and key applications. Additionally, the report includes insights into the competitive environment, SWOT analysis, current market trends, as well as the primary drivers and constraints. Furthermore, it discusses various factors that have driven market expansion in recent years. The report also explores market dynamics, regulatory scenarios, and technological advancements that are shaping the industry. It assesses the impact of external factors and global economic changes on market growth. Lastly, it provides strategic recommendations for new entrants and established companies to navigate the complexities of the market.
Future Outlook
- Adoption of AI-driven behavioral models will enhance predictive and adaptive threat detection capabilities.
- Cloud-based UEBA solutions will gain stronger traction across industries with distributed workforces.
- Integration with SIEM, XDR, and SOAR platforms will become a standard feature for unified security operations.
- Demand for real-time monitoring and automated response capabilities will increase across all enterprise sizes.
- Regulatory compliance pressures will drive higher adoption in sectors handling sensitive personal and financial data.
- Emerging economies will witness faster growth due to rising cybersecurity awareness and digital transformation initiatives.
- Industry-specific UEBA applications will expand, targeting healthcare, retail, energy, and manufacturing needs.
- Strategic collaborations between global vendors and regional system integrators will improve market penetration.
- Advancements in data governance frameworks will address privacy concerns and improve deployment scalability.
- Continuous innovation in analytics and machine learning will reduce false positives and strengthen incident response.
Request a Free Sample
Fill in your details and we'll send you a free sample report.
- Sample data tables & charts
- Research methodology
Need a Custom Version of This Report?
Tailor the scope, geography, or segments to your exact requirements.
- Custom geography or segment scope
- Direct access to our analyst team
Frequently Asked Questions
What is the current market size for user and entity behavior analytics market, and what is its projected size in 2032?
At what Compound Annual Growth Rate is the user and entity behavior analytics market projected to grow between 2025 and 2032?
Which user and entity behavior analytics market segment held the largest share in 2024?
What are the primary factors fueling the growth of the user and entity behavior analytics market?
Who are the leading companies in the user and entity behavior analytics market?
Which region commanded the largest share of the user and entity behavior analytics market in 2024?
Table of Content
Chapter 1. Report Introduction
- 1.1 Report Description & Purpose
- 1.1.1 Report Title & Market Definition
- 1.1.2 Unique Selling Propositions (USP) & Key Differentiators
- 1.1.3 Value Proposition for Stakeholders
- 1.2 Research Objectives
- 1.2.1 Market Sizing Objectives (Volume & Revenue)
- 1.2.2 Segmentation Objectives
- 1.2.3 Competitive Intelligence Objectives
- 1.2.4 Forecast & Scenario Objectives
- 1.3 Report Scope
- 1.3.1 User and Entity Behavior Analytics Scope – Types & Subtypes Covered
- 1.3.2 Geographic Scope – Regions & Countries Covered
- 1.3.3 Historical Period, Base Year & Forecast Period (2024; forecast to 2032)
- 1.3.4 Inclusions & Exclusions
- 1.4 HS Code & Classification Framework
- 1.5 Currency, Units & Pricing Basis
- 1.6 Target Stakeholders
- 1.7 Limitations & Assumptions
Chapter 2. Executive Summary
- 2.1 Global User and Entity Behavior Analytics Market Snapshot
- 2.1.1 Market Size – Historical (2024) & Forecast (2024-2032) (2024: USD 1,247.1 million → 2032: USD 12,506.8 million)
- 2.1.2 Volume & Revenue – Global Totals
- 2.1.3 Key Market Highlights – Top Five Facts
- 2.2 User and Entity Behavior Analytics Market Segmentation Snapshot
- 2.2.1 Market Split by Region – 2024 vs. 2032
- 2.3 Competitive Snapshot
- 2.3.1 Top 10 Players by Revenue Share – 2024
- 2.3.2 Top 10 Players by Volume Share – 2024
- 2.3.3 Recent Strategic Developments (18-Month Summary)
- 2.4 Key Investment Highlights & Strategic Conclusions
Chapter 3. User and Entity Behavior Analytics Market Dynamics & Industry Analysis
- 3.1 Market Overview & Context
- 3.1.1 User and Entity Behavior Analytics Market Position in the Broader Automotive Value Chain
- 3.1.2 OEM vs. Replacement Market Dynamics
- 3.1.3 Market Maturity & Development Stage by Region
- 3.2 User and Entity Behavior Analytics Market Drivers
- 3.3 User and Entity Behavior Analytics Market Restraints & Challenges
- 3.4 User and Entity Behavior Analytics Market Opportunities
- 3.5 Porter's Five Forces Analysis
- 3.5.1 Threat of New Entrants
- 3.5.2 Bargaining Power of Suppliers
- 3.5.3 Bargaining Power of Buyers
- 3.5.4 Threat of Substitutes
- 3.5.5 Competitive Rivalry – Intensity Assessment
- 3.6 User and Entity Behavior Analytics Value Chain Analysis
- 3.6.1 Upstream – Raw Material/Input Suppliers
- 3.6.1.1 Raw Material/Input 1
- 3.6.1.2 Raw Material/Input 2
- 3.6.1.3 Raw Material/Input 3
- 3.6.2 Midstream – Production/Manufacturing/Service Delivery
- 3.6.2.1 Production/Process Overview
- 3.6.2.2 Key Facility Locations & Capacity by Manufacturer
- 3.6.3 Downstream – Distribution & End Consumer
- 3.6.3.1 Primary Channel – B2B/OEM
- 3.6.3.2 Secondary Channels – Dealer, Retail, Online, Direct
- 3.6.4 Value Chain Profitability Analysis
- 3.6.1 Upstream – Raw Material/Input Suppliers
- 3.7 PESTEL Analysis
- 3.7.1 Political Factors
- 3.7.2 Economic Factors
- 3.7.3 Social Factors
- 3.7.4 Technological Factors
- 3.7.5 Environmental Factors
- 3.7.6 Legal Factors
- 3.8 User and Entity Behavior Analytics Supply Chain Analysis
- 3.8.1 Raw Material/Input Supply Risk Assessment
- 3.8.2 Manufacturing Concentration Risk (Geographic Exposure)
- 3.8.3 Trade Disruption Impact Analysis
- 3.9 Regulatory & Policy Landscape
Note: The regulatory and policy landscape section covers regulations based on their applicability to the market, User and Entity Behavior Analytics category, geography, and scope of the study. Only regulatory frameworks with a material impact on operations, compliance, trade, sustainability, or market access are analyzed in detail.
Chapter 4. Key Investment Pockets & Opportunity Analysis
- 4.1 User and Entity Behavior Analytics Market Attractiveness Analysis
- 4.1.1 By Region – Investment Attractiveness Matrix (Volume × CAGR)
- 4.2 Absolute Revenue Growth Opportunity
- 4.2.1 By Region – Absolute USD Growth Through 2032
- 4.3 Incremental Volume Opportunity
- 4.3.1 By Region – Incremental Volume Through 2032
- 4.3.2 Segment – Incremental Volume
- 4.4 Emerging Submarket Opportunity Deep Dive (Subject to Applicability)
- 4.5 Emerging Market Opportunity Scorecards
- 4.5.1 United States
- 4.5.2 Europe
- 4.5.3 Asia
- 4.5.4 Middle East & Africa
Note: Emerging Market Opportunity Scorecards will be included based on relevance and strategic importance. Regions listed are indicative and may vary depending on data availability and market dynamics.
Chapter 5. User and Entity Behavior Analytics Import-Export Analysis & Trade Flows
- 5.1 Global Trade Overview
- 5.1.1 Global Export Value by Country (2024)
- 5.1.2 Global Export Volume by Country (2024)
- 5.1.3 Global Import Value by Country (2024)
- 5.1.4 Global Import Volume by Country (2024)
- 5.1.5 Net Trade Balance by Country (2024)
- 5.2 Export Analysis – Segment
- 5.2.1 Type 1 (HS Code)
- 5.2.2 Type 2 (HS Code)
- 5.2.3 Type 3 (HS Code)
- 5.2.4 Type 4 (HS Code)
- 5.2.5 Type 5 (HS Code)
- 5.3 Import Analysis – Segment
- 5.3.1 Type 1 (HS Code)
- 5.3.2 Type 2 (HS Code)
- 5.3.3 Type 3 (HS Code)
- 5.3.4 Type 4 (HS Code)
- 5.3.5 Type 5 (HS Code)
- 5.4 Average Unit Trade Prices
- 5.4.1 Average Export Price – Segment & Country
- 5.4.2 Average Import Price – Segment & Source Country
- 5.4.3 Price Trends (2024)
- 5.5 Key Trade Route Analysis
- 5.5.1 Trade Route 1
- 5.5.2 Trade Route 2
- 5.5.3 Trade Route 3
- 5.5.4 Trade Route 4
- 5.5.5 Trade Route 5
- 5.6 Trade Policy Impact Assessment
- 5.6.1 US Anti-Dumping & Section 301 Tariffs
- 5.6.2 EU Customs Union Impact
- 5.6.3 Major Free Trade Agreements
- 5.6.4 USMCA Rules of Origin
Note: Trade policy analysis will be included only where relevant to the User and Entity Behavior Analytics market.
Chapter 6. Competitive Landscape & Company Benchmarking
- 6.1 User and Entity Behavior Analytics Market Concentration & Structure
- 6.1.1 Herfindahl-Hirschman Index (HHI) – vs. 2024
- 6.1.2 Tier 1, Tier 2 & Tier 3 Market Structure
- 6.1.3 Global, Regional & Local Player Dynamics
- 6.2 User and Entity Behavior Analytics Market Share Analysis – 2024
- 6.2.1 Global Revenue Share by Company
- 6.2.2 Global Volume Share by Company
- 6.2.3 Regional Revenue Share
- 6.2.4 Market Share Evolution ( vs. 2024)
- 6.2.5 OEM Segment Share by Company
- 6.2.6 Replacement Segment Share by Company
- 6.3 Production/Delivery Capacity & Facility Analysis
- 6.3.1 Global Installed Capacity
- 6.3.2 Capacity Utilization Rates
- 6.3.3 Production/Output Volume
- 6.3.4 Facility Locations & Capacity Map
- 6.3.5 Planned Capacity Additions
- 6.4 User and Entity Behavior Analytics Competitive Benchmarking Matrix
- 6.4.1 Revenue, Volume, CAGR & Profitability Comparison
- 6.4.2 Channel Revenue Mix
- 6.4.3 Geographic Revenue Exposure
- 6.4.4 R&D Intensity
- 6.4.5 Sustainability Maturity
- 6.5 Strategic Developments in User and Entity Behavior Analytics (Last 24 Months)
- 6.5.1 Mergers, Acquisitions & Divestments
- 6.5.2 New User and Entity Behavior Analytics Launches
- 6.5.3 Facility Expansions
- 6.5.4 Strategic Alliances, Joint Ventures & Partnerships
- 6.5.5 Distribution Expansion & Market Entry
- 6.5.6 Sustainability & ESG Initiatives
- 6.6 Competitive Strategy Mapping
- 6.6.1 Leader, Challenger, Follower & Niche Classification
- 6.6.2 Pricing Strategy Comparison
- 6.6.3 Channel Strategy Matrix
Note: Strategic developments are included based on their materiality and the availability of reliable information.
Chapter 7. Global User and Entity Behavior Analytics Market – By Distribution Channel
- 7.1 Segment Overview
- 7.1.1 Volume & Revenue Split by Channel (2024 & 2032)
- 7.1.2 Channel Mix Evolution (2024-2032)
Chapter 8. Regional Market Analysis – Global Overview
- 8.1 Global Regional Overview
- 8.1.1 Regional Volume Share
- 8.1.2 Regional Revenue Share
- 8.1.3 Regional Volume by Region
- 8.1.4 Regional Revenue by Region
- 8.1.5 Regional Forecast Through 2032
- 8.2 Cross-Regional Segment Analysis
- 8.2.1 By Distribution Channel
- 8.2.2 By Brand/Price Tier
Chapter 9. North America User and Entity Behavior Analytics Market
- 9.1 United States
- 9.2 Canada
- 9.3 Mexico
Chapter 10. Europe User and Entity Behavior Analytics Market
- 10.1 Germany
- 10.2 France
- 10.3 Italy
- 10.4 United Kingdom
- 10.5 Spain
- 10.6 Poland
- 10.7 Russia
- 10.8 Netherlands
- 10.9 Belgium
- 10.10 Sweden
- 10.11 Denmark
- 10.12 Norway
- 10.13 Rest of Europe
Chapter 11. Asia Pacific User and Entity Behavior Analytics Market
- 11.1 China
- 11.2 India
- 11.3 Japan
- 11.4 South Korea
- 11.5 Thailand
- 11.6 Indonesia
- 11.7 Vietnam
- 11.8 Malaysia
- 11.9 Australia
- 11.10 Rest of Asia Pacific
Chapter 12. Latin America User and Entity Behavior Analytics Market
- 12.1 Brazil
- 12.2 Argentina
- 12.3 Colombia
- 12.4 Chile
- 12.5 Rest of Latin America
Chapter 13. Middle East User and Entity Behavior Analytics Market
- 13.1 Saudi Arabia
- 13.2 United Arab Emirates
- 13.3 Turkey
- 13.4 Israel
- 13.5 Iran
- 13.6 Rest of the Middle East
Chapter 14. Africa User and Entity Behavior Analytics Market
- 14.1 South Africa
- 14.2 Egypt
- 14.3 Nigeria
- 14.4 Morocco
- 14.5 Rest of Africa
Chapter 15. User and Entity Behavior Analytics Company Profiles
- 15.1 [Company 01]
- 15.1.1 Company Overview
- 15.1.2 Key Management Personnel
- 15.1.3 Products & Services Portfolio
- 15.1.4 Financial Performance
- 15.1.5 Key Market Focus & Geographic Presence
- 15.1.6 Recent Developments & Strategic Initiatives
Note: The company profile list is preliminary and may change based on research findings, market developments, data availability, and client requirements.
Chapter 16. Appendices
- Appendix A – List of Abbreviations & Acronyms
- Appendix B – Industry Classification Code Reference – Full Series
- Appendix C – Production & Capacity Data Tables
- Appendix D – End-Use & Demand Base Tables
- Appendix E – Consumption & Replacement Rate Assumptions
- Appendix F – ASP Reference Tables
- Appendix G – Manufacturing & Facility Database
- Appendix H – Import-Export Data Tables
- Appendix I – Regulatory Summary Tables
- Appendix J – Primary Research Participant List (Anonymized)
- Appendix K – Primary Research Questionnaire Framework
- Appendix L – Data Sources & Bibliography
- Appendix M – Market Size Divergence & Source Comparison
Chapter 17. Research Methodology
- 17.1 Research Framework & Philosophy
- 17.2 Secondary Research – Sources, Hierarchy & Data Extraction
- 17.3 Data Modeling – Bottom-Up & Top-Down Market Sizing
- 17.4 Primary Research – Stakeholder Framework, LOI & Sample Sizes
- 17.5 Forecast Methodology – Regression, Scenario & Sensitivity Analysis
- 17.6 Quality Control – Four-Layer Validation Framework
- 17.7 Limitations & Standard Assumptions
- 17.8 Disclaimer
