
Market Overview:
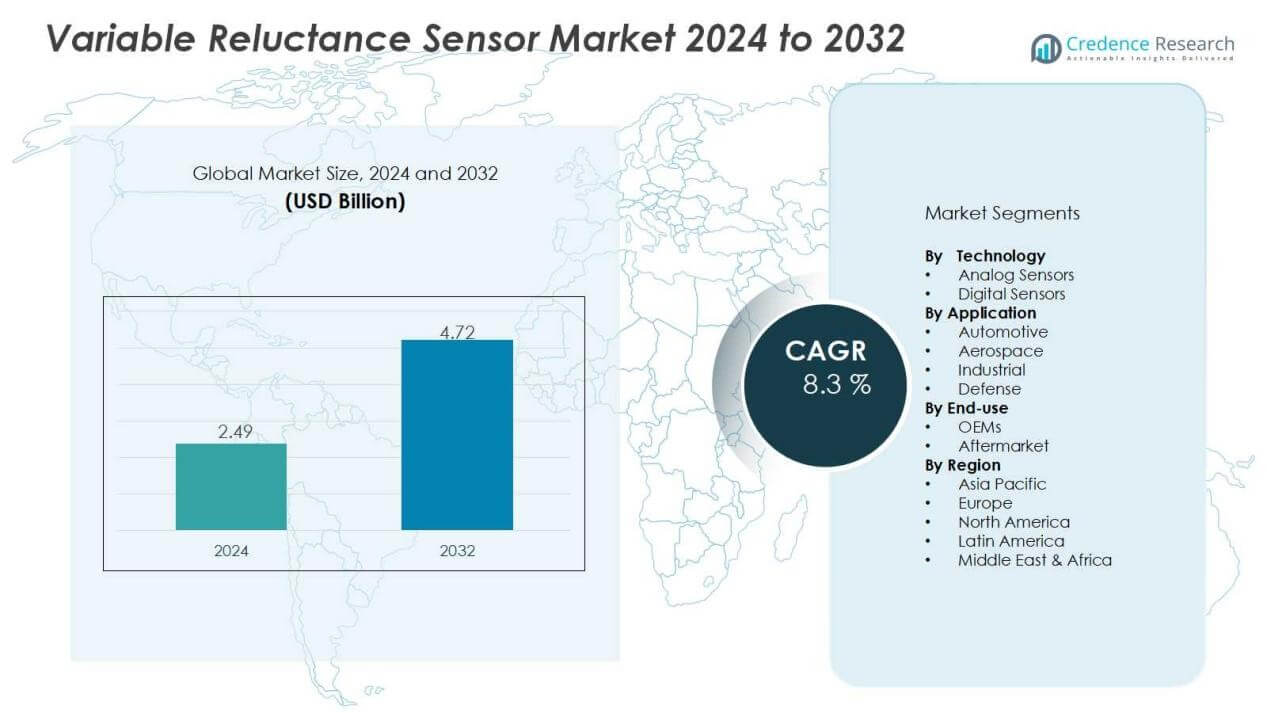
The variable reluctance sensor market size was valued at USD 2.49 billion in 2024 and is anticipated to reach USD 4.72 billion by 2032, at a CAGR of 8.3% during the forecast period.
| REPORT ATTRIBUTE | DETAILS |
|---|---|
| Historical Period | 2020-2023 |
| Base Year | 2024 |
| Forecast Period | 2025-2032 |
| Variable Reluctance Sensor Market Size 2024 | USD 2.49 Billion |
| Variable Reluctance Sensor Market, CAGR | 8.3% |
| Variable Reluctance Sensor Market Size 2032 | USD 4.72 Billion |
Key market drivers include the growing automotive industry, particularly the integration of variable reluctance sensors in anti-lock braking systems (ABS) and engine management. Industrial automation is also boosting demand, as sensors play a critical role in process monitoring and predictive maintenance. Furthermore, the aerospace sector leverages these sensors for precise measurement and safety-critical applications. Continuous technological improvements in sensor accuracy, durability, and miniaturization strengthen adoption across end-user industries.
Regionally, North America holds a significant market share, supported by strong automotive manufacturing and early adoption of sensor technologies. Europe follows closely, driven by stringent vehicle safety regulations and advanced industrial infrastructure. Asia-Pacific is expected to record the fastest growth due to rapid automotive production, expanding industrial automation, and rising investments in sensor technologies across China, India, and Japan. Emerging regions, including Latin America and the Middle East & Africa, present gradual opportunities with improving industrialization and automotive demand.
Market Insights:
- The variable reluctance sensor market was valued at USD 49 billion in 2024 and is projected to reach USD 4.72 billion by 2032 at a CAGR of 8.3%.
- Strong demand from the automotive sector, especially in ABS, engine control, and transmission systems, drives consistent adoption.
- Industrial automation boosts demand, as sensors enable predictive maintenance, reduce downtime, and support machinery efficiency.
- The aerospace and defense sectors use these sensors for turbine speed monitoring, navigation, and mission-critical systems.
- Technological advances in sensitivity, durability, and miniaturization expand applications and build trust among end users.
- Competition from Hall-effect and magnetoresistive sensors poses a challenge, pressuring manufacturers to focus on innovation and cost.
- North America led with 36% share in 2024, while Asia-Pacific is expected to witness the fastest growth through rising automotive production and industrial automation.
Market Drivers:
Rising Demand in Automotive Applications Boosting Market Growth:
The variable reluctance sensor market is strongly supported by the expanding automotive industry. These sensors are widely used in anti-lock braking systems, engine control units, and transmission systems. Automakers are adopting them to meet safety and performance requirements set by regulators. It helps improve efficiency in fuel management and vehicle stability. Growing vehicle production worldwide ensures consistent demand.
- For Instance, Continental unveiled its inductive eRPS rotor position sensor, which was engineered to deliver ±0.5° accuracy at speeds of up to 24,000 rpm.
Increasing Role in Industrial Automation and Machinery Efficiency:
Industrial automation is driving higher adoption of variable reluctance sensors across factories and manufacturing plants. These sensors enable accurate measurement of speed, torque, and vibration in heavy machinery. It supports predictive maintenance strategies, reducing downtime and operating costs. Industries focused on productivity improvements are turning to reliable sensor solutions. Their versatility across multiple applications creates strong opportunities in the industrial sector.
- For instance, in June 2021 Bosch Rexroth deployed its HDD1 variable reluctance speed sensor across automotive stamping lines, enabling rotational speed measurement from 0.1 Hz to 20 000 Hz.
Expanding Aerospace and Defense Applications Strengthening Adoption:
The variable reluctance sensor market benefits from rising aerospace and defense investments. Aircraft systems rely on these sensors for monitoring turbine speed, engine control, and navigation systems. It provides high accuracy in harsh conditions, making the technology vital for mission-critical operations. Defense organizations prioritize reliable sensors that withstand extreme environments. Growing aircraft production and modernization programs support adoption in this sector.
Advancements in Sensor Technology Enhancing Performance and Reliability:
Ongoing innovation is improving the design and performance of variable reluctance sensors. Manufacturers focus on increasing sensitivity, reducing noise, and extending durability. It strengthens trust among end users, particularly in safety-critical environments. Miniaturization and integration with digital control systems are expanding application possibilities. These technological advancements position the market for long-term growth.
Market Trends:
Growing Integration with Advanced Automotive and Industrial Systems:
The variable reluctance sensor market is witnessing a trend of deeper integration into modern automotive and industrial systems. Automakers rely on these sensors to support advanced safety features and improve fuel efficiency. It is also used in electric and hybrid vehicles for monitoring motor performance and energy management. Industrial sectors adopt these sensors to align with Industry 4.0, where real-time monitoring and predictive maintenance are essential. The focus on efficiency, safety, and reliability strengthens the role of these sensors across multiple sectors. Manufacturers continue to expand design options to meet specific performance and regulatory requirements.
- For instance, Continental has developed its e-Motor Rotor Temperature Sensor (eRTS) technology that reduces temperature measurement tolerance from 15°C to just 3°C in electric vehicle motors, enabling manufacturers to reduce rare earth element usage while maintaining magnet heat resistance.
Rising Focus on Miniaturization, Durability, and Digital Connectivity:
Technology advancements are reshaping how variable reluctance sensors perform in demanding environments. Miniaturized designs allow integration into compact systems without compromising accuracy. It also ensures reliability in harsh conditions such as extreme temperatures and vibrations. Manufacturers emphasize materials and designs that extend sensor lifespan and reduce maintenance needs. Integration with digital platforms supports real-time data processing and connectivity with broader control systems. This trend aligns with the growing demand for smart solutions across automotive, aerospace, and industrial markets. The expansion of connected and durable sensors strengthens the long-term outlook for adoption.
- For instance, TE Connectivity’s DSE 1610.15 AHZ variable reluctance speed sensor incorporates a 3 mm pole-piece diameter within an M16×1.5 housing, delivers an inductance of 50 mH at 1 kHz ±10%, and supports output signal frequencies up to 30 kHz, enabling seamless integration into space-constrained, high-speed control systems.
Market Challenges Analysis:
High Competition from Alternative Sensor Technologies Limiting Growth:
The variable reluctance sensor market faces strong competition from newer sensor technologies such as Hall-effect and magnetoresistive sensors. These alternatives often provide higher accuracy, better signal stability, and lower susceptibility to noise. It creates a challenge for manufacturers to maintain relevance in advanced applications where precision is critical. Automotive and aerospace sectors are gradually shifting toward digital and solid-state solutions. The presence of cost-effective alternatives may reduce the adoption rate of variable reluctance sensors in high-end systems. Companies must focus on innovation and cost optimization to counter competitive pressure.
Performance Limitations and Maintenance Requirements Creating Barriers:
The technology behind variable reluctance sensors can face issues in environments requiring high sensitivity and real-time accuracy. It is prone to signal distortions in low-speed or fluctuating conditions, which limits use in critical systems. Maintenance costs also rise when sensors operate in harsh environments with vibrations, dust, or extreme temperatures. Industrial users often demand longer lifespan and reduced calibration needs, which can challenge this sensor type. Limited adaptability in emerging smart systems creates further obstacles for market penetration. Overcoming these barriers requires advances in design, materials, and integration strategies.
Market Opportunities:
Expanding Applications in Electric Vehicles and Smart Mobility:
The variable reluctance sensor market holds strong opportunities in the transition toward electric and hybrid vehicles. Automakers seek efficient sensors for motor speed monitoring, regenerative braking, and energy optimization. It delivers durability and cost-effectiveness, making it suitable for large-scale adoption in evolving mobility systems. Growing investment in autonomous and connected vehicles also increases the need for accurate sensing technologies. Governments supporting electrification create a favorable environment for sensor integration. This shift in automotive design opens new avenues for revenue growth and product innovation.
Increasing Demand in Industrial Automation and Aerospace Systems:
Industrial modernization creates strong prospects for variable reluctance sensors across manufacturing and automation processes. These sensors provide essential input for predictive maintenance, efficiency tracking, and real-time monitoring of heavy machinery. It ensures reliability in critical operations, aligning with the global trend of Industry 4.0 adoption. Aerospace and defense sectors also present rising opportunities with demand for durable sensors in turbine monitoring and navigation systems. Expansion in smart factories and advanced aircraft programs strengthens the long-term growth potential. Companies focusing on high-performance designs can capture significant opportunities across these industries.
Market Segmentation Analysis:
By Technology:
The variable reluctance sensor market is segmented by technology into analog and digital sensors. Analog sensors remain widely used in traditional automotive and industrial applications due to their cost-effectiveness and durability. It offers reliable performance where basic speed and position detection is required. Digital sensors are gaining traction with advanced features, higher precision, and integration with control systems. Industries adopting automation and smart technologies prefer digital formats for enhanced functionality. This balance between traditional and modern technologies ensures steady demand across end users.
- For Instance, TE Connectivity's E38S analog VR sensor features an inductance of 170 mH at 1 kHz and a resistance of 850 Ω ±10% at ambient temperature. It supports accurate speed detection under varying air-gap conditions.
By Application:
The variable reluctance sensor market finds application in automotive, aerospace, industrial, and defense sectors. Automotive leads adoption, driven by requirements for anti-lock braking systems, transmission monitoring, and engine control. It supports efficiency and safety standards demanded by regulators and manufacturers. Aerospace and defense also rely on these sensors for turbine speed monitoring and navigation systems. Industrial applications include machinery monitoring and predictive maintenance, aligning with global automation trends. Broad adoption across diverse applications enhances the resilience of this market.
- For instance, National Instruments’ myRIO system paired with the Jaquet ATS-1 DSE 1010 sensor measured turbocharger shaft speeds up to 400 000 rpm.
By End Use:
The variable reluctance sensor market is classified by end use into OEMs and aftermarket. OEMs hold a dominant position due to integration in new vehicles, aircraft, and machinery systems. It ensures reliable adoption through partnerships between manufacturers and sensor providers. The aftermarket segment grows steadily with demand for replacements and upgrades in existing systems. Strong focus on performance and compliance drives preference for quality aftermarket solutions. Together, these segments sustain long-term opportunities across industries.
Segmentations:
By Technology:
- Analog Sensors
- Digital Sensors
By Application:
- Automotive
- Aerospace
- Industrial
- Defense
By End Use:
- OEMs
- Aftermarket
By Region:
- North America
- U.S.
- Canada
- Mexico
- Europe
- Germany
- France
- U.K.
- Italy
- Spain
- Rest of Europe
- Asia Pacific
- China
- Japan
- India
- South Korea
- South-east Asia
- Rest of Asia Pacific
- Latin America
- Brazil
- Argentina
- Rest of Latin America
- Middle East & Africa
- GCC Countries
- South Africa
- Rest of the Middle East and Africa
Regional Analysis:
North America:
North America held 36% share of the variable reluctance sensor market in 2024, supported by advanced manufacturing ecosystems and high automotive production. The United States remains the largest contributor, driven by strict safety regulations and strong adoption in anti-lock braking systems. It benefits from a mature industrial base where automation and predictive maintenance are widely implemented. Leading aerospace programs in the region further accelerate sensor demand for high-performance applications. Continuous investment in research and development strengthens the competitive positioning of manufacturers. Strong collaboration between automotive OEMs and sensor suppliers sustains growth momentum in this region.
Europe:
Europe accounted for 28% share of the variable reluctance sensor market in 2024, driven by stringent emission norms and robust automotive industries. Germany, France, and the United Kingdom lead adoption, with emphasis on advanced vehicle systems and electrification. It is supported by established aerospace infrastructure where sensors play a critical role in navigation and turbine monitoring. The region also benefits from Industry 4.0 initiatives that integrate advanced sensing solutions into production systems. European manufacturers invest heavily in innovation to improve durability and accuracy. Rising demand for sustainable mobility solutions continues to strengthen market prospects.
Asia-Pacific:
Asia-Pacific captured 24% share of the variable reluctance sensor market in 2024, fueled by rapid growth in automotive and industrial sectors. China, India, and Japan are at the forefront, supported by expanding vehicle production and rising adoption of automation technologies. It is also driven by government policies that encourage domestic manufacturing and innovation in smart mobility. Aerospace and defense programs across the region create further opportunities for advanced sensors. Increasing investment in electric vehicles and smart factories strengthens long-term growth potential. Local and international players are expanding presence to capitalize on this momentum.
Key Player Analysis:
- Shinano Kenshi Co., Ltd.
- NIDEC CORPORATION
- MinebeaMitsumi Inc
- MOONS
- ORIENTAL MOTOR USA CORP.
- TAMAGAWA SEIKI Co.,Ltd.
- SANYO DENKI CO., LTD.
- Changzhou Fulling Motor Co., Ltd
- Nippon Pulse America, Inc.
Competitive Analysis:
The variable reluctance sensor market is characterized by strong competition among global and regional players. Key companies include Shinano Kenshi Co., Ltd., NIDEC CORPORATION, MinebeaMitsumi Inc., MOONS, ORIENTAL MOTOR USA CORP., and TAMAGAWA SEIKI Co., Ltd. It is shaped by continuous investment in product innovation, miniaturization, and performance improvements to meet diverse industry demands. Companies strengthen portfolios by focusing on durability, precision, and integration with digital systems. Strategic partnerships with automotive OEMs and industrial manufacturers help expand customer reach. Aerospace and defense contracts also provide growth opportunities for suppliers delivering sensors capable of withstanding harsh environments. Competitive pressure drives firms to balance cost-efficiency with advanced features, ensuring relevance in both developed and emerging markets.
Recent Developments:
- In July 2025, Nidec realigned its battery supply strategy and acquired 100% of Nidec Energy AS (NEAS) in support of expanding Battery Energy Storage Systems in North America and Europe.
- In July 2025, MinebeaMitsumi entered a partnership agreement with Fukuroi City, Shizuoka Prefecture, to develop smart city technologies using MinebeaMitsumi's digital and smart lighting solutions
Report Coverage:
The research report offers an in-depth analysis based on Technology, Application, End Use and Region. It details leading Market players, providing an overview of their business, product offerings, investments, revenue streams, and key applications. Additionally, the report includes insights into the competitive environment, SWOT analysis, current Market trends, as well as the primary drivers and constraints. Furthermore, it discusses various factors that have driven Market expansion in recent years. The report also explores Market dynamics, regulatory scenarios, and technological advancements that are shaping the industry. It assesses the impact of external factors and global economic changes on Market growth. Lastly, it provides strategic recommendations for new entrants and established companies to navigate the complexities of the Market.
Future Outlook:
- The variable reluctance sensor market will expand with strong demand from automotive safety systems.
- It will gain traction in electric and hybrid vehicles as manufacturers seek reliable motor monitoring.
- The market will benefit from industrial automation where predictive maintenance depends on precise sensing.
- It will strengthen its role in aerospace and defense applications requiring durability in harsh conditions.
- Manufacturers will invest in miniaturization and integration with digital platforms to improve usability.
- It will see rising opportunities in smart factories driven by Industry 4.0 adoption worldwide.
- The market will face pressure to compete with advanced alternatives but retain strength through cost-effectiveness.
- It will expand geographically as Asia-Pacific leads growth supported by vehicle production and automation.
- The market will evolve with demand for sustainable solutions aligning with global electrification trends.
- It will attract investments in research and partnerships to deliver next-generation sensing technologies.

Request a Free Sample
Fill in your details and we'll send you a free sample report.
- Sample data tables & charts
- Research methodology
Market Dynamics
Automotive Industry Expansion and Safety Regulations
The growing automotive sector, especially the integration of variable reluctance sensors in anti-lock braking systems (ABS), engine management, and transmission systems, is a major driver. Stringent safety and performance regulations are pushing automakers to adopt these sensors for improved vehicle efficiency and compliance.
Industrial Automation and Predictive Maintenance
Increasing adoption of industrial automation is fueling demand for variable reluctance sensors, which are critical for process monitoring, speed measurement, and predictive maintenance. Their ability to enhance machinery efficiency and reduce downtime makes them essential in modern manufacturing environments.
Aerospace and Defense Applications
The aerospace and defense sectors rely on variable reluctance sensors for turbine speed monitoring, navigation, and mission-critical systems. Their durability and accuracy in harsh environments make them indispensable for safety-critical and high-performance applications.
Technological Advancements in Sensor Design
Continuous improvements in sensor sensitivity, durability, and miniaturization are expanding the range of applications for variable reluctance sensors. Enhanced performance and integration with digital control systems are increasing their adoption across automotive, industrial, and aerospace sectors.
Growth in Electric and Hybrid Vehicles
The shift towards electric and hybrid vehicles is creating new opportunities for variable reluctance sensors, which are used for motor speed monitoring, regenerative braking, and energy optimization. The demand for reliable and cost-effective sensing solutions in evolving mobility systems is driving market growth.
Need a Custom Version of This Report?
Tailor the scope, geography, or segments to your exact requirements.
- Custom geography or segment scope
- Direct access to our analyst team
Frequently Asked Questions
What is the current market size for the variable reluctance sensor market, and what is its projected size in 2032?
At what Compound Annual Growth Rate is the variable reluctance sensor market projected to grow between 2024 and 2032?
Which variable reluctance sensor market segment held the largest share in 2024?
What are the primary factors fueling the growth of the variable reluctance sensor market?
Who are the leading companies in the variable reluctance sensor market?
Which region commanded the largest share of the variable reluctance sensor market in 2024?
Table of Content
Chapter 1 Market Segmentation
- 1.1 Segmentation Framework
- 1.1.1 Product and Service Classification
- 1.1.2 Application and End-Use Classification
- 1.1.3 Technology and Solution Classification
- 1.1.4 Customer and Distribution Channel Classification
- 1.1.5 Geographic Segmentation
- 1.1.6 Market Segment Definitions and Boundaries
- 1.2 By End Use
- 1.2.1 OEMs
- 1.2.2 Aftermarket
- 1.3 By Technology
- 1.3.1 Analog Sensors
- 1.3.2 Digital Sensors
- 1.4 By Application
- 1.4.1 Automotive
- 1.4.2 Aerospace
- 1.4.3 Industrial
- 1.4.4 Defense
Chapter 2 Introduction
- 2.1 Report Objectives and Scope
- 2.2 Product Definition and Industry Terminology
- 2.3 Market Inclusions and Exclusions
- 2.4 Research Process
- 2.4.1 Primary Research and Expert Interviews
- 2.4.2 Secondary Research and Source Review
- 2.4.3 Top-Down and Bottom-Up Estimation
- 2.4.4 Data Triangulation and Verification
- 2.5 Market Size Measurement Basis
- 2.5.1 2024: USD 2.49 billion → 2032: USD 4.72 billion
- 2.6 Historical and Forecast Reference Periods
- 2.6.1 Base Year: 2024
- 2.6.2 Forecast Period: 2024-2032
- 2.7 Research Assumptions and Limitations
Chapter 3 Executive Summary
- 3.1 Market Snapshot and Key Findings
- 3.2 Base-Year Market Size, 2024
- 3.3 Forecast Market Size, 2032
- 3.4 Revenue and Volume Growth Outlook
- 3.5 Key Demand and Supply Indicators
- 3.6 Leading Market Segments
- 3.7 Fastest-Growing Market Opportunities
- 3.8 Regional Performance Highlights
- 3.9 Technology and Industry Transformation
- 3.10 Competitive Landscape Summary
- 3.11 Analyst View and Strategic Implications
Chapter 4 Global Variable Reluctance Sensor Market Trends and Developments
- 4.1 Historical Industry Development
- 4.2 Recent Market Trends and Developments
- 4.3 Demand and Customer Behavior Trends
- 4.4 Technology and Product Innovation
- 4.5 Artificial Intelligence, Automation and Digitalization
- 4.6 Local Manufacturing and Supply Chain Realignment
- 4.7 Industry Partnerships, Mergers and Acquisitions
- 4.8 Sustainability and Circular Economy Developments
- 4.9 Government and Private Sector Investment Trends
- 4.10 Emerging Business Models and Commercialization
- 4.11 Industry Developments and Announcements
Chapter 5 Global Variable Reluctance Sensor Market Production, Supply and Demand Analysis
- 5.1 Demand Trend and Consumption Analysis
- 5.2 Demand Forecast, 2024-2032
- 5.3 Production and Output Trend
- 5.4 Production and Output Forecast, 2024-2032
- 5.5 Installed Capacity and Capacity Utilization
- 5.6 Company-Wise Production Plants and Statistics
- 5.6.1 Installed Production Capacity
- 5.6.2 Actual Production
- 5.6.3 Planned Capacity and Expansion Targets
- 5.7 Supply Chain Structure and Procurement Trends
- 5.8 Supply-Demand Gap and Bottlenecks
- 5.9 Import Dependence and Sourcing Structure
- 5.10 Contract Manufacturing and Outsourcing
- 5.11 Regional Supply and Demand Concentration
Chapter 6 Global Variable Reluctance Sensor Market Pricing Analysis
- 6.1 Pricing Structure and Measurement
- 6.2 Historical Pricing Trends
- 6.3 Pricing Outlook, 2024-2032
- 6.4 Average Selling Price and Unit Economics
- 6.5 Pricing by Product and Market Segment
- 6.6 Geographic Pricing Differences
- 6.7 Key Input, Energy, Labor and Logistics Costs
- 6.8 Contract Pricing and Purchasing Models
- 6.9 Pricing Sensitivity and Competitive Positioning
- 6.10 Price, Margin and Profitability Implications
Chapter 7 Global Variable Reluctance Sensor Market Dynamics
- 7.1 Market Growth Drivers
- 7.1.1 Demand-Side Drivers
- 7.1.2 Technology and Innovation Drivers
- 7.1.3 Infrastructure and Investment Drivers
- 7.1.4 Regulatory and Policy Drivers
- 7.2 Market Restraints
- 7.2.1 Cost and Affordability Constraints
- 7.2.2 Technology and Adoption Barriers
- 7.2.3 Supply Chain and Operational Constraints
- 7.3 Market Challenges
- 7.3.1 Competitive Pressure and Margin Erosion
- 7.3.2 Skills, Infrastructure and Implementation Gaps
- 7.4 Emerging Market Opportunities
- 7.5 Market Dynamics Impact and Time-Horizon Assessment
Chapter 8 Global Variable Reluctance Sensor Value Chain Analysis
- 8.1 Industry Value Chain Overview
- 8.2 Upstream Suppliers and Critical Inputs
- 8.3 Technology and Component Providers
- 8.4 Manufacturing or Service Delivery
- 8.5 Distribution, Channel Partners and Integrators
- 8.6 Downstream Applications and End Users
- 8.7 Value Addition and Profit Pools
- 8.8 Vertical Integration and Outsourcing
- 8.9 Supplier Concentration and Risk
- 8.10 Supply Chain Localization and Resilience
Chapter 9 Global Variable Reluctance Sensor Market Regulations and Policies
- 9.1 Relevant Laws, Standards and Compliance Frameworks
- 9.2 Product, Service, Safety and Quality Requirements
- 9.3 Government Policies, Incentives and Subsidies
- 9.4 Imports, Exports and Trade Barriers
- 9.5 Public Procurement and Local Content Requirements
- 9.6 Environmental and Sustainability Compliance
- 9.7 Upcoming Policy Changes and Market Implications
Chapter 10 Global Variable Reluctance Sensor Market Hotspots and Opportunities
- 10.1 Market Opportunity Mapping and Growth Hotspots
- 10.2 High-Growth Applications and Customer Groups
- 10.3 Underserved Markets and White-Space Opportunities
- 10.4 Emerging Technology and Product Opportunities
- 10.5 New Capacity and Investment Hotspots
- 10.6 Market Entry and Expansion Opportunities
- 10.7 Distribution and Partnership Opportunities
- 10.8 Near-Term and Long-Term Commercial Potential
- 10.9 Opportunity Attractiveness and Execution Risks
Chapter 11 Global Variable Reluctance Sensor Market Outlook, 2024-2032
- 11.1 Market Size and Analysis
- 11.1.1 Revenue (Market Measurement: 2024: USD 2.49 billion → 2032: USD 4.72 billion)
- 11.1.2 Market Volume and Quantity Sold
- 11.1.3 Historical Market Size
- 11.1.4 Base-Year Market Size, 2024
- 11.2 Market Forecast, 2024-2032
- 11.2.1 Revenue Forecast to 2032
- 11.2.2 Volume Forecast to 2032
- 11.2.3 CAGR and Year-on-Year Growth
- 11.2.4 Incremental Revenue Opportunity
- 11.3 Forecast Assumptions and Scenario Analysis
- 11.3.1 Base-Case Forecast
- 11.3.2 Optimistic and Conservative Scenarios
- 11.3.3 Technology, Pricing and Policy Sensitivities
- 11.4 Market Attractiveness and Growth Outlook
Chapter 12 Global Variable Reluctance Sensor Market Segmentation and Outlook
- 12.1 Segmentation Summary and Market Shares, 2024
- 12.2 Largest and Fastest-Growing Segments
- 12.3 By End Use - Market Size and Forecast, 2024-2032
- 12.3.1 Segment Definition and Scope
- 12.3.2 Historical Market Size
- 12.3.3 Revenue Forecast, 2024-2032
- 12.3.4 Volume Forecast, 2024-2032
- 12.3.5 Base-Year Market Share, 2024
- 12.3.6 Segment CAGR and Growth Drivers
- 12.3.7 Subsegment Market Size and Forecast
- 12.3.7.1 OEMs
- 12.3.7.2 Aftermarket
- 12.3.8 Subsegment Pricing and Adoption Trends
- 12.3.9 Leading Suppliers and Competition
- 12.3.10 Regional Demand and Opportunities
- 12.4 By Technology - Market Size and Forecast, 2024-2032
- 12.4.1 Segment Definition and Scope
- 12.4.2 Historical Market Size
- 12.4.3 Revenue Forecast, 2024-2032
- 12.4.4 Volume Forecast, 2024-2032
- 12.4.5 Base-Year Market Share, 2024
- 12.4.6 Segment CAGR and Growth Drivers
- 12.4.7 Subsegment Market Size and Forecast
- 12.4.7.1 Analog Sensors
- 12.4.7.2 Digital Sensors
- 12.4.8 Subsegment Pricing and Adoption Trends
- 12.4.9 Leading Suppliers and Competition
- 12.4.10 Regional Demand and Opportunities
- 12.5 By Application - Market Size and Forecast, 2024-2032
- 12.5.1 Segment Definition and Scope
- 12.5.2 Historical Market Size
- 12.5.3 Revenue Forecast, 2024-2032
- 12.5.4 Volume Forecast, 2024-2032
- 12.5.5 Base-Year Market Share, 2024
- 12.5.6 Segment CAGR and Growth Drivers
- 12.5.7 Subsegment Market Size and Forecast
- 12.5.7.1 Automotive
- 12.5.7.2 Aerospace
- 12.5.7.3 Industrial
- 12.5.7.4 Defense
- 12.5.8 Subsegment Pricing and Adoption Trends
- 12.5.9 Leading Suppliers and Competition
- 12.5.10 Regional Demand and Opportunities
- 12.6 Segment Growth Comparison
- 12.7 Segment Attractiveness and Priority Matrix
Chapter 13 Global Variable Reluctance Sensor End-Use and Application Market Outlook
- 13.1 End-Use Industry and Customer Demand Structure
- 13.2 Leading Applications and Customer Groups
- 13.3 End-Use Market Size, Share and Forecast
- 13.4 Major End-Use Industry Deep Dives
- 13.4.1 Customer Requirements and Use Cases
- 13.4.2 Demand and Replacement Cycles
- 13.4.3 Technical and Regulatory Considerations
- 13.4.4 Purchasing and Procurement Models
- 13.4.5 Leading Vendors and Distribution Channels
- 13.4.6 Forecast and Commercial Opportunities
- 13.5 Emerging Applications and Cross-Segment Demand
- 13.6 End-Use Industry Investment Priorities
Chapter 14 Global Variable Reluctance Sensor Geographic Market Outlook, 2024-2032
- 14.1 Regional Market Size and Share, 2024
- 14.2 Regional Market Forecast, 2024-2032
- 14.3 Regional Pricing, Production and Demand Differences
- 14.4 North America
- 14.4.1 United States
- 14.4.2 Canada
- 14.4.3 Mexico
- 14.5 Europe
- 14.5.1 Germany
- 14.5.2 France
- 14.5.3 Italy
- 14.5.4 United Kingdom
- 14.5.5 Spain
- 14.5.6 Poland
- 14.5.7 Russia
- 14.5.8 Netherlands
- 14.5.9 Belgium
- 14.5.10 Sweden
- 14.5.11 Denmark
- 14.5.12 Norway
- 14.5.13 Rest of Europe
- 14.6 Asia Pacific
- 14.6.1 China
- 14.6.2 India
- 14.6.3 Japan
- 14.6.4 South Korea
- 14.6.5 Thailand
- 14.6.6 Indonesia
- 14.6.7 Vietnam
- 14.6.8 Malaysia
- 14.6.9 Australia
- 14.6.10 Rest of Asia Pacific
- 14.7 Latin America
- 14.7.1 Brazil
- 14.7.2 Argentina
- 14.7.3 Colombia
- 14.7.4 Chile
- 14.7.5 Rest of Latin America
- 14.8 Middle East
- 14.8.1 Saudi Arabia
- 14.8.2 United Arab Emirates
- 14.8.3 Turkey
- 14.8.4 Israel
- 14.8.5 Iran
- 14.8.6 Rest of the Middle East
- 14.9 Africa
- 14.9.1 South Africa
- 14.9.2 Egypt
- 14.9.3 Nigeria
- 14.9.4 Morocco
- 14.9.5 Rest of Africa
- 14.10 Regional Investment, Policy and Supply Chain Differences
- 14.11 Regional Competitive Landscape
- 14.12 Geographic Growth Hotspots
Chapter 15 Global Variable Reluctance Sensor Technology, Innovation and Sustainability Outlook
- 15.1 Technology Landscape and Maturity
- 15.2 Product, Process and Service Innovation
- 15.3 AI, Automation and Digital Tools in the Industry
- 15.4 Technology Adoption and Performance Benchmarking
- 15.5 Innovation Pipeline and R&D Investment
- 15.6 Patent and Intellectual Property Trends
- 15.7 Energy Efficiency and Resource Management
- 15.8 Sustainability, Recycling and Circularity
- 15.9 Technology Roadmap, 2024-2032
- 15.10 Risks of Obsolescence and Technology Substitution
Chapter 16 Global Variable Reluctance Sensor Market Key Strategic Imperatives
- 16.1 Growth and Market Entry Priorities
- 16.2 High-Return Products and Segments
- 16.3 Pricing, Profitability and Cost Optimization
- 16.4 Technology Investment and Product Differentiation
- 16.5 Supply Chain Localization and Resilience
- 16.6 Distribution and Customer Acquisition
- 16.7 Partnership, Acquisition and Capacity Strategy
- 16.8 Regional Expansion Priorities
- 16.9 Short-, Medium- and Long-Term Actions
Chapter 17 Competition Outlook
- 17.1 Industry Competition Characteristics
- 17.2 Market Structure and Concentration
- 17.3 Market Share and Competitive Positioning, 2024
- 17.4 Company-Wise Revenue and Product Benchmarking
- 17.5 Production and Service Capacity Benchmarking
- 17.6 Technology, Pricing and Differentiation
- 17.7 Regional Footprint and Distribution Strength
- 17.8 Mergers, Acquisitions and Strategic Alliances
- 17.9 New Entrants and Competitive Threats
- 17.10 Porter's Five Forces and Industry Attractiveness
- 17.11 Competitive Outlook, 2024-2032
Chapter 18 Company Profiles
- 18.1 Company Coverage and Selection Criteria
- 18.2 Shinano Kenshi Co., Ltd.
- 18.2.1 Business Description
- 18.2.2 Company Ownership and Geographic Presence
- 18.2.3 Product and Service Portfolio
- 18.2.4 Manufacturing and Operating Footprint
- 18.2.5 Production Capacity and Expansion Plans
- 18.2.6 Financial Performance and Investment
- 18.2.7 Market Share and Competitive Position
- 18.2.8 Technology and Innovation Capabilities
- 18.2.9 Strategic Alliances or Partnerships
- 18.2.10 Recent Developments
- 18.2.11 Growth Strategy and Outlook
- 18.3 NIDEC CORPORATION
- 18.4 MinebeaMitsumi Inc.
- 18.5 MOONS
- 18.6 ORIENTAL MOTOR USA CORP.
- 18.7 TAMAGAWA SEIKI Co., Ltd.
- 18.8 SANYO DENKI CO., LTD.
- 18.9 Changzhou Fulling Motor Co., Ltd
- 18.10 Nippon Pulse America, Inc.
- 18.11 Other Relevant Market Participants
Note: Every listed company is profiled on the structure shown under the first company. The company list is preliminary and may change based on research findings, market developments, data availability and client requirements.
Chapter 19 Disclaimer
- 19.1 Research and Forecast Disclaimer
- 19.2 Data Source and Estimation Limitations
Note: The depth of individual sections depends on data availability for this market. Volume, capacity, trade and other unit-based metrics are included where applicable.
