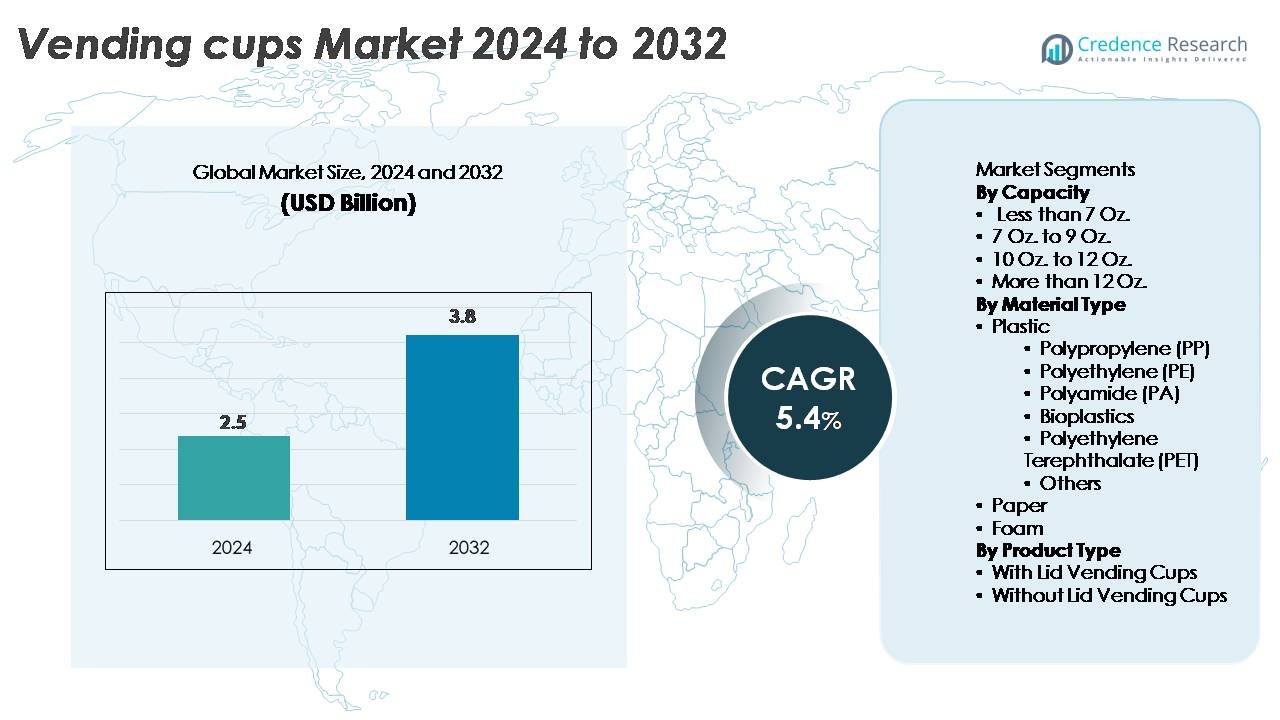
Table of Content
1. Preface
1.1. Report Description
1.1.1. Purpose of the Report
1.1.2. Target Audience
1.1.3. USP and Key Offerings
1.2. Research Scope
1.3. Market Introduction
2. Executive Summary
2.1. Market Snapshot: Global Vending Cups Market
2.1.1. Global Vending Cups Market, By Cup Type
2.1.2. Global Vending Cups Market, By Cup Size
2.1.3. Global Vending Cups Market, By Hot or Cold Beverage Cups
2.1.4. Global Vending Cups Market, By Lid Type
2.1.5. Global Vending Cups Market, By End Users
2.1.6. Global Vending Cups Market, By Custom Printing and Branding
2.1.7. Global Vending Cups Market, By Region
2.2. Insights from Primary Respondents
3. Market Dynamics & Factors Analysis
3.1. Introduction
3.1.1. Global Vending Cups Market Value, 2017-2030, (US$ Mn)
3.1.2. Y-o-Y Growth Trend Analysis
3.2. Market Dynamics
3.2.1. Vending Cups Market Drivers
3.2.2. Vending Cups Market Restraints
3.2.3. Vending Cups Market Opportunities
3.2.4. Major Vending Cups Industry Challenges
3.3. Growth and Development Patterns
3.4. Investment Feasibility Analysis
3.5. Market Opportunity Analysis
3.5.1. Cup Type
3.5.2. Cup Size
3.5.3. Hot or Cold Beverage Cups
3.5.4. Lid Type
3.5.5. End Users
3.5.6. Custom Printing and Branding
3.5.7. Geography
4. Market Competitive Landscape Analysis
4.1. Company Market Share Analysis, 2022
4.1.1. Global Vending Cups Market: Company Market Share, Value 2022
4.1.2. Global Vending Cups Market: Top 6 Company Market Share, Value 2022
4.1.3. Global Vending Cups Market: Top 3 Company Market Share, Value 2022
4.2. Global Vending Cups Market: Company Revenue Share Analysis, 2022
4.3. Company Assessment Metrics, 2022
4.3.1. Stars
4.3.2. Emerging Leaders
4.3.3. Pervasive Players
4.3.4. Participants
4.4. Startups/ SMEs Assessment Metrics, 2022
4.4.1. Progressive Companies
4.4.2. Responsive Companies
4.4.3. Dynamic Companies
4.4.4. Starting Blocks
4.5. Strategic Development
4.5.1. Acquisition and Mergers
4.5.2. New Product Launch
4.5.3. Regional Expansion
4.5.4. Partnerships
4.6. Key Player Product Matrix
4.7. Potential for New Players in the Global Vending Cups Market
5. Premium Insights
5.1. STAR (Situation, Task, Action, Results) Analysis
5.2. Porter’s Five Forces Analysis
5.2.1. Threat of New Entrants
5.2.2. Bargaining Power of Buyers/Consumers
5.2.3. Bargaining Power of Suppliers
5.2.4. Threat of Substitute Types
5.2.5. Intensity of Competitive Rivalry
5.3. PESTEL Analysis
5.3.1. Political Factors
5.3.2. Economic Factors
5.3.3. Social Factors
5.3.4. Technological Factors
5.3.5. Environmental Factors
5.3.6. Legal Factors
5.4. Key Market Trends
5.4.1. Demand Side Trends
5.4.2. Supply Side Trends
5.5. Value Chain Analysis
5.6. Technology Analysis
5.6.1. Research and development in the global market
5.6.2. Patent Analysis
5.6.3. Emerging technologies and their potential disruption to the market
5.7. Consumer Behaviour Analysis
5.7.1. Consumer Preferences and Expectations
5.7.2. Factors Influencing Consumer Buying Decisions
5.7.2.1. North America
5.7.2.2. Europe
5.7.2.3. Asia Pacific
5.7.2.4. Latin America
5.7.2.5. Middle East and Africa
5.7.3. Consumer Pain Points
5.8. Analysis and Recommendations
5.9. Adjacent Market Analysis
6. Market Positioning of Key Players, 2022
6.1. Company market share of key players, 2022
6.2. Competitive Benchmarking
6.3. Market Positioning of Key Vendors
6.4. Geographical Presence Analysis
6.5. Major Strategies Adopted by Key Players
6.5.1. Key Strategies Analysis
6.5.2. Mergers and Acquisitions
6.5.3. Partnerships
6.5.4. Product Launch
6.5.5. Geographical Expansion
6.5.6. Others
7. Impact Analysis of COVID 19 and Russia – Ukraine War on Vending Cups Market
7.1. Ukraine-Russia War Impact
7.1.1. Uncertainty and Economic Instability
7.1.2. Supply chain disruptions
7.1.3. Regional market shifts
7.1.4. Shift in government priorities
7.2. COVID-19 Impact Analysis
7.2.1. Supply Chain Disruptions
7.2.2. Demand Fluctuations
7.2.3. Shift in Product Mix
7.2.4. Reduced Industrial Activity
7.2.5. Regional Impact Analysis
7.2.5.1. North America
7.2.5.2. Europe
7.2.5.3. Asia Pacific
7.2.5.4. Latin America
7.2.5.5. Middle East and Africa
8. Global Vending Cups Market, By Cup Type
8.1. Global Vending Cups Market Overview, by Cup Type
8.1.1. Global Vending Cups Market Revenue Share, By Cup Type, 2022 Vs 2030 (in %)
8.2. Paper Cups
8.2.1. Global Vending Cups Market, By Paper Cups, By Region, 2017-2030 (US$ Mn)
8.2.2. Market Dynamics for Paper Cups
8.2.2.1. Drivers
8.2.2.2. Restraints
8.2.2.3. Opportunities
8.2.2.4. Trends
8.3. Plastic Cups
8.3.1. Global Vending Cups Market, By Plastic Cups, By Region, 2017-2030 (US$ Mn)
8.3.2. Market Dynamics for Plastic Cups
8.3.2.1. Drivers
8.3.2.2. Restraints
8.3.2.3. Opportunities
8.3.2.4. Trends
8.4. Foam Cups
8.4.1. Global Vending Cups Market, By Foam Cups, By Region, 2017-2030 (US$ Mn)
8.4.2. Market Dynamics for Foam Cups
8.4.2.1. Drivers
8.4.2.2. Restraints
8.4.2.3. Opportunities
8.4.2.4. Trends
8.5. Biodegradable Cups
8.5.1. Global Vending Cups Market, By Biodegradable Cups, By Region, 2017-2030 (US$ Mn)
8.5.2. Market Dynamics for Biodegradable Cups
8.5.2.1. Drivers
8.5.2.2. Restraints
8.5.2.3. Opportunities
8.5.2.4. Trends
8.6. Styrofoam Cups
8.6.1. Global Vending Cups Market, By Styrofoam Cups, By Region, 2017-2030 (US$ Mn)
8.6.2. Market Dynamics for Styrofoam Cups
8.6.2.1. Drivers
8.6.2.2. Restraints
8.6.2.3. Opportunities
8.6.2.4. Trends
8.7. Metal Cups
8.7.1. Global Vending Cups Market, By Metal Cups, By Region, 2017-2030 (US$ Mn)
8.7.2. Market Dynamics for Metal Cups
8.7.2.1. Drivers
8.7.2.2. Restraints
8.7.2.3. Opportunities
8.7.2.4. Trends
8.8. Glass Cups
8.8.1. Global Vending Cups Market, By Glass Cups, By Region, 2017-2030 (US$ Mn)
8.8.2. Market Dynamics for Glass Cups
8.8.2.1. Drivers
8.8.2.2. Restraints
8.8.2.3. Opportunities
8.8.2.4. Trends
9. Global Vending Cups Market, By Cup Size
9.1. Global Vending Cups Market Overview, by Cup Size
9.1.1. Global Vending Cups Market Revenue Share, By Cup Size, 2022 Vs 2030 (in %)
9.2. Small Cups (Less than 8 ounces)
9.2.1. Global Vending Cups Market, By Small Cups (Less than 8 ounces), By Region, 2017-2030 (US$ Mn)
9.2.2. Market Dynamics for Small Cups (Less than 8 ounces)
9.2.2.1. Drivers
9.2.2.2. Restraints
9.2.2.3. Opportunities
9.2.2.4. Trends
9.3. Medium Cups (8 to 16 ounces)
9.3.1. Global Vending Cups Market, By Medium Cups (8 to 16 ounces), By Region, 2017-2030 (US$ Mn)
9.3.2. Market Dynamics for Medium Cups (8 to 16 ounces)
9.3.2.1. Drivers
9.3.2.2. Restraints
9.3.2.3. Opportunities
9.3.2.4. Trends
9.4. Large Cups (More than 16 ounces)
9.4.1. Global Vending Cups Market, By Large Cups (More than 16 ounces), By Region, 2017-2030 (US$ Mn)
9.4.2. Market Dynamics for Large Cups (More than 16 ounces)
9.4.2.1. Drivers
9.4.2.2. Restraints
9.4.2.3. Opportunities
9.4.2.4. Trends
9.5. Custom Sizes
9.5.1. Global Vending Cups Market, By Custom Sizes, By Region, 2017-2030 (US$ Mn)
9.5.2. Market Dynamics for Custom Sizes
9.5.2.1. Drivers
9.5.2.2. Restraints
9.5.2.3. Opportunities
9.5.2.4. Trends
10. Global Vending Cups Market, By Hot or Cold Beverage Cups
10.1. Global Vending Cups Market Overview, by Hot or Cold Beverage Cups
10.1.1. Global Vending Cups Market Revenue Share, By Hot or Cold Beverage Cups, 2022 Vs 2030 (in %)
10.2. Hot Beverage Cups
10.2.1. Global Vending Cups Market, By Hot Beverage Cups, By Region, 2017-2030 (US$ Mn)
10.2.2. Market Dynamics for Hot Beverage Cups
10.2.2.1. Drivers
10.2.2.2. Restraints
10.2.2.3. Opportunities
10.2.2.4. Trends
10.3. Cold Beverage Cups
10.3.1. Global Vending Cups Market, By Cold Beverage Cups, By Region, 2017-2030 (US$ Mn)
10.3.2. Market Dynamics for Cold Beverage Cups
10.3.2.1. Drivers
10.3.2.2. Restraints
10.3.2.3. Opportunities
10.3.2.4. Trends
10.4. Dual-Use Cups
10.4.1. Global Vending Cups Market, By Dual-Use Cups, By Region, 2017-2030 (US$ Mn)
10.4.2. Market Dynamics for Dual-Use Cups
10.4.2.1. Drivers
10.4.2.2. Restraints
10.4.2.3. Opportunities
10.4.2.4. Trends
11. Global Vending Cups Market, By Lid Type
11.1. Global Vending Cups Market Overview, by Lid Type
11.1.1. Global Vending Cups Market Revenue Share, By Lid Type, 2022 Vs 2030 (in %)
11.2. Standard Lids
11.2.1. Global Vending Cups Market, By Standard Lids, By Region, 2017-2030 (US$ Mn)
11.2.2. Market Dynamics for Standard Lids
11.2.2.1. Drivers
11.2.2.2. Restraints
11.2.2.3. Opportunities
11.2.2.4. Trends
11.3. Sip-Through Lids
11.3.1. Global Vending Cups Market, By Sip-Through Lids, By Region, 2017-2030 (US$ Mn)
11.3.2. Market Dynamics for Sip-Through Lids
11.3.2.1. Drivers
11.3.2.2. Restraints
11.3.2.3. Opportunities
11.3.2.4. Trends
11.4. Sealed Lids
11.4.1. Global Vending Cups Market, By Sealed Lids, By Region, 2017-2030 (US$ Mn)
11.4.2. Market Dynamics for Sealed Lids
11.4.2.1. Drivers
11.4.2.2. Restraints
11.4.2.3. Opportunities
11.4.2.4. Trends
11.5. Straw Slot Lids
11.5.1. Global Vending Cups Market, By Straw Slot Lids, By Region, 2017-2030 (US$ Mn)
11.5.2. Market Dynamics for Straw Slot Lids
11.5.2.1. Drivers
11.5.2.2. Restraints
11.5.2.3. Opportunities
11.5.2.4. Trends
11.6. Cup Jackets
11.6.1. Global Vending Cups Market, By Cup Jackets, By Region, 2017-2030 (US$ Mn)
11.6.2. Market Dynamics for Cup Jackets
11.6.2.1. Drivers
11.6.2.2. Restraints
11.6.2.3. Opportunities
11.6.2.4. Trends
11.7. Stirrer/Stick Holder Lids
11.7.1. Global Vending Cups Market, By Stirrer/Stick Holder Lids, By Region, 2017-2030 (US$ Mn)
11.7.2. Market Dynamics for Stirrer/Stick Holder Lids
11.7.2.1. Drivers
11.7.2.2. Restraints
11.7.2.3. Opportunities
11.7.2.4. Trends
12. Global Vending Cups Market, By End Users
12.1. Global Vending Cups Market Overview, by End Users
12.1.1. Global Vending Cups Market Revenue Share, By End Users, 2022 Vs 2030 (in %)
12.2. Vending Machines
12.2.1. Global Vending Cups Market, By Vending Machines, By Region, 2017-2030 (US$ Mn)
12.2.2. Market Dynamics for Vending Machines
12.2.2.1. Drivers
12.2.2.2. Restraints
12.2.2.3. Opportunities
12.2.2.4. Trends
12.3. Foodservice Providers
12.3.1. Global Vending Cups Market, By Foodservice Providers, By Region, 2017-2030 (US$ Mn)
12.3.2. Market Dynamics for Foodservice Providers
12.3.2.1. Drivers
12.3.2.2. Restraints
12.3.2.3. Opportunities
12.3.2.4. Trends
12.4. Offices and Corporate Settings
12.4.1. Global Vending Cups Market, By Offices and Corporate Settings, By Region, 2017-2030 (US$ Mn)
12.4.2. Market Dynamics for Offices and Corporate Settings
12.4.2.1. Drivers
12.4.2.2. Restraints
12.4.2.3. Opportunities
12.4.2.4. Trends
12.5. Retail Outlets
12.5.1. Global Vending Cups Market, By Retail Outlets, By Region, 2017-2030 (US$ Mn)
12.5.2. Market Dynamics for Retail Outlets
12.5.2.1. Drivers
12.5.2.2. Restraints
12.5.2.3. Opportunities
12.5.2.4. Trends
12.6. Events and Conferences
12.6.1. Global Vending Cups Market, By Events and Conferences, By Region, 2017-2030 (US$ Mn)
12.6.2. Market Dynamics for Events and Conferences
12.6.2.1. Drivers
12.6.2.2. Restraints
12.6.2.3. Opportunities
12.6.2.4. Trends
12.7. Other Institutional Buyers
12.7.1. Global Vending Cups Market, By Other Institutional Buyers, By Region, 2017-2030 (US$ Mn)
12.7.2. Market Dynamics for Other Institutional Buyers
12.7.2.1. Drivers
12.7.2.2. Restraints
12.7.2.3. Opportunities
12.7.2.4. Trends
13. Global Vending Cups Market, By Custom Printing and Branding
13.1. Global Vending Cups Market Overview, by Custom Printing and Branding
13.1.1. Global Vending Cups Market Revenue Share, By Custom Printing and Branding, 2022 Vs 2030 (in %)
13.2. Custom-Printed Cups
13.2.1. Global Vending Cups Market, By Custom-Printed Cups, By Region, 2017-2030 (US$ Mn)
13.2.2. Market Dynamics for Custom-Printed Cups
13.2.2.1. Drivers
13.2.2.2. Restraints
13.2.2.3. Opportunities
13.2.2.4. Trends
13.3. Plain Cups
13.3.1. Global Vending Cups Market, By Plain Cups, By Region, 2017-2030 (US$ Mn)
13.3.2. Market Dynamics for Plain Cups
13.3.2.1. Drivers
13.3.2.2. Restraints
13.3.2.3. Opportunities
13.3.2.4. Trends
14. Global Vending Cups Market, By Region
14.1. Global Vending Cups Market Overview, by Region
14.1.1. Global Vending Cups Market, By Region, 2022 vs 2030 (in%)
14.2. Cup Type
14.2.1. Global Vending Cups Market, By Cup Type, 2017-2030 (US$ Mn)
14.3. Cup Size
14.3.1. Global Vending Cups Market, By Cup Size, 2017-2030 (US$ Mn)
14.4. Hot or Cold Beverage Cups
14.4.1. Global Vending Cups Market, By Hot or Cold Beverage Cups, 2017-2030 (US$ Mn)
14.5. Lid Type
14.5.1. Global Vending Cups Market, By Lid Type, 2017-2030 (US$ Mn)
14.6. End Users
14.6.1. Global Vending Cups Market, By End Users, 2017-2030 (US$ Mn)
14.7. Custom Printing and Branding
14.7.1. Global Vending Cups Market, By Custom Printing and Branding, 2017-2030 (US$ Mn)
15. North America Vending Cups Market Analysis
15.1. Overview
15.1.1. Market Dynamics for North America
15.1.1.1. Drivers
15.1.1.2. Restraints
15.1.1.3. Opportunities
15.1.1.4. Trends
15.2. North America Vending Cups Market, by Cup Type, 2017-2030(US$ Mn)
15.2.1. Overview
15.2.2. SRC Analysis
15.3. North America Vending Cups Market, by Cup Size, 2017-2030(US$ Mn)
15.3.1. Overview
15.3.2. SRC Analysis
15.4. North America Vending Cups Market, by Hot or Cold Beverage Cups, 2017-2030(US$ Mn)
15.4.1. Overview
15.4.2. SRC Analysis
15.5. North America Vending Cups Market, by Lid Type, 2017-2030(US$ Mn)
15.5.1. Overview
15.5.2. SRC Analysis
15.6. North America Vending Cups Market, by End Users, 2017-2030(US$ Mn)
15.6.1. Overview
15.6.2. SRC Analysis
15.7. North America Vending Cups Market, by Custom Printing and Branding, 2017-2030(US$ Mn)
15.7.1. Overview
15.7.2. SRC Analysis
15.8. North America Vending Cups Market, by Country, 2017-2030 (US$ Mn)
15.8.1. North America Vending Cups Market, by Country, 2022 Vs 2030 (in%)
15.8.2. U.S.
15.8.3. Canada
15.8.4. Mexico
16. Europe Vending Cups Market Analysis
16.1. Overview
16.1.1. Market Dynamics for Europe
16.1.1.1. Drivers
16.1.1.2. Restraints
16.1.1.3. Opportunities
16.1.1.4. Trends
16.2. Europe Vending Cups Market, by Cup Type, 2017-2030(US$ Mn)
16.2.1. Overview
16.2.2. SRC Analysis
16.3. Europe Vending Cups Market, by Cup Size, 2017-2030(US$ Mn)
16.3.1. Overview
16.3.2. SRC Analysis
16.4. Europe Vending Cups Market, by Hot or Cold Beverage Cups, 2017-2030(US$ Mn)
16.4.1. Overview
16.4.2. SRC Analysis
16.5. Europe Vending Cups Market, by Lid Type, 2017-2030(US$ Mn)
16.5.1. Overview
16.5.2. SRC Analysis
16.6. Europe Vending Cups Market, by End Users, 2017-2030(US$ Mn)
16.6.1. Overview
16.6.2. SRC Analysis
16.7. Europe Vending Cups Market, by Custom Printing and Branding, 2017-2030(US$ Mn)
16.7.1. Overview
16.7.2. SRC Analysis
16.8. Europe Vending Cups Market, by Country, 2017-2030 (US$ Mn)
16.8.1. Europe Vending Cups Market, by Country, 2022 Vs 2030 (in%)
16.8.2. UK
16.8.3. France
16.8.4. Germany
16.8.5. Italy
16.8.6. Spain
16.8.7. Benelux
16.8.8. Russia
16.8.9. Rest of Europe
17. Asia Pacific Vending Cups Market Analysis
17.1. Overview
17.1.1. Market Dynamics for Asia Pacific
17.1.1.1. Drivers
17.1.1.2. Restraints
17.1.1.3. Opportunities
17.1.1.4. Trends
17.2. Asia Pacific Vending Cups Market, by Cup Type, 2017-2030(US$ Mn)
17.2.1. Overview
17.2.2. SRC Analysis
17.3. Asia Pacific Vending Cups Market, by Cup Size, 2017-2030(US$ Mn)
17.3.1. Overview
17.3.2. SRC Analysis
17.4. Asia Pacific Vending Cups Market, by Hot or Cold Beverage Cups, 2017-2030(US$ Mn)
17.4.1. Overview
17.4.2. SRC Analysis
17.5. Asia Pacific Vending Cups Market, by Lid Type, 2017-2030(US$ Mn)
17.5.1. Overview
17.5.2. SRC Analysis
17.6. Asia Pacific Vending Cups Market, by End Users, 2017-2030(US$ Mn)
17.6.1. Overview
17.6.2. SRC Analysis
17.7. Asia Pacific Vending Cups Market, by Custom Printing and Branding, 2017-2030(US$ Mn)
17.7.1. Overview
17.7.2. SRC Analysis
17.8. Asia Pacific Vending Cups Market, by Country, 2017-2030 (US$ Mn)
17.8.1. Asia Pacific Vending Cups Market, by Country, 2022 Vs 2030 (in%)
17.8.2. China
17.8.3. Japan
17.8.4. India
17.8.5. South Korea
17.8.6. South East Asia
17.8.7. Rest of Asia Pacific
18. Latin America Vending Cups Market Analysis
18.1. Overview
18.1.1. Market Dynamics for Latin America
18.1.1.1. Drivers
18.1.1.2. Restraints
18.1.1.3. Opportunities
18.1.1.4. Trends
18.2. Latin America Vending Cups Market, by Cup Type, 2017-2030(US$ Mn)
18.2.1. Overview
18.2.2. SRC Analysis
18.3. Latin America Vending Cups Market, by Cup Size, 2017-2030(US$ Mn)
18.3.1. Overview
18.3.2. SRC Analysis
18.4. Latin America Vending Cups Market, by Hot or Cold Beverage Cups, 2017-2030(US$ Mn)
18.4.1. Overview
18.4.2. SRC Analysis
18.5. Latin America Vending Cups Market, by Lid Type, 2017-2030(US$ Mn)
18.5.1. Overview
18.5.2. SRC Analysis
18.6. Latin America Vending Cups Market, by End Users, 2017-2030(US$ Mn)
18.6.1. Overview
18.6.2. SRC Analysis
18.7. Latin America Vending Cups Market, by Custom Printing and Branding, 2017-2030(US$ Mn)
18.7.1. Overview
18.7.2. SRC Analysis
18.8. Latin America Vending Cups Market, by Country, 2017-2030 (US$ Mn)
18.8.1. Latin America Vending Cups Market, by Country, 2022 Vs 2030 (in%)
18.8.2. Brazil
18.8.3. Argentina
18.8.4. Rest of Latin America
19. Middle East Vending Cups Market Analysis
19.1. Overview
19.1.1. Market Dynamics for Middle East
19.1.1.1. Drivers
19.1.1.2. Restraints
19.1.1.3. Opportunities
19.1.1.4. Trends
19.2. Middle East Vending Cups Market, by Cup Type, 2017-2030(US$ Mn)
19.2.1. Overview
19.2.2. SRC Analysis
19.3. Middle East Vending Cups Market, by Cup Size, 2017-2030(US$ Mn)
19.3.1. Overview
19.3.2. SRC Analysis
19.4. Middle East Vending Cups Market, by Hot or Cold Beverage Cups, 2017-2030(US$ Mn)
19.4.1. Overview
19.4.2. SRC Analysis
19.5. Middle East Vending Cups Market, by Lid Type, 2017-2030(US$ Mn)
19.5.1. Overview
19.5.2. SRC Analysis
19.6. Middle East Vending Cups Market, by End Users, 2017-2030(US$ Mn)
19.6.1. Overview
19.6.2. SRC Analysis
19.7. Middle East Vending Cups Market, by Custom Printing and Branding, 2017-2030(US$ Mn)
19.7.1. Overview
19.7.2. SRC Analysis
19.8. Middle East Vending Cups Market, by Country, 2017-2030 (US$ Mn)
19.8.1. Middle East Vending Cups Market, by Country, 2022 Vs 2030 (in%)
19.8.2. UAE
19.8.3. Saudi Arabia
19.8.4. Rest of Middle East
20. Africa Vending Cups Market Analysis
20.1. Overview
20.1.1. Market Dynamics for Africa
20.1.1.1. Drivers
20.1.1.2. Restraints
20.1.1.3. Opportunities
20.1.1.4. Trends
20.2. Africa Vending Cups Market, by Cup Type, 2017-2030(US$ Mn)
20.2.1. Overview
20.2.2. SRC Analysis
20.3. Africa Vending Cups Market, by Cup Size, 2017-2030(US$ Mn)
20.3.1. Overview
20.3.2. SRC Analysis
20.4. Africa Vending Cups Market, by Hot or Cold Beverage Cups, 2017-2030(US$ Mn)
20.4.1. Overview
20.4.2. SRC Analysis
20.5. Africa Vending Cups Market, by Lid Type, 2017-2030(US$ Mn)
20.5.1. Overview
20.5.2. SRC Analysis
20.6. Africa Vending Cups Market, by End Users, 2017-2030(US$ Mn)
20.6.1. Overview
20.6.2. SRC Analysis
20.7. Africa Vending Cups Market, by Custom Printing and Branding, 2017-2030(US$ Mn)
20.7.1. Overview
20.7.2. SRC Analysis
20.8. Africa Vending Cups Market, by Country, 2017-2030 (US$ Mn)
20.8.1. Africa Vending Cups Market, by Country, 2022 Vs 2030 (in%)
20.8.2. South Africa
20.8.3. Egypt
20.8.4. Rest of Africa
21. Company Profiles
21.1. Huhtamaki
21.1.1. Company Overview
21.1.2. Products/Services Portfolio
21.1.3. Geographical Presence
21.1.4. SWOT Analysis
21.1.5. Financial Summary
21.1.5.1. Market Revenue and Net Profit (2019-2022)
21.1.5.2. Business Segment Revenue Analysis
21.1.5.3. Geographical Revenue Analysis
21.2. Coveris Holdings
21.3. MPM Marketing Services
21.4. Dispo International
21.5. Nupik-flo UK Ltd
21.6. New WinCup Holdings
21.7. SwissPrimePack
21.8. Benders Paper Cups
21.9. Golden Paper Cups Manufacturing
21.10. Hosti GmbH (RPC Tedeco Gizeh)
21.11. Moducup LLC
21.12. Printed Cup Company
21.13. Regalzone LLP
21.14. Others
22. Research Methodology
22.1. Research Methodology
22.2. Phase I – Secondary Research
22.3. Phase II – Data Modelling
22.3.1. Company Share Analysis Model
22.3.2. Revenue Based Modelling
22.4. Phase III – Primary Research
22.5. Research Limitations
22.5.1. Assumptions
List of Figures
FIG. 1 Global Vending Cups Market: Research Methodology
FIG. 2 Market Size Estimation – Top Down & Bottom up Approach
FIG. 3 Global Vending Cups Market Segmentation
FIG. 4 Global Vending Cups Market, by Cup Type, 2022 (US$ Mn)
FIG. 5 Global Vending Cups Market, by Cup Size, 2022 (US$ Mn)
FIG. 6 Global Vending Cups Market, by Hot or Cold Beverage Cups, 2022 (US$ Mn)
FIG. 7 Global Vending Cups Market, by Lid Type, 2022 (US$ Mn)
FIG. 8 Global Vending Cups Market, by End Users, 2022 (US$ Mn)
FIG. 9 Global Vending Cups Market, by Custom Printing and Branding, 2022 (US$ Mn)
FIG. 10 Global Vending Cups Market, by Geography, 2022 (US$ Mn)
FIG. 11 Attractive Investment Proposition, by Cup Type, 2022
FIG. 12 Attractive Investment Proposition, by Cup Size, 2022
FIG. 13 Attractive Investment Proposition, by Hot or Cold Beverage Cups, 2022
FIG. 14 Attractive Investment Proposition, by Lid Type, 2022
FIG. 15 Attractive Investment Proposition, by End Users, 2022
FIG. 16 Attractive Investment Proposition, by Custom Printing and Branding, 2022
FIG. 17 Attractive Investment Proposition, by Geography, 2022
FIG. 18 Global Market Share Analysis of Key Vending Cups Market Manufacturers, 2022
FIG. 19 Global Market Positioning of Key Vending Cups Market Manufacturers, 2022
FIG. 20 Global Vending Cups Market Value Contribution, By Cup Type, 2022 & 2030 (Value %)
FIG. 21 Global Vending Cups Market, by Paper Cups, Value, 2017-2030 (US$ Mn)
FIG. 22 Global Vending Cups Market, by Plastic Cups, Value, 2017-2030 (US$ Mn)
FIG. 23 Global Vending Cups Market, by Foam Cups, Value, 2017-2030 (US$ Mn)
FIG. 24 Global Vending Cups Market, by Biodegradable Cups, Value, 2017-2030 (US$ Mn)
FIG. 25 Global Vending Cups Market, by Styrofoam Cups, Value, 2017-2030 (US$ Mn)
FIG. 26 Global Vending Cups Market, by Metal Cups, Value, 2017-2030 (US$ Mn)
FIG. 27 Global Vending Cups Market, by Glass Cups, Value, 2017-2030 (US$ Mn)
FIG. 28 Global Vending Cups Market Value Contribution, By Cup Size, 2022 & 2030 (Value %)
FIG. 29 Global Vending Cups Market, by Small Cups (Less than 8 ounces), Value, 2017-2030 (US$ Mn)
FIG. 30 Global Vending Cups Market, by Medium Cups (8 to 16 ounces), Value, 2017-2030 (US$ Mn)
FIG. 31 Global Vending Cups Market, by Large Cups (More than 16 ounces), Value, 2017-2030 (US$ Mn)
FIG. 32 Global Vending Cups Market, by Custom Sizes, Value, 2017-2030 (US$ Mn)
FIG. 33 Global Vending Cups Market Value Contribution, By Hot or Cold Beverage Cups, 2022 & 2030 (Value %)
FIG. 34 Global Vending Cups Market, by Hot Beverage Cups, Value, 2017-2030 (US$ Mn)
FIG. 35 Global Vending Cups Market, by Cold Beverage Cups, Value, 2017-2030 (US$ Mn)
FIG. 36 Global Vending Cups Market, by Dual-Use Cups, Value, 2017-2030 (US$ Mn)
FIG. 37 Global Vending Cups Market Value Contribution, By Lid Type, 2022 & 2030 (Value %)
FIG. 38 Global Vending Cups Market, by Standard Lids, Value, 2017-2030 (US$ Mn)
FIG. 39 Global Vending Cups Market, by Sip-Through Lids, Value, 2017-2030 (US$ Mn)
FIG. 40 Global Vending Cups Market, by Sealed Lids, Value, 2017-2030 (US$ Mn)
FIG. 41 Global Vending Cups Market, by Straw Slot Lids, Value, 2017-2030 (US$ Mn)
FIG. 42 Global Vending Cups Market, by Cup Jackets, Value, 2017-2030 (US$ Mn)
FIG. 43 Global Vending Cups Market, by Stirrer/Stick Holder Lids, Value, 2017-2030 (US$ Mn)
FIG. 44 Global Vending Cups Market Value Contribution, By End Users, 2022 & 2030 (Value %)
FIG. 45 Global Vending Cups Market, by Vending Machines, Value, 2017-2030 (US$ Mn)
FIG. 46 Global Vending Cups Market, by Foodservice Providers, Value, 2017-2030 (US$ Mn)
FIG. 47 Global Vending Cups Market, by Offices and Corporate Settings, Value, 2017-2030 (US$ Mn)
FIG. 48 Global Vending Cups Market, by Retail Outlets, Value, 2017-2030 (US$ Mn)
FIG. 49 Global Vending Cups Market, by Events and Conferences, Value, 2017-2030 (US$ Mn)
FIG. 50 Global Vending Cups Market, by Other Institutional Buyers, Value, 2017-2030 (US$ Mn)
FIG. 51 Global Vending Cups Market Value Contribution, By Custom Printing and Branding, 2022 & 2030 (Value %)
FIG. 52 Global Vending Cups Market, by Custom-Printed Cups, Value, 2017-2030 (US$ Mn)
FIG. 53 Global Vending Cups Market, by Plain Cups, Value, 2017-2030 (US$ Mn)
FIG. 54 North America Vending Cups Market, 2017-2030 (US$ Mn)
FIG. 55 U.S. Vending Cups Market, 2017-2030 (US$ Mn)
FIG. 56 Canada Vending Cups Market, 2017-2030 (US$ Mn)
FIG. 57 Mexico Vending Cups Market, 2017-2030 (US$ Mn)
FIG. 58 Europe Vending Cups Market, 2017-2030 (US$ Mn)
FIG. 59 Germany Vending Cups Market, 2017-2030 (US$ Mn)
FIG. 60 France Vending Cups Market, 2017-2030 (US$ Mn)
FIG. 61 U.K. Vending Cups Market, 2017-2030 (US$ Mn)
FIG. 62 Italy Vending Cups Market, 2017-2030 (US$ Mn)
FIG. 63 Spain Vending Cups Market, 2017-2030 (US$ Mn)
FIG. 64 Benelux Vending Cups Market, 2017-2030 (US$ Mn)
FIG. 65 Russia Vending Cups Market, 2017-2030 (US$ Mn)
FIG. 66 Rest of Europe Vending Cups Market, 2017-2030 (US$ Mn)
FIG. 67 Asia Pacific Vending Cups Market, 2017-2030 (US$ Mn)
FIG. 68 China Vending Cups Market, 2017-2030 (US$ Mn)
FIG. 69 Japan Vending Cups Market, 2017-2030 (US$ Mn)
FIG. 70 India Vending Cups Market, 2017-2030 (US$ Mn)
FIG. 71 South Korea Vending Cups Market, 2017-2030 (US$ Mn)
FIG. 72 South-East Asia Vending Cups Market, 2017-2030 (US$ Mn)
FIG. 73 Rest of Asia Pacific Vending Cups Market, 2017-2030 (US$ Mn)
FIG. 74 Latin America Vending Cups Market, 2017-2030 (US$ Mn)
FIG. 75 Brazil Vending Cups Market, 2017-2030 (US$ Mn)
FIG. 76 Argentina Vending Cups Market, 2017-2030 (US$ Mn)
FIG. 77 Rest of Latin America Vending Cups Market, 2017-2030 (US$ Mn)
FIG. 78 Middle East Vending Cups Market, 2017-2030 (US$ Mn)
FIG. 79 UAE Vending Cups Market, 2017-2030 (US$ Mn)
FIG. 80 Saudi Arabia Vending Cups Market, 2017-2030 (US$ Mn)
FIG. 81 Rest of Middle East Vending Cups Market, 2017-2030 (US$ Mn)
FIG. 82 Africa Vending Cups Market, 2017-2030 (US$ Mn)
FIG. 83 South Africa Vending Cups Market, 2017-2030 (US$ Mn)
FIG. 84 Egypt Vending Cups Market, 2017-2030 (US$ Mn)
FIG. 85 Rest of Africa Vending Cups Market, 2017-2030 (US$ Mn)
List of Tables
TABLE 1 Market Snapshot: Global Vending Cups Market
TABLE 2 Global Vending Cups Market: Market Drivers Impact Analysis
TABLE 3 Global Vending Cups Market: Market Restraints Impact Analysis
TABLE 4 Global Vending Cups Market, by Competitive Benchmarking, 2022
TABLE 5 Global Vending Cups Market, by Geographical Presence Analysis, 2022
TABLE 6 Global Vending Cups Market, by Key Strategies Analysis, 2022
TABLE 7 Global Vending Cups Market, by Paper Cups, By Region, 2017-2022 (US$ Mn)
TABLE 8 Global Vending Cups Market, by Paper Cups, By Region, 2023-2030 (US$ Mn)
TABLE 9 Global Vending Cups Market, by Plastic Cups, By Region, 2017-2022 (US$ Mn)
TABLE 10 Global Vending Cups Market, by Plastic Cups, By Region, 2023-2030 (US$ Mn)
TABLE 11 Global Vending Cups Market, by Foam Cups, By Region, 2017-2022 (US$ Mn)
TABLE 12 Global Vending Cups Market, by Foam Cups, By Region, 2023-2030 (US$ Mn)
TABLE 13 Global Vending Cups Market, by Biodegradable Cups, By Region, 2017-2022 (US$ Mn)
TABLE 14 Global Vending Cups Market, by Biodegradable Cups, By Region, 2023-2030 (US$ Mn)
TABLE 15 Global Vending Cups Market, by Styrofoam Cups, By Region, 2017-2022 (US$ Mn)
TABLE 16 Global Vending Cups Market, by Styrofoam Cups, By Region, 2023-2030 (US$ Mn)
TABLE 17 Global Vending Cups Market, by Metal Cups, By Region, 2017-2022 (US$ Mn)
TABLE 18 Global Vending Cups Market, by Metal Cups, By Region, 2023-2030 (US$ Mn)
TABLE 19 Global Vending Cups Market, by Glass Cups, By Region, 2017-2022 (US$ Mn)
TABLE 20 Global Vending Cups Market, by Glass Cups, By Region, 2023-2030 (US$ Mn)
TABLE 21 Global Vending Cups Market, by Small Cups (Less than 8 ounces), By Region, 2017-2022 (US$ Mn)
TABLE 22 Global Vending Cups Market, by Small Cups (Less than 8 ounces), By Region, 2023-2030 (US$ Mn)
TABLE 23 Global Vending Cups Market, by Medium Cups (8 to 16 ounces), By Region, 2017-2022 (US$ Mn)
TABLE 24 Global Vending Cups Market, by Medium Cups (8 to 16 ounces), By Region, 2023-2030 (US$ Mn)
TABLE 25 Global Vending Cups Market, by Large Cups (More than 16 ounces), By Region, 2017-2022 (US$ Mn)
TABLE 26 Global Vending Cups Market, by Large Cups (More than 16 ounces), By Region, 2023-2030 (US$ Mn)
TABLE 27 Global Vending Cups Market, by Custom Sizes, By Region, 2017-2022 (US$ Mn)
TABLE 28 Global Vending Cups Market, by Custom Sizes, By Region, 2023-2030 (US$ Mn)
TABLE 29 Global Vending Cups Market, by Hot Beverage Cups, By Region, 2017-2022 (US$ Mn)
TABLE 30 Global Vending Cups Market, by Hot Beverage Cups, By Region, 2023-2030 (US$ Mn)
TABLE 31 Global Vending Cups Market, by Cold Beverage Cups, By Region, 2017-2022 (US$ Mn)
TABLE 32 Global Vending Cups Market, by Cold Beverage Cups, By Region, 2023-2030 (US$ Mn)
TABLE 33 Global Vending Cups Market, by Dual-Use Cups, By Region, 2017-2022 (US$ Mn)
TABLE 34 Global Vending Cups Market, by Dual-Use Cups, By Region, 2023-2030 (US$ Mn)
TABLE 35 Global Vending Cups Market, by Standard Lids, By Region, 2017-2022 (US$ Mn)
TABLE 36 Global Vending Cups Market, by Standard Lids, By Region, 2023-2030 (US$ Mn)
TABLE 37 Global Vending Cups Market, by Sip-Through Lids, By Region, 2017-2022 (US$ Mn)
TABLE 38 Global Vending Cups Market, by Sip-Through Lids, By Region, 2023-2030 (US$ Mn)
TABLE 39 Global Vending Cups Market, by Sealed Lids, By Region, 2017-2022 (US$ Mn)
TABLE 40 Global Vending Cups Market, by Sealed Lids, By Region, 2023-2030 (US$ Mn)
TABLE 41 Global Vending Cups Market, by Straw Slot Lids, By Region, 2017-2022 (US$ Mn)
TABLE 42 Global Vending Cups Market, by Straw Slot Lids, By Region, 2023-2030 (US$ Mn)
TABLE 43 Global Vending Cups Market, by Cup Jackets, By Region, 2017-2022 (US$ Mn)
TABLE 44 Global Vending Cups Market, by Cup Jackets, By Region, 2023-2030 (US$ Mn)
TABLE 45 Global Vending Cups Market, by Stirrer/Stick Holder Lids, By Region, 2017-2022 (US$ Mn)
TABLE 46 Global Vending Cups Market, by Stirrer/Stick Holder Lids, By Region, 2023-2030 (US$ Mn)
TABLE 47 Global Vending Cups Market, by Vending Machines, By Region, 2017-2022 (US$ Mn)
TABLE 48 Global Vending Cups Market, by Vending Machines, By Region, 2023-2030 (US$ Mn)
TABLE 49 Global Vending Cups Market, by Foodservice Providers, By Region, 2017-2022 (US$ Mn)
TABLE 50 Global Vending Cups Market, by Foodservice Providers, By Region, 2023-2030 (US$ Mn)
TABLE 51 Global Vending Cups Market, by Offices and Corporate Settings, By Region, 2017-2022 (US$ Mn)
TABLE 52 Global Vending Cups Market, by Offices and Corporate Settings, By Region, 2023-2030 (US$ Mn)
TABLE 53 Global Vending Cups Market, by Retail Outlets, By Region, 2017-2022 (US$ Mn)
TABLE 54 Global Vending Cups Market, by Retail Outlets, By Region, 2023-2030 (US$ Mn)
TABLE 55 Global Vending Cups Market, by Events and Conferences, By Region, 2017-2022 (US$ Mn)
TABLE 56 Global Vending Cups Market, by Events and Conferences, By Region, 2023-2030 (US$ Mn)
TABLE 57 Global Vending Cups Market, by Other Institutional Buyers, By Region, 2017-2022 (US$ Mn)
TABLE 58 Global Vending Cups Market, by Other Institutional Buyers, By Region, 2023-2030 (US$ Mn)
TABLE 59 Global Vending Cups Market, by Custom-Printed Cups, By Region, 2017-2022 (US$ Mn)
TABLE 60 Global Vending Cups Market, by Custom-Printed Cups, By Region, 2023-2030 (US$ Mn)
TABLE 61 Global Vending Cups Market, by Plain Cups, By Region, 2017-2022 (US$ Mn)
TABLE 62 Global Vending Cups Market, by Plain Cups, By Region, 2023-2030 (US$ Mn)
TABLE 63 Global Vending Cups Market, by Cup Type, 2017-2022 (US$ Mn)
TABLE 64 Global Vending Cups Market, by Cup Type, 2023-2030 (US$ Mn)
TABLE 65 Global Vending Cups Market, by Cup Size, 2017-2022 (US$ Mn)
TABLE 66 Global Vending Cups Market, by Cup Size, 2023-2030 (US$ Mn)
TABLE 67 Global Vending Cups Market, by Hot or Cold Beverage Cups, 2017-2022 (US$ Mn)
TABLE 68 Global Vending Cups Market, by Hot or Cold Beverage Cups, 2023-2030 (US$ Mn)
TABLE 69 Global Vending Cups Market, by Lid Type, 2017-2022 (US$ Mn)
TABLE 70 Global Vending Cups Market, by Lid Type, 2023-2030 (US$ Mn)
TABLE 71 Global Vending Cups Market, by End Users, 2017-2022 (US$ Mn)
TABLE 72 Global Vending Cups Market, by End Users, 2023-2030 (US$ Mn)
TABLE 73 Global Vending Cups Market, by Custom Printing and Branding, 2017-2022 (US$ Mn)
TABLE 74 Global Vending Cups Market, by Custom Printing and Branding, 2023-2030 (US$ Mn)
TABLE 75 Global Vending Cups Market, by Region, 2017-2022 (US$ Mn)
TABLE 76 Global Vending Cups Market, by Region, 2023-2030 (US$ Mn)
TABLE 77 North America Vending Cups Market, by Cup Type, 2017-2022 (US$ Mn)
TABLE 78 North America Vending Cups Market, by Cup Type, 2023-2030 (US$ Mn)
TABLE 79 North America Vending Cups Market, by Cup Size, 2017-2022 (US$ Mn)
TABLE 80 North America Vending Cups Market, by Cup Size, 2023-2030 (US$ Mn)
TABLE 81 North America Vending Cups Market, by Hot or Cold Beverage Cups, 2017-2022 (US$ Mn)
TABLE 82 North America Vending Cups Market, by Hot or Cold Beverage Cups, 2023-2030 (US$ Mn)
TABLE 83 North America Vending Cups Market, by Lid Type, 2017-2022 (US$ Mn)
TABLE 84 North America Vending Cups Market, by Lid Type, 2023-2030 (US$ Mn)
TABLE 85 North America Vending Cups Market, by End Users, 2017-2022 (US$ Mn)
TABLE 86 North America Vending Cups Market, by End Users, 2023-2030 (US$ Mn)
TABLE 87 North America Vending Cups Market, by Custom Printing and Branding, 2017-2022 (US$ Mn)
TABLE 88 North America Vending Cups Market, by Custom Printing and Branding, 2023-2030 (US$ Mn)
TABLE 89 North America Vending Cups Market, by Country, 2017-2022 (US$ Mn)
TABLE 90 North America Vending Cups Market, by Country, 2023-2030 (US$ Mn)
TABLE 91 United States Vending Cups Market, by Cup Type, 2017-2022 (US$ Mn)
TABLE 92 United States Vending Cups Market, by Cup Type, 2023-2030 (US$ Mn)
TABLE 93 United States Vending Cups Market, by Cup Size, 2017-2022 (US$ Mn)
TABLE 94 United States Vending Cups Market, by Cup Size, 2023-2030 (US$ Mn)
TABLE 95 United States Vending Cups Market, by Hot or Cold Beverage Cups, 2017-2022 (US$ Mn)
TABLE 96 United States Vending Cups Market, by Hot or Cold Beverage Cups, 2023-2030 (US$ Mn)
TABLE 97 United States Vending Cups Market, by Lid Type, 2017-2022 (US$ Mn)
TABLE 98 United States Vending Cups Market, by Lid Type, 2023-2030 (US$ Mn)
TABLE 99 United States Vending Cups Market, by End Users, 2017-2022 (US$ Mn)
TABLE 100 United States Vending Cups Market, by End Users, 2023-2030 (US$ Mn)
TABLE 101 United States Vending Cups Market, by Custom Printing and Branding, 2017-2022 (US$ Mn)
TABLE 102 United States Vending Cups Market, by Custom Printing and Branding, 2023-2030 (US$ Mn)
TABLE 103 Canada Vending Cups Market, by Cup Type, 2017-2022 (US$ Mn)
TABLE 104 Canada Vending Cups Market, by Cup Type, 2023-2030 (US$ Mn)
TABLE 105 Canada Vending Cups Market, by Cup Size, 2017-2022 (US$ Mn)
TABLE 106 Canada Vending Cups Market, by Cup Size, 2023-2030 (US$ Mn)
TABLE 107 Canada Vending Cups Market, by Hot or Cold Beverage Cups, 2017-2022 (US$ Mn)
TABLE 108 Canada Vending Cups Market, by Hot or Cold Beverage Cups, 2023-2030 (US$ Mn)
TABLE 109 Canada Vending Cups Market, by Lid Type, 2017-2022 (US$ Mn)
TABLE 110 Canada Vending Cups Market, by Lid Type, 2023-2030 (US$ Mn)
TABLE 111 Canada Vending Cups Market, by End Users, 2017-2022 (US$ Mn)
TABLE 112 Canada Vending Cups Market, by End Users, 2023-2030 (US$ Mn)
TABLE 113 Canada Vending Cups Market, by Custom Printing and Branding, 2017-2022 (US$ Mn)
TABLE 114 Canada Vending Cups Market, by Custom Printing and Branding, 2023-2030 (US$ Mn)
TABLE 115 Mexico Vending Cups Market, by Cup Type, 2017-2022 (US$ Mn)
TABLE 116 Mexico Vending Cups Market, by Cup Type, 2023-2030 (US$ Mn)
TABLE 117 Mexico Vending Cups Market, by Cup Size, 2017-2022 (US$ Mn)
TABLE 118 Mexico Vending Cups Market, by Cup Size, 2023-2030 (US$ Mn)
TABLE 119 Mexico Vending Cups Market, by Hot or Cold Beverage Cups, 2017-2022 (US$ Mn)
TABLE 120 Mexico Vending Cups Market, by Hot or Cold Beverage Cups, 2023-2030 (US$ Mn)
TABLE 121 Mexico Vending Cups Market, by Lid Type, 2017-2022 (US$ Mn)
TABLE 122 Mexico Vending Cups Market, by Lid Type, 2023-2030 (US$ Mn)
TABLE 123 Mexico Vending Cups Market, by End Users, 2017-2022 (US$ Mn)
TABLE 124 Mexico Vending Cups Market, by End Users, 2023-2030 (US$ Mn)
TABLE 125 Mexico Vending Cups Market, by Custom Printing and Branding, 2017-2022 (US$ Mn)
TABLE 126 Mexico Vending Cups Market, by Custom Printing and Branding, 2023-2030 (US$ Mn)
TABLE 127 Europe Vending Cups Market, by Cup Type, 2017-2022 (US$ Mn)
TABLE 128 Europe Vending Cups Market, by Cup Type, 2023-2030 (US$ Mn)
TABLE 129 Europe Vending Cups Market, by Cup Size, 2017-2022 (US$ Mn)
TABLE 130 Europe Vending Cups Market, by Cup Size, 2023-2030 (US$ Mn)
TABLE 131 Europe Vending Cups Market, by Hot or Cold Beverage Cups, 2017-2022 (US$ Mn)
TABLE 132 Europe Vending Cups Market, by Hot or Cold Beverage Cups, 2023-2030 (US$ Mn)
TABLE 133 Europe Vending Cups Market, by Lid Type, 2017-2022 (US$ Mn)
TABLE 134 Europe Vending Cups Market, by Lid Type, 2023-2030 (US$ Mn)
TABLE 135 Europe Vending Cups Market, by End Users, 2017-2022 (US$ Mn)
TABLE 136 Europe Vending Cups Market, by End Users, 2023-2030 (US$ Mn)
TABLE 137 Europe Vending Cups Market, by Custom Printing and Branding, 2017-2022 (US$ Mn)
TABLE 138 Europe Vending Cups Market, by Custom Printing and Branding, 2023-2030 (US$ Mn)
TABLE 139 Europe Vending Cups Market, by Country, 2017-2022 (US$ Mn)
TABLE 140 Europe Vending Cups Market, by Country, 2023-2030 (US$ Mn)
TABLE 141 Germany Vending Cups Market, by Cup Type, 2017-2022 (US$ Mn)
TABLE 142 Germany Vending Cups Market, by Cup Type, 2023-2030 (US$ Mn)
TABLE 143 Germany Vending Cups Market, by Cup Size, 2017-2022 (US$ Mn)
TABLE 144 Germany Vending Cups Market, by Cup Size, 2023-2030 (US$ Mn)
TABLE 145 Germany Vending Cups Market, by Hot or Cold Beverage Cups, 2017-2022 (US$ Mn)
TABLE 146 Germany Vending Cups Market, by Hot or Cold Beverage Cups, 2023-2030 (US$ Mn)
TABLE 147 Germany Vending Cups Market, by Lid Type, 2017-2022 (US$ Mn)
TABLE 148 Germany Vending Cups Market, by Lid Type, 2023-2030 (US$ Mn)
TABLE 149 Germany Vending Cups Market, by End Users, 2017-2022 (US$ Mn)
TABLE 150 Germany Vending Cups Market, by End Users, 2023-2030 (US$ Mn)
TABLE 151 Germany Vending Cups Market, by Custom Printing and Branding, 2017-2022 (US$ Mn)
TABLE 152 Germany Vending Cups Market, by Custom Printing and Branding, 2023-2030 (US$ Mn)
TABLE 153 France Vending Cups Market, by Cup Type, 2017-2022 (US$ Mn)
TABLE 154 France Vending Cups Market, by Cup Type, 2023-2030 (US$ Mn)
TABLE 155 France Vending Cups Market, by Cup Size, 2017-2022 (US$ Mn)
TABLE 156 France Vending Cups Market, by Cup Size, 2023-2030 (US$ Mn)
TABLE 157 France Vending Cups Market, by Hot or Cold Beverage Cups, 2017-2022 (US$ Mn)
TABLE 158 France Vending Cups Market, by Hot or Cold Beverage Cups, 2023-2030 (US$ Mn)
TABLE 159 France Vending Cups Market, by Lid Type, 2017-2022 (US$ Mn)
TABLE 160 France Vending Cups Market, by Lid Type, 2023-2030 (US$ Mn)
TABLE 161 France Vending Cups Market, by End Users, 2017-2022 (US$ Mn)
TABLE 162 France Vending Cups Market, by End Users, 2023-2030 (US$ Mn)
TABLE 163 France Vending Cups Market, by Custom Printing and Branding, 2017-2022 (US$ Mn)
TABLE 164 France Vending Cups Market, by Custom Printing and Branding, 2023-2030 (US$ Mn)
TABLE 165 United Kingdom Vending Cups Market, by Cup Type, 2017-2022 (US$ Mn)
TABLE 166 United Kingdom Vending Cups Market, by Cup Type, 2023-2030 (US$ Mn)
TABLE 167 United Kingdom Vending Cups Market, by Cup Size, 2017-2022 (US$ Mn)
TABLE 168 United Kingdom Vending Cups Market, by Cup Size, 2023-2030 (US$ Mn)
TABLE 169 United Kingdom Vending Cups Market, by Hot or Cold Beverage Cups, 2017-2022 (US$ Mn)
TABLE 170 United Kingdom Vending Cups Market, by Hot or Cold Beverage Cups, 2023-2030 (US$ Mn)
TABLE 171 United Kingdom Vending Cups Market, by Lid Type, 2017-2022 (US$ Mn)
TABLE 172 United Kingdom Vending Cups Market, by Lid Type, 2023-2030 (US$ Mn)
TABLE 173 United Kingdom Vending Cups Market, by End Users, 2017-2022 (US$ Mn)
TABLE 174 United Kingdom Vending Cups Market, by End Users, 2023-2030 (US$ Mn)
TABLE 175 United Kingdom Vending Cups Market, by Custom Printing and Branding, 2017-2022 (US$ Mn)
TABLE 176 United Kingdom Vending Cups Market, by Custom Printing and Branding, 2023-2030 (US$ Mn)
TABLE 177 Italy Vending Cups Market, by Cup Type, 2017-2022 (US$ Mn)
TABLE 178 Italy Vending Cups Market, by Cup Type, 2023-2030 (US$ Mn)
TABLE 179 Italy Vending Cups Market, by Cup Size, 2017-2022 (US$ Mn)
TABLE 180 Italy Vending Cups Market, by Cup Size, 2023-2030 (US$ Mn)
TABLE 181 Italy Vending Cups Market, by Hot or Cold Beverage Cups, 2017-2022 (US$ Mn)
TABLE 182 Italy Vending Cups Market, by Hot or Cold Beverage Cups, 2023-2030 (US$ Mn)
TABLE 183 Italy Vending Cups Market, by Lid Type, 2017-2022 (US$ Mn)
TABLE 184 Italy Vending Cups Market, by Lid Type, 2023-2030 (US$ Mn)
TABLE 185 Italy Vending Cups Market, by End Users, 2017-2022 (US$ Mn)
TABLE 186 Italy Vending Cups Market, by End Users, 2023-2030 (US$ Mn)
TABLE 187 Italy Vending Cups Market, by Custom Printing and Branding, 2017-2022 (US$ Mn)
TABLE 188 Italy Vending Cups Market, by Custom Printing and Branding, 2023-2030 (US$ Mn)
TABLE 189 Spain Vending Cups Market, by Cup Type, 2017-2022 (US$ Mn)
TABLE 190 Spain Vending Cups Market, by Cup Type, 2023-2030 (US$ Mn)
TABLE 191 Spain Vending Cups Market, by Cup Size, 2017-2022 (US$ Mn)
TABLE 192 Spain Vending Cups Market, by Cup Size, 2023-2030 (US$ Mn)
TABLE 193 Spain Vending Cups Market, by Hot or Cold Beverage Cups, 2017-2022 (US$ Mn)
TABLE 194 Spain Vending Cups Market, by Hot or Cold Beverage Cups, 2023-2030 (US$ Mn)
TABLE 195 Spain Vending Cups Market, by Lid Type, 2017-2022 (US$ Mn)
TABLE 196 Spain Vending Cups Market, by Lid Type, 2023-2030 (US$ Mn)
TABLE 197 Spain Vending Cups Market, by End Users, 2017-2022 (US$ Mn)
TABLE 198 Spain Vending Cups Market, by End Users, 2023-2030 (US$ Mn)
TABLE 199 Spain Vending Cups Market, by Custom Printing and Branding, 2017-2022 (US$ Mn)
TABLE 200 Spain Vending Cups Market, by Custom Printing and Branding, 2023-2030 (US$ Mn)
TABLE 201 Benelux Vending Cups Market, by Cup Type, 2017-2022 (US$ Mn)
TABLE 202 Benelux Vending Cups Market, by Cup Type, 2023-2030 (US$ Mn)
TABLE 203 Benelux Vending Cups Market, by Cup Size, 2017-2022 (US$ Mn)
TABLE 204 Benelux Vending Cups Market, by Cup Size, 2023-2030 (US$ Mn)
TABLE 205 Benelux Vending Cups Market, by Hot or Cold Beverage Cups, 2017-2022 (US$ Mn)
TABLE 206 Benelux Vending Cups Market, by Hot or Cold Beverage Cups, 2023-2030 (US$ Mn)
TABLE 207 Benelux Vending Cups Market, by Lid Type, 2017-2022 (US$ Mn)
TABLE 208 Benelux Vending Cups Market, by Lid Type, 2023-2030 (US$ Mn)
TABLE 209 Benelux Vending Cups Market, by End Users, 2017-2022 (US$ Mn)
TABLE 210 Benelux Vending Cups Market, by End Users, 2023-2030 (US$ Mn)
TABLE 211 Benelux Vending Cups Market, by Custom Printing and Branding, 2017-2022 (US$ Mn)
TABLE 212 Benelux Vending Cups Market, by Custom Printing and Branding, 2023-2030 (US$ Mn)
TABLE 213 Russia Vending Cups Market, by Cup Type, 2017-2022 (US$ Mn)
TABLE 214 Russia Vending Cups Market, by Cup Type, 2023-2030 (US$ Mn)
TABLE 215 Russia Vending Cups Market, by Cup Size, 2017-2022 (US$ Mn)
TABLE 216 Russia Vending Cups Market, by Cup Size, 2023-2030 (US$ Mn)
TABLE 217 Russia Vending Cups Market, by Hot or Cold Beverage Cups, 2017-2022 (US$ Mn)
TABLE 218 Russia Vending Cups Market, by Hot or Cold Beverage Cups, 2023-2030 (US$ Mn)
TABLE 219 Russia Vending Cups Market, by Lid Type, 2017-2022 (US$ Mn)
TABLE 220 Russia Vending Cups Market, by Lid Type, 2023-2030 (US$ Mn)
TABLE 221 Russia Vending Cups Market, by End Users, 2017-2022 (US$ Mn)
TABLE 222 Russia Vending Cups Market, by End Users, 2023-2030 (US$ Mn)
TABLE 223 Russia Vending Cups Market, by Custom Printing and Branding, 2017-2022 (US$ Mn)
TABLE 224 Russia Vending Cups Market, by Custom Printing and Branding, 2023-2030 (US$ Mn)
TABLE 225 Rest of Europe Vending Cups Market, by Cup Type, 2017-2022 (US$ Mn)
TABLE 226 Rest of Europe Vending Cups Market, by Cup Type, 2023-2030 (US$ Mn)
TABLE 227 Rest of Europe Vending Cups Market, by Cup Size, 2017-2022 (US$ Mn)
TABLE 228 Rest of Europe Vending Cups Market, by Cup Size, 2023-2030 (US$ Mn)
TABLE 229 Rest of Europe Vending Cups Market, by Hot or Cold Beverage Cups, 2017-2022 (US$ Mn)
TABLE 230 Rest of Europe Vending Cups Market, by Hot or Cold Beverage Cups, 2023-2030 (US$ Mn)
TABLE 231 Rest of Europe Vending Cups Market, by Lid Type, 2017-2022 (US$ Mn)
TABLE 232 Rest of Europe Vending Cups Market, by Lid Type, 2023-2030 (US$ Mn)
TABLE 233 Rest of Europe Vending Cups Market, by End Users, 2017-2022 (US$ Mn)
TABLE 234 Rest of Europe Vending Cups Market, by End Users, 2023-2030 (US$ Mn)
TABLE 235 Rest of Europe Vending Cups Market, by Custom Printing and Branding, 2017-2022 (US$ Mn)
TABLE 236 Rest of Europe Vending Cups Market, by Custom Printing and Branding, 2023-2030 (US$ Mn)
TABLE 237 Asia Pacific Vending Cups Market, by Cup Type, 2017-2022 (US$ Mn)
TABLE 238 Asia Pacific Vending Cups Market, by Cup Type, 2023-2030 (US$ Mn)
TABLE 239 Asia Pacific Vending Cups Market, by Cup Size, 2017-2022 (US$ Mn)
TABLE 240 Asia Pacific Vending Cups Market, by Cup Size, 2023-2030 (US$ Mn)
TABLE 241 Asia Pacific Vending Cups Market, by Hot or Cold Beverage Cups, 2017-2022 (US$ Mn)
TABLE 242 Asia Pacific Vending Cups Market, by Hot or Cold Beverage Cups, 2023-2030 (US$ Mn)
TABLE 243 Asia Pacific Vending Cups Market, by Lid Type, 2017-2022 (US$ Mn)
TABLE 244 Asia Pacific Vending Cups Market, by Lid Type, 2023-2030 (US$ Mn)
TABLE 245 Asia Pacific Vending Cups Market, by End Users, 2017-2022 (US$ Mn)
TABLE 246 Asia Pacific Vending Cups Market, by End Users, 2023-2030 (US$ Mn)
TABLE 247 Asia Pacific Vending Cups Market, by Custom Printing and Branding, 2017-2022 (US$ Mn)
TABLE 248 Asia Pacific Vending Cups Market, by Custom Printing and Branding, 2023-2030 (US$ Mn)
TABLE 249 China Vending Cups Market, by Cup Type, 2017-2022 (US$ Mn)
TABLE 250 China Vending Cups Market, by Cup Type, 2023-2030 (US$ Mn)
TABLE 251 China Vending Cups Market, by Cup Size, 2017-2022 (US$ Mn)
TABLE 252 China Vending Cups Market, by Cup Size, 2023-2030 (US$ Mn)
TABLE 253 China Vending Cups Market, by Hot or Cold Beverage Cups, 2017-2022 (US$ Mn)
TABLE 254 China Vending Cups Market, by Hot or Cold Beverage Cups, 2023-2030 (US$ Mn)
TABLE 255 China Vending Cups Market, by Lid Type, 2017-2022 (US$ Mn)
TABLE 256 China Vending Cups Market, by Lid Type, 2023-2030 (US$ Mn)
TABLE 257 China Vending Cups Market, by End Users, 2017-2022 (US$ Mn)
TABLE 258 China Vending Cups Market, by End Users, 2023-2030 (US$ Mn)
TABLE 259 China Vending Cups Market, by Custom Printing and Branding, 2017-2022 (US$ Mn)
TABLE 260 China Vending Cups Market, by Custom Printing and Branding, 2023-2030 (US$ Mn)
TABLE 261 Japan Vending Cups Market, by Cup Type, 2017-2022 (US$ Mn)
TABLE 262 Japan Vending Cups Market, by Cup Type, 2023-2030 (US$ Mn)
TABLE 263 Japan Vending Cups Market, by Cup Size, 2017-2022 (US$ Mn)
TABLE 264 Japan Vending Cups Market, by Cup Size, 2023-2030 (US$ Mn)
TABLE 265 Japan Vending Cups Market, by Hot or Cold Beverage Cups, 2017-2022 (US$ Mn)
TABLE 266 Japan Vending Cups Market, by Hot or Cold Beverage Cups, 2023-2030 (US$ Mn)
TABLE 267 Japan Vending Cups Market, by Lid Type, 2017-2022 (US$ Mn)
TABLE 268 Japan Vending Cups Market, by Lid Type, 2023-2030 (US$ Mn)
TABLE 269 Japan Vending Cups Market, by End Users, 2017-2022 (US$ Mn)
TABLE 270 Japan Vending Cups Market, by End Users, 2023-2030 (US$ Mn)
TABLE 271 Japan Vending Cups Market, by Custom Printing and Branding, 2017-2022 (US$ Mn)
TABLE 272 Japan Vending Cups Market, by Custom Printing and Branding, 2023-2030 (US$ Mn)
TABLE 273 India Vending Cups Market, by Cup Type, 2017-2022 (US$ Mn)
TABLE 274 India Vending Cups Market, by Cup Type, 2023-2030 (US$ Mn)
TABLE 275 India Vending Cups Market, by Cup Size, 2017-2022 (US$ Mn)
TABLE 276 India Vending Cups Market, by Cup Size, 2023-2030 (US$ Mn)
TABLE 277 India Vending Cups Market, by Hot or Cold Beverage Cups, 2017-2022 (US$ Mn)
TABLE 278 India Vending Cups Market, by Hot or Cold Beverage Cups, 2023-2030 (US$ Mn)
TABLE 279 India Vending Cups Market, by Lid Type, 2017-2022 (US$ Mn)
TABLE 280 India Vending Cups Market, by Lid Type, 2023-2030 (US$ Mn)
TABLE 281 India Vending Cups Market, by End Users, 2017-2022 (US$ Mn)
TABLE 282 India Vending Cups Market, by End Users, 2023-2030 (US$ Mn)
TABLE 283 India Vending Cups Market, by Custom Printing and Branding, 2017-2022 (US$ Mn)
TABLE 284 India Vending Cups Market, by Custom Printing and Branding, 2023-2030 (US$ Mn)
TABLE 285 South Korea Vending Cups Market, by Cup Type, 2017-2022 (US$ Mn)
TABLE 286 South Korea Vending Cups Market, by Cup Type, 2023-2030 (US$ Mn)
TABLE 287 South Korea Vending Cups Market, by Cup Size, 2017-2022 (US$ Mn)
TABLE 288 South Korea Vending Cups Market, by Cup Size, 2023-2030 (US$ Mn)
TABLE 289 South Korea Vending Cups Market, by Hot or Cold Beverage Cups, 2017-2022 (US$ Mn)
TABLE 290 South Korea Vending Cups Market, by Hot or Cold Beverage Cups, 2023-2030 (US$ Mn)
TABLE 291 South Korea Vending Cups Market, by Lid Type, 2017-2022 (US$ Mn)
TABLE 292 South Korea Vending Cups Market, by Lid Type, 2023-2030 (US$ Mn)
TABLE 293 South Korea Vending Cups Market, by End Users, 2017-2022 (US$ Mn)
TABLE 294 South Korea Vending Cups Market, by End Users, 2023-2030 (US$ Mn)
TABLE 295 South Korea Vending Cups Market, by Custom Printing and Branding, 2017-2022 (US$ Mn)
TABLE 296 South Korea Vending Cups Market, by Custom Printing and Branding, 2023-2030 (US$ Mn)
TABLE 297 South-East Asia Vending Cups Market, by Cup Type, 2017-2022 (US$ Mn)
TABLE 298 South-East Asia Vending Cups Market, by Cup Type, 2023-2030 (US$ Mn)
TABLE 299 South-East Asia Vending Cups Market, by Cup Size, 2017-2022 (US$ Mn)
TABLE 300 South-East Asia Vending Cups Market, by Cup Size, 2023-2030 (US$ Mn)
TABLE 301 South-East Asia Vending Cups Market, by Hot or Cold Beverage Cups, 2017-2022 (US$ Mn)
TABLE 302 South-East Asia Vending Cups Market, by Hot or Cold Beverage Cups, 2023-2030 (US$ Mn)
TABLE 303 South-East Asia Vending Cups Market, by Lid Type, 2017-2022 (US$ Mn)
TABLE 304 South-East Asia Vending Cups Market, by Lid Type, 2023-2030 (US$ Mn)
TABLE 305 South-East Asia Vending Cups Market, by End Users, 2017-2022 (US$ Mn)
TABLE 306 South-East Asia Vending Cups Market, by End Users, 2023-2030 (US$ Mn)
TABLE 307 South-East Asia Vending Cups Market, by Custom Printing and Branding, 2017-2022 (US$ Mn)
TABLE 308 South-East Asia Vending Cups Market, by Custom Printing and Branding, 2023-2030 (US$ Mn)
TABLE 309 Rest of Asia Pacific Vending Cups Market, by Cup Type, 2017-2022 (US$ Mn)
TABLE 310 Rest of Asia Pacific Vending Cups Market, by Cup Type, 2023-2030 (US$ Mn)
TABLE 311 Rest of Asia Pacific Vending Cups Market, by Cup Size, 2017-2022 (US$ Mn)
TABLE 312 Rest of Asia Pacific Vending Cups Market, by Cup Size, 2023-2030 (US$ Mn)
TABLE 313 Rest of Asia Pacific Vending Cups Market, by Hot or Cold Beverage Cups, 2017-2022 (US$ Mn)
TABLE 314 Rest of Asia Pacific Vending Cups Market, by Hot or Cold Beverage Cups, 2023-2030 (US$ Mn)
TABLE 315 Rest of Asia Pacific Vending Cups Market, by Lid Type, 2017-2022 (US$ Mn)
TABLE 316 Rest of Asia Pacific Vending Cups Market, by Lid Type, 2023-2030 (US$ Mn)
TABLE 317 Rest of Asia Pacific Vending Cups Market, by End Users, 2017-2022 (US$ Mn)
TABLE 318 Rest of Asia Pacific Vending Cups Market, by End Users, 2023-2030 (US$ Mn)
TABLE 319 Rest of Asia Pacific Vending Cups Market, by Custom Printing and Branding, 2017-2022 (US$ Mn)
TABLE 320 Rest of Asia Pacific Vending Cups Market, by Custom Printing and Branding, 2023-2030 (US$ Mn)
TABLE 321 Latin America Vending Cups Market, by Cup Type, 2017-2022 (US$ Mn)
TABLE 322 Latin America Vending Cups Market, by Cup Type, 2023-2030 (US$ Mn)
TABLE 323 Latin America Vending Cups Market, by Cup Size, 2017-2022 (US$ Mn)
TABLE 324 Latin America Vending Cups Market, by Cup Size, 2023-2030 (US$ Mn)
TABLE 325 Latin America Vending Cups Market, by Hot or Cold Beverage Cups, 2017-2022 (US$ Mn)
TABLE 326 Latin America Vending Cups Market, by Hot or Cold Beverage Cups, 2023-2030 (US$ Mn)
TABLE 327 Latin America Vending Cups Market, by Lid Type, 2017-2022 (US$ Mn)
TABLE 328 Latin America Vending Cups Market, by Lid Type, 2023-2030 (US$ Mn)
TABLE 329 Latin America Vending Cups Market, by End Users, 2017-2022 (US$ Mn)
TABLE 330 Latin America Vending Cups Market, by End Users, 2023-2030 (US$ Mn)
TABLE 331 Latin America Vending Cups Market, by Custom Printing and Branding, 2017-2022 (US$ Mn)
TABLE 332 Latin America Vending Cups Market, by Custom Printing and Branding, 2023-2030 (US$ Mn)
TABLE 333 Brazil Vending Cups Market, by Cup Type, 2017-2022 (US$ Mn)
TABLE 334 Brazil Vending Cups Market, by Cup Type, 2023-2030 (US$ Mn)
TABLE 335 Brazil Vending Cups Market, by Cup Size, 2017-2022 (US$ Mn)
TABLE 336 Brazil Vending Cups Market, by Cup Size, 2023-2030 (US$ Mn)
TABLE 337 Brazil Vending Cups Market, by Hot or Cold Beverage Cups, 2017-2022 (US$ Mn)
TABLE 338 Brazil Vending Cups Market, by Hot or Cold Beverage Cups, 2023-2030 (US$ Mn)
TABLE 339 Brazil Vending Cups Market, by Lid Type, 2017-2022 (US$ Mn)
TABLE 340 Brazil Vending Cups Market, by Lid Type, 2023-2030 (US$ Mn)
TABLE 341 Brazil Vending Cups Market, by End Users, 2017-2022 (US$ Mn)
TABLE 342 Brazil Vending Cups Market, by End Users, 2023-2030 (US$ Mn)
TABLE 343 Brazil Vending Cups Market, by Custom Printing and Branding, 2017-2022 (US$ Mn)
TABLE 344 Brazil Vending Cups Market, by Custom Printing and Branding, 2023-2030 (US$ Mn)
TABLE 345 Argentina Vending Cups Market, by Cup Type, 2017-2022 (US$ Mn)
TABLE 346 Argentina Vending Cups Market, by Cup Type, 2023-2030 (US$ Mn)
TABLE 347 Argentina Vending Cups Market, by Cup Size, 2017-2022 (US$ Mn)
TABLE 348 Argentina Vending Cups Market, by Cup Size, 2023-2030 (US$ Mn)
TABLE 349 Argentina Vending Cups Market, by Hot or Cold Beverage Cups, 2017-2022 (US$ Mn)
TABLE 350 Argentina Vending Cups Market, by Hot or Cold Beverage Cups, 2023-2030 (US$ Mn)
TABLE 351 Argentina Vending Cups Market, by Lid Type, 2017-2022 (US$ Mn)
TABLE 352 Argentina Vending Cups Market, by Lid Type, 2023-2030 (US$ Mn)
TABLE 353 Argentina Vending Cups Market, by End Users, 2017-2022 (US$ Mn)
TABLE 354 Argentina Vending Cups Market, by End Users, 2023-2030 (US$ Mn)
TABLE 355 Argentina Vending Cups Market, by Custom Printing and Branding, 2017-2022 (US$ Mn)
TABLE 356 Argentina Vending Cups Market, by Custom Printing and Branding, 2023-2030 (US$ Mn)
TABLE 357 Rest of Latin America Vending Cups Market, by Cup Type, 2017-2022 (US$ Mn)
TABLE 358 Rest of Latin America Vending Cups Market, by Cup Type, 2023-2030 (US$ Mn)
TABLE 359 Rest of Latin America Vending Cups Market, by Cup Size, 2017-2022 (US$ Mn)
TABLE 360 Rest of Latin America Vending Cups Market, by Cup Size, 2023-2030 (US$ Mn)
TABLE 361 Rest of Latin America Vending Cups Market, by Hot or Cold Beverage Cups, 2017-2022 (US$ Mn)
TABLE 362 Rest of Latin America Vending Cups Market, by Hot or Cold Beverage Cups, 2023-2030 (US$ Mn)
TABLE 363 Rest of Latin America Vending Cups Market, by Lid Type, 2017-2022 (US$ Mn)
TABLE 364 Rest of Latin America Vending Cups Market, by Lid Type, 2023-2030 (US$ Mn)
TABLE 365 Rest of Latin America Vending Cups Market, by End Users, 2017-2022 (US$ Mn)
TABLE 366 Rest of Latin America Vending Cups Market, by End Users, 2023-2030 (US$ Mn)
TABLE 367 Rest of Latin America Vending Cups Market, by Custom Printing and Branding, 2017-2022 (US$ Mn)
TABLE 368 Rest of Latin America Vending Cups Market, by Custom Printing and Branding, 2023-2030 (US$ Mn)
TABLE 369 Middle East Vending Cups Market, by Cup Type, 2017-2022 (US$ Mn)
TABLE 370 Middle East Vending Cups Market, by Cup Type, 2023-2030 (US$ Mn)
TABLE 371 Middle East Vending Cups Market, by Cup Size, 2017-2022 (US$ Mn)
TABLE 372 Middle East Vending Cups Market, by Cup Size, 2023-2030 (US$ Mn)
TABLE 373 Middle East Vending Cups Market, by Hot or Cold Beverage Cups, 2017-2022 (US$ Mn)
TABLE 374 Middle East Vending Cups Market, by Hot or Cold Beverage Cups, 2023-2030 (US$ Mn)
TABLE 375 Middle East Vending Cups Market, by Lid Type, 2017-2022 (US$ Mn)
TABLE 376 Middle East Vending Cups Market, by Lid Type, 2023-2030 (US$ Mn)
TABLE 377 Middle East Vending Cups Market, by End Users, 2017-2022 (US$ Mn)
TABLE 378 Middle East Vending Cups Market, by End Users, 2023-2030 (US$ Mn)
TABLE 379 Middle East Vending Cups Market, by Custom Printing and Branding, 2017-2022 (US$ Mn)
TABLE 380 Middle East Vending Cups Market, by Custom Printing and Branding, 2023-2030 (US$ Mn)
TABLE 381 UAE Vending Cups Market, by Cup Type, 2017-2022 (US$ Mn)
TABLE 382 UAE Vending Cups Market, by Cup Type, 2023-2030 (US$ Mn)
TABLE 383 UAE Vending Cups Market, by Cup Size, 2017-2022 (US$ Mn)
TABLE 384 UAE Vending Cups Market, by Cup Size, 2023-2030 (US$ Mn)
TABLE 385 UAE Vending Cups Market, by Hot or Cold Beverage Cups, 2017-2022 (US$ Mn)
TABLE 386 UAE Vending Cups Market, by Hot or Cold Beverage Cups, 2023-2030 (US$ Mn)
TABLE 387 UAE Vending Cups Market, by Lid Type, 2017-2022 (US$ Mn)
TABLE 388 UAE Vending Cups Market, by Lid Type, 2023-2030 (US$ Mn)
TABLE 389 UAE Vending Cups Market, by End Users, 2017-2022 (US$ Mn)
TABLE 390 UAE Vending Cups Market, by End Users, 2023-2030 (US$ Mn)
TABLE 391 UAE Vending Cups Market, by Custom Printing and Branding, 2017-2022 (US$ Mn)
TABLE 392 UAE Vending Cups Market, by Custom Printing and Branding, 2023-2030 (US$ Mn)
TABLE 393 Saudi Arabia Vending Cups Market, by Cup Type, 2017-2022 (US$ Mn)
TABLE 394 Saudi Arabia Vending Cups Market, by Cup Type, 2023-2030 (US$ Mn)
TABLE 395 Saudi Arabia Vending Cups Market, by Cup Size, 2017-2022 (US$ Mn)
TABLE 396 Saudi Arabia Vending Cups Market, by Cup Size, 2023-2030 (US$ Mn)
TABLE 397 Saudi Arabia Vending Cups Market, by Hot or Cold Beverage Cups, 2017-2022 (US$ Mn)
TABLE 398 Saudi Arabia Vending Cups Market, by Hot or Cold Beverage Cups, 2023-2030 (US$ Mn)
TABLE 399 Saudi Arabia Vending Cups Market, by Lid Type, 2017-2022 (US$ Mn)
TABLE 400 Saudi Arabia Vending Cups Market, by Lid Type, 2023-2030 (US$ Mn)
TABLE 401 Saudi Arabia Vending Cups Market, by End Users, 2017-2022 (US$ Mn)
TABLE 402 Saudi Arabia Vending Cups Market, by End Users, 2023-2030 (US$ Mn)
TABLE 403 Saudi Arabia Vending Cups Market, by Custom Printing and Branding, 2017-2022 (US$ Mn)
TABLE 404 Saudi Arabia Vending Cups Market, by Custom Printing and Branding, 2023-2030 (US$ Mn)
TABLE 405 Rest of Middle East Vending Cups Market, by Cup Type, 2017-2022 (US$ Mn)
TABLE 406 Rest of Middle East Vending Cups Market, by Cup Type, 2023-2030 (US$ Mn)
TABLE 407 Rest of Middle East Vending Cups Market, by Cup Size, 2017-2022 (US$ Mn)
TABLE 408 Rest of Middle East Vending Cups Market, by Cup Size, 2023-2030 (US$ Mn)
TABLE 409 Rest of Middle East Vending Cups Market, by Hot or Cold Beverage Cups, 2017-2022 (US$ Mn)
TABLE 410 Rest of Middle East Vending Cups Market, by Hot or Cold Beverage Cups, 2023-2030 (US$ Mn)
TABLE 411 Rest of Middle East Vending Cups Market, by Lid Type, 2017-2022 (US$ Mn)
TABLE 412 Rest of Middle East Vending Cups Market, by Lid Type, 2023-2030 (US$ Mn)
TABLE 413 Rest of Middle East Vending Cups Market, by End Users, 2017-2022 (US$ Mn)
TABLE 414 Rest of Middle East Vending Cups Market, by End Users, 2023-2030 (US$ Mn)
TABLE 415 Rest of Middle East Vending Cups Market, by Custom Printing and Branding, 2017-2022 (US$ Mn)
TABLE 416 Rest of Middle East Vending Cups Market, by Custom Printing and Branding, 2023-2030 (US$ Mn)
TABLE 417 Africa Vending Cups Market, by Cup Type, 2017-2022 (US$ Mn)
TABLE 418 Africa Vending Cups Market, by Cup Type, 2023-2030 (US$ Mn)
TABLE 419 Africa Vending Cups Market, by Cup Size, 2017-2022 (US$ Mn)
TABLE 420 Africa Vending Cups Market, by Cup Size, 2023-2030 (US$ Mn)
TABLE 421 Africa Vending Cups Market, by Hot or Cold Beverage Cups, 2017-2022 (US$ Mn)
TABLE 422 Africa Vending Cups Market, by Hot or Cold Beverage Cups, 2023-2030 (US$ Mn)
TABLE 423 Africa Vending Cups Market, by Lid Type, 2017-2022 (US$ Mn)
TABLE 424 Africa Vending Cups Market, by Lid Type, 2023-2030 (US$ Mn)
TABLE 425 Africa Vending Cups Market, by End Users, 2017-2022 (US$ Mn)
TABLE 426 Africa Vending Cups Market, by End Users, 2023-2030 (US$ Mn)
TABLE 427 Africa Vending Cups Market, by Custom Printing and Branding, 2017-2022 (US$ Mn)
TABLE 428 Africa Vending Cups Market, by Custom Printing and Branding, 2023-2030 (US$ Mn)
TABLE 429 South Africa Vending Cups Market, by Cup Type, 2017-2022 (US$ Mn)
TABLE 430 South Africa Vending Cups Market, by Cup Type, 2023-2030 (US$ Mn)
TABLE 431 South Africa Vending Cups Market, by Cup Size, 2017-2022 (US$ Mn)
TABLE 432 South Africa Vending Cups Market, by Cup Size, 2023-2030 (US$ Mn)
TABLE 433 South Africa Vending Cups Market, by Hot or Cold Beverage Cups, 2017-2022 (US$ Mn)
TABLE 434 South Africa Vending Cups Market, by Hot or Cold Beverage Cups, 2023-2030 (US$ Mn)
TABLE 435 South Africa Vending Cups Market, by Lid Type, 2017-2022 (US$ Mn)
TABLE 436 South Africa Vending Cups Market, by Lid Type, 2023-2030 (US$ Mn)
TABLE 437 South Africa Vending Cups Market, by End Users, 2017-2022 (US$ Mn)
TABLE 438 South Africa Vending Cups Market, by End Users, 2023-2030 (US$ Mn)
TABLE 439 South Africa Vending Cups Market, by Custom Printing and Branding, 2017-2022 (US$ Mn)
TABLE 440 South Africa Vending Cups Market, by Custom Printing and Branding, 2023-2030 (US$ Mn)
TABLE 441 Egypt Vending Cups Market, by Cup Type, 2017-2022 (US$ Mn)
TABLE 442 Egypt Vending Cups Market, by Cup Type, 2023-2030 (US$ Mn)
TABLE 443 Egypt Vending Cups Market, by Cup Size, 2017-2022 (US$ Mn)
TABLE 444 Egypt Vending Cups Market, by Cup Size, 2023-2030 (US$ Mn)
TABLE 445 Egypt Vending Cups Market, by Hot or Cold Beverage Cups, 2017-2022 (US$ Mn)
TABLE 446 Egypt Vending Cups Market, by Hot or Cold Beverage Cups, 2023-2030 (US$ Mn)
TABLE 447 Egypt Vending Cups Market, by Lid Type, 2017-2022 (US$ Mn)
TABLE 448 Egypt Vending Cups Market, by Lid Type, 2023-2030 (US$ Mn)
TABLE 449 Egypt Vending Cups Market, by End Users, 2017-2022 (US$ Mn)
TABLE 450 Egypt Vending Cups Market, by End Users, 2023-2030 (US$ Mn)
TABLE 451 Egypt Vending Cups Market, by Custom Printing and Branding, 2017-2022 (US$ Mn)
TABLE 452 Egypt Vending Cups Market, by Custom Printing and Branding, 2023-2030 (US$ Mn)
TABLE 453 Rest of Africa Vending Cups Market, by Cup Type, 2017-2022 (US$ Mn)
TABLE 454 Rest of Africa Vending Cups Market, by Cup Type, 2023-2030 (US$ Mn)
TABLE 455 Rest of Africa Vending Cups Market, by Cup Size, 2017-2022 (US$ Mn)
TABLE 456 Rest of Africa Vending Cups Market, by Cup Size, 2023-2030 (US$ Mn)
TABLE 457 Rest of Africa Vending Cups Market, by Hot or Cold Beverage Cups, 2017-2022 (US$ Mn)
TABLE 458 Rest of Africa Vending Cups Market, by Hot or Cold Beverage Cups, 2023-2030 (US$ Mn)
TABLE 459 Rest of Africa Vending Cups Market, by Lid Type, 2017-2022 (US$ Mn)
TABLE 460 Rest of Africa Vending Cups Market, by Lid Type, 2023-2030 (US$ Mn)
TABLE 461 Rest of Africa Vending Cups Market, by End Users, 2017-2022 (US$ Mn)
TABLE 462 Rest of Africa Vending Cups Market, by End Users, 2023-2030 (US$ Mn)
TABLE 463 Rest of Africa Vending Cups Market, by Custom Printing and Branding, 2017-2022 (US$ Mn)
TABLE 464 Rest of Africa Vending Cups Market, by Custom Printing and Branding, 2023-2030 (US$ Mn)