Market Overview
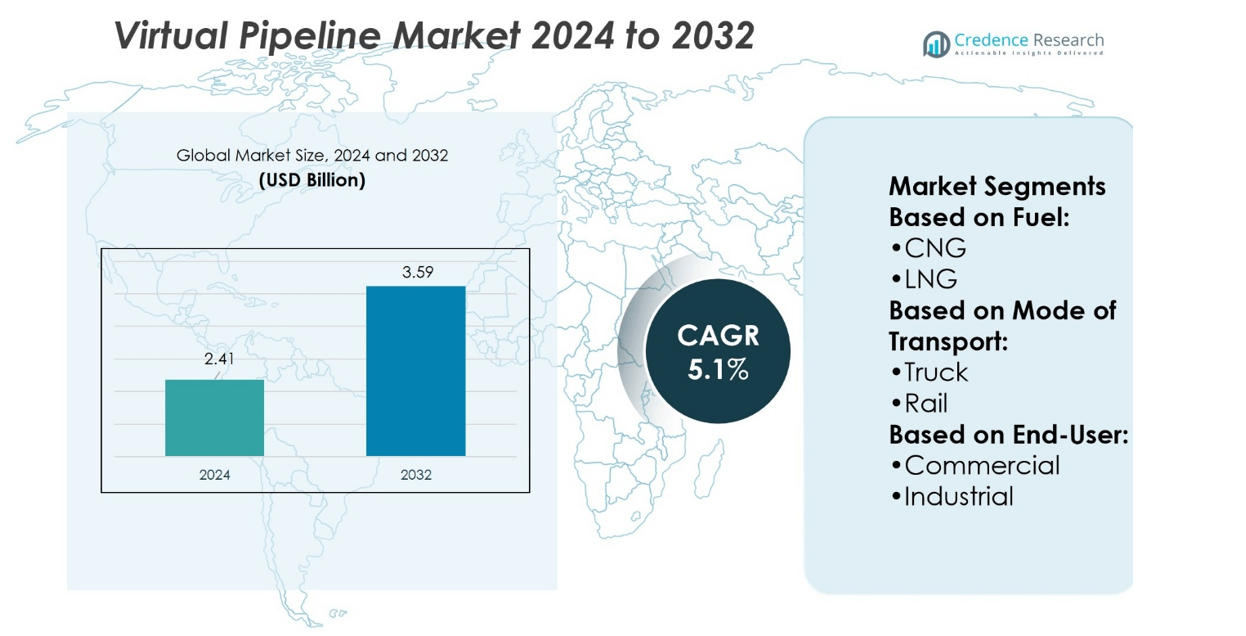
Virtual Pipeline Market size was valued at USD 2.41 billion in 2024 and is anticipated to reach USD 3.59 billion by 2032, at a CAGR of 5.1% during the forecast period.
| REPORT ATTRIBUTE |
DETAILS |
| Historical Period |
2020-2023 |
| Base Year |
2024 |
| Forecast Period |
2025-2032 |
| Virtual Pipeline Market Size 2024 |
USD 2.41 billion |
| Virtual Pipeline Market, CAGR |
5.1% |
| Virtual Pipeline Market Size 2032 |
USD 3.59 billion |
The Virtual Pipeline Market grows due to rising demand for flexible and cost-effective natural gas delivery to remote and off-grid locations. It enables efficient transport of LNG, CNG, and compressed gas through trucks, rail, ships, and barges, reducing reliance on traditional pipelines. Technological advancements in storage, compression, and real-time monitoring enhance safety, reliability, and operational efficiency. Industrial, commercial, and transportation sectors increasingly adopt virtual pipelines to meet growing energy needs. Government incentives and regulatory support for cleaner fuels further drive market expansion. Strategic collaborations and infrastructure investments strengthen supply networks, ensuring scalable and sustainable market growth.
North America and Asia-Pacific dominate the Virtual Pipeline Market, supported by robust industrial demand and infrastructure development. Europe shows steady growth driven by environmental regulations and cleaner fuel adoption. Latin America and the Middle East & Africa record emerging opportunities through off-grid energy distribution projects. Key players shaping the market include Hexagon Agility, Kinder Morgan, GasGrows Solutions Private Limited, Air Products and Chemicals, Inc., Galileo Technologies S.A., Petroliam Nasional Berhad (PETRONAS), FIBA Technologies, Inc., Gas Malaysia Virtual Pipeline Sdn. Bhd., NG Advantage LLC., and Snam SPA, Stabilis Solutions, Inc. Their strategic investments and technological innovations drive regional market expansion.
Market Insights
- Virtual Pipeline Market size was valued at USD 2.41 billion in 2024 and is anticipated to reach USD 3.59 billion by 2032, at a CAGR of 5.1% during the forecast period.
- Rising demand for flexible and cost-effective natural gas delivery to remote and off-grid locations drives market growth.
- Efficient transport of LNG, CNG, and compressed gas through trucks, rail, ships, and barges reduces reliance on traditional pipelines.
- Technological advancements in storage, compression, and real-time monitoring enhance safety, reliability, and operational efficiency.
- Industrial, commercial, and transportation sectors increasingly adopt virtual pipelines to meet growing energy needs.
- Regulatory support and government incentives for cleaner fuels encourage market expansion.
- North America and Asia-Pacific dominate, Europe shows steady growth, while Latin America and Middle East & Africa present emerging opportunities, supported by key players driving technological innovation and infrastructure investments.
Access crucial information at unmatched prices!
Request your sample report today & start making informed decisions powered by Credence Research Inc.!
Download Sample
Market Drivers
Rising Demand for Flexible and Cost-Effective Gas Transportation Solutions
The Virtual Pipeline Market benefits from growing demand for flexible natural gas transportation. Traditional pipelines require high capital investment and long construction timelines, whereas virtual pipelines offer rapid deployment. It enables suppliers to reach remote locations without extensive infrastructure. Companies gain efficiency by transporting compressed, liquefied, or CNG via trucks, ships, and rail. Governments support adoption to enhance energy security and meet local supply demands. The model reduces dependency on long-distance pipelines and mitigates geopolitical risks. Increased project feasibility attracts small and medium-scale energy suppliers.
- For instance, Hexagon Agility delivered its Mobile Pipeline® modules to customers globally, with over 2,100 units deployed by late 2024. The solution enables the transport of compressed natural gas (CNG) to remote industrial users who lack a traditional pipeline connection, helping them transition away from fuels like diesel or heating oil.
Technological Advancements Enhancing Transport Efficiency and Safety
Advances in compression, liquefaction, and monitoring technologies drive market growth. It ensures safe and efficient transport of natural gas over varying distances. Real-time monitoring systems minimize leakage risks and optimize delivery schedules. Automation reduces labor requirements and operational errors during loading and unloading. Innovations in storage containers improve capacity and portability, supporting larger-scale deployments. Companies adopting these technologies improve operational reliability and cost-efficiency. Continuous R&D strengthens market confidence in virtual pipeline solutions.
- For instance, Kinder Morgan completed upgrades at its Elba Liquefaction facility, expanding its modular liquefaction capacity to 2.5 million tonnes per year. The facility uses advanced monitoring technologies to enhance operations and detect potential issues.
Expansion of Energy Infrastructure in Remote and Emerging Regions
Remote regions and emerging economies increasingly adopt virtual pipelines to meet growing energy demand. It enables access to gas resources where conventional pipelines are impractical. Governments invest in energy infrastructure to improve regional connectivity and reduce energy poverty. Industrial, commercial, and residential sectors benefit from reliable gas supply. Market players expand their logistics networks to serve off-grid locations efficiently. Strategic collaborations with local distributors enhance market penetration. Infrastructure expansion drives long-term adoption and operational scalability.
Regulatory Support and Environmental Benefits Encouraging Market Adoption
Supportive policies promote virtual pipelines to reduce carbon footprint and energy transportation risks. It aligns with government goals for cleaner and more sustainable energy distribution. Regulations encourage adoption of LNG, CNG, and compressed gas transport to minimize emissions. Companies benefit from incentives for eco-friendly energy projects and technology deployment. Enhanced safety standards ensure compliance and reduce operational hazards. Environmental sustainability drives corporate investment decisions toward virtual pipeline systems. Market growth reflects the alignment of economic and ecological objectives.
Market Trends
Integration of Advanced Monitoring and Automation Systems Driving Operational Excellence
The Virtual Pipeline Market experiences growth through advanced monitoring and automation adoption. It allows precise tracking of gas flow, pressure, and temperature across transport routes. Companies leverage IoT sensors and cloud-based platforms to optimize delivery schedules. Predictive maintenance reduces equipment downtime and operational disruptions. Automation improves safety during loading, unloading, and transportation. These technologies enhance efficiency and lower overall operational costs. Continuous system upgrades strengthen market confidence in virtual pipeline solutions.
- For instance,Galileo deployed nine Cryobox units in Mendoza, Argentina, achieving liquefaction of 120 tons per day of LNG to power a 40 MW thermal plant.
Rising Adoption of LNG, CNG, and Compressed Gas Solutions for Flexible Supply
Market trends indicate a shift toward diverse gas transport forms, including LNG and CNG. It provides flexibility to deliver energy to regions without pipeline access. Transport via trucks, ships, and rail ensures timely supply to industrial, commercial, and residential sectors. Companies increasingly invest in mobile storage solutions to handle varying demand. Environmental regulations favor low-emission alternatives, boosting adoption rates. Integration of compressed gas solutions reduces logistical challenges in remote and emerging markets. Market players innovate to enhance storage efficiency and safety standards.
- For instance, NG Advantage has delivered billions of cubic feet of CNG across the Northeast since its inception. The company was the first U.S. operator to deploy four of Hexagon Lincoln’s TITAN® XL trailers, which offer 45% more capacity than previous models.
Expansion of Off-Grid Energy Distribution Networks Supporting Market Growth
Remote and underserved regions drive the adoption of virtual pipeline infrastructure. It enables energy distribution to off-grid industrial zones and residential communities. Market players establish regional logistics networks to ensure seamless delivery. Partnerships with local distributors strengthen market penetration. Increasing government focus on energy accessibility fuels infrastructure investments. Industrial users benefit from continuous supply without reliance on fixed pipelines. The trend encourages scalable solutions that adapt to regional energy needs.
Collaborative Projects and Strategic Partnerships Advancing Market Reach
Collaborations between energy producers, logistics providers, and technology firms shape market trends. It allows joint development of transportation solutions and expansion into new geographies. Companies leverage partner networks to improve operational efficiency and reduce costs. Shared investments in R&D foster technological innovation and capacity enhancement. Strategic alliances accelerate adoption of virtual pipeline systems across industrial and commercial sectors. Market participants focus on long-term partnerships to strengthen competitive positioning. Trend analysis indicates sustained growth through cooperative strategies.
Market Challenges Analysis
High Capital Investment and Operational Complexity Limiting Widespread Adoption
The Virtual Pipeline Market faces challenges from significant upfront capital requirements for storage, transport, and handling equipment. It demands specialized infrastructure, including LNG/CNG compressors, cryogenic tanks, and mobile transport vehicles. Smaller companies often struggle to invest in such systems, limiting market participation. Operational complexity increases with multi-modal transport involving trucks, rail, and ships. Companies must ensure strict adherence to safety standards during loading, transport, and unloading. Skilled labor and technical expertise are essential to maintain efficiency and prevent accidents. These factors slow large-scale deployment in emerging and remote regions.
Regulatory Compliance and Environmental Constraints Hindering Market Expansion
Strict regulations on gas transport and environmental safety pose challenges for market growth. It requires companies to comply with local, national, and international standards for emissions, storage, and pipeline alternatives. Delays in obtaining permits and certifications can disrupt project timelines. Environmental concerns regarding leakage and spill risks necessitate continuous monitoring and contingency planning. Market participants must invest in eco-friendly technologies to meet sustainability targets. Regulatory inconsistencies across regions complicate cross-border operations and logistics. Overcoming these compliance and environmental hurdles remains critical for the market’s long-term growth.
Market Opportunities
Growing Demand for Energy Access in Remote and Emerging Regions Creating New Opportunities
The Virtual Pipeline Market benefits from rising energy demand in off-grid and remote locations. It enables delivery of natural gas to industrial, commercial, and residential sectors without relying on fixed pipeline infrastructure. Companies can deploy mobile LNG, CNG, and compressed gas solutions to address regional supply gaps. Governments in emerging economies support initiatives that improve energy accessibility and reduce reliance on imported fuels. Expanding industrial zones and urbanization further drive demand for flexible gas transport. Market players can establish regional logistics networks to serve underserved areas efficiently. Opportunities exist to develop scalable solutions tailored to local energy requirements.
Technological Innovation and Strategic Partnerships Unlocking Market Expansion Potential
Advancements in storage, compression, and monitoring technologies create growth opportunities for virtual pipelines. It enhances operational efficiency, safety, and delivery reliability. Companies adopting automated systems and real-time tracking improve cost-effectiveness and reduce risks. Strategic collaborations between energy producers, logistics providers, and technology firms expand market reach and service capabilities. Investment in eco-friendly transport solutions aligns with sustainability trends, attracting government incentives. Market participants can leverage joint ventures to enter new geographies and optimize supply chains. Innovation-driven strategies strengthen competitive positioning and long-term adoption potential.
Market Segmentation Analysis:
By Fuel
The Virtual Pipeline Market includes major segmentation by fuel type, primarily CNG and LNG. It enables energy suppliers to choose solutions based on regional infrastructure, demand, and storage capabilities. CNG dominates short-distance and smaller-scale operations due to lower handling complexity and cost. LNG offers higher energy density, supporting long-distance transport and bulk supply requirements. Companies invest in specialized storage tanks and compressors to ensure safe, efficient fuel delivery. Rising adoption of low-emission fuels encourages the expansion of both CNG and LNG solutions. Fuel type selection influences operational efficiency, cost management, and regional market penetration.
- For instance, Snam operates an extensive network of over 40,000 km of gas pipelines across Italy and abroad. It manages 12 storage sites with a total capacity of approximately 18 billion cubic meters (BCM), reflecting recent infrastructure expansions.
By Mode of Transport
Transport modes form a critical segment in the Virtual Pipeline Market, enabling flexible and scalable energy distribution. It relies on trucks for short-haul delivery to industrial sites and residential areas lacking pipeline access. Rail transport supports medium to long distances with larger volumes, ensuring reliable supply for regional distribution. Ships and barges allow inter-regional and international transport of LNG, providing access to markets separated by water bodies. Companies adopt multi-modal strategies to optimize delivery times, reduce operational risks, and maintain continuous supply. Investments in specialized transport infrastructure and safety equipment strengthen market reliability. Mode selection impacts operational logistics, efficiency, and market coverage.
- For instance, Tesla Energy delivered 31.4 GWh of battery energy storage products over double the previous year’s output and equating to enabling distributed energy delivery without traditional pipelines.
By End User
End-user segmentation reflects the diverse applications of virtual pipelines across sectors. It caters to industrial users requiring consistent natural gas supply for manufacturing, power generation, and processing operations. Commercial users, including retail and institutional establishments, benefit from on-demand energy delivery without reliance on fixed pipelines. Transportation sectors adopt CNG and LNG for fleet fueling, reducing emissions and operational costs. Companies design service models to meet specific consumption patterns and regulatory standards of each end-user segment. Customization of storage, transport, and scheduling ensures reliability and scalability. End-user segmentation drives market strategy, technological adoption, and revenue generation potential.
Segments:
Based on Fuel:
Based on Mode of Transport:
Based on End-User:
Based on the Geography:
- North America
- Europe
- UK
- France
- Germany
- Italy
- Spain
- Russia
- Belgium
- Netherlands
- Austria
- Sweden
- Poland
- Denmark
- Switzerland
- Rest of Europe
- Asia Pacific
- China
- Japan
- South Korea
- India
- Australia
- Thailand
- Indonesia
- Vietnam
- Malaysia
- Philippines
- Taiwan
- Rest of Asia Pacific
- Latin America
- Brazil
- Argentina
- Peru
- Chile
- Colombia
- Rest of Latin America
- Middle East
- UAE
- KSA
- Israel
- Turkey
- Iran
- Rest of Middle East
- Africa
- Egypt
- Nigeria
- Algeria
- Morocco
- Rest of Africa
Regional Analysis
North America
North America holds a dominant share of 35% in the Virtual Pipeline Market, driven by robust energy infrastructure and high adoption of alternative gas transport solutions. It benefits from increasing demand for natural gas in industrial, commercial, and transportation sectors. It enables energy delivery to remote locations without extensive pipeline networks, supporting regional energy security. Companies leverage advanced storage, compression, and monitoring technologies to ensure safe and efficient operations. Strong government regulations and incentives promote LNG and CNG usage, enhancing market growth. North American players invest heavily in logistics and multi-modal transport solutions, including trucks, rail, and barges. Rising focus on decarbonization and cleaner fuels further strengthens market adoption across the region.
Europe
Europe accounts for 25% of the global market share, supported by strict environmental regulations and energy diversification initiatives. It encourages the adoption of virtual pipelines to reduce reliance on traditional pipelines and imported energy. It enables efficient transport of LNG and CNG to industrial zones, remote commercial areas, and transportation fleets. Market players deploy advanced technologies for real-time monitoring, automated operations, and safety compliance. Government incentives for low-emission fuel usage drive investment in CNG and LNG infrastructure. Companies expand regional networks to enhance supply reliability and reduce operational risks. Growing industrialization and urban energy demand sustain continuous market expansion across Europe.
Asia-Pacific
Asia-Pacific contributes 28% of the Virtual Pipeline Market share, reflecting rapid industrial growth and increasing energy consumption. It supports delivery of natural gas to off-grid industrial areas and urban centers lacking pipeline connectivity. It enables flexible transport solutions through trucks, rail, and barges to meet growing demand. Regional governments invest in LNG import terminals, storage facilities, and multi-modal transport infrastructure. Companies focus on scalable logistics solutions and advanced safety systems to handle bulk deliveries. Rising adoption of virtual pipelines addresses energy access gaps in emerging economies. Market growth is further accelerated by urbanization, industrial expansion, and government initiatives promoting cleaner fuels.
Latin America
Latin America holds 7% of the market share, driven by emerging infrastructure development and increasing industrial gas demand. It enables energy distribution to remote industrial and commercial sites without relying on conventional pipelines. Companies invest in mobile storage units and multi-modal transport to enhance regional connectivity. Government support and incentives encourage adoption of LNG and CNG solutions. It helps reduce dependency on imported energy while meeting rising urban and industrial consumption. Strategic partnerships and collaborations strengthen market penetration. Increasing awareness of sustainable energy solutions further supports virtual pipeline deployment.
Middle East & Africa
Middle East & Africa accounts for 5% of the global market share, reflecting early-stage adoption and infrastructure expansion. It enables delivery of natural gas to remote regions and industrial clusters lacking pipeline networks. Companies invest in LNG/CNG storage and transport infrastructure to overcome logistical challenges. Government initiatives promote cleaner fuel use and energy diversification, supporting market growth. It facilitates access to industrial, commercial, and transportation end users across diverse geographies. Market participants explore partnerships and technology deployment to improve efficiency and reliability. Regional expansion offers long-term growth potential in energy access and sustainable distribution.
Shape Your Report to Specific Countries or Regions & Enjoy 30% Off!
Key Player Analysis
- Hexagon Agility
- Kinder Morgan
- GasGrows Solutions Private Limited
- Air Products and Chemicals, Inc.
- Galileo Technologies S.A.
- Petroliam Nasional Berhad (PETRONAS)
- FIBA Technologies, Inc.
- Gas Malaysia Virtual Pipeline Sdn. Bhd.
- NG Advantage LLC.
- Snam SPA, Stabilis Solutions, Inc.
Competitive Analysis
The Virtual Pipeline Market players such as Hexagon Agility, Kinder Morgan, GasGrows Solutions Private Limited, Air Products and Chemicals, Inc., Galileo Technologies S.A., Petroliam Nasional Berhad (PETRONAS), FIBA Technologies, Inc., Gas Malaysia Virtual Pipeline Sdn. Bhd., NG Advantage LLC., Snam SPA, Stabilis Solutions, Inc. The Virtual Pipeline Market remains highly competitive, driven by technological innovation, infrastructure expansion, and operational efficiency. It relies on advanced storage, compression, and monitoring systems to ensure safe and reliable gas transport. Multi-modal delivery through trucks, rail, ships, and barges enables energy distribution to remote industrial, commercial, and transportation sectors. Companies focus on optimizing logistics networks to reduce costs and improve supply reliability. Safety and regulatory compliance remain critical, with automated systems and real-time monitoring minimizing operational risks. Adoption of cleaner fuels, including LNG and CNG, aligns with global sustainability goals. Continuous investments in R&D enhance scalability, storage capacity, and delivery efficiency, supporting market growth and long-term competitiveness.
Recent Developments
- In July 2025, Tesla announced to sell of its first virtual power plant (VPP) in South Australia, a region with significant grid reliability issues and high electricity costs. Tesla has a strong presence in Australia, having previously launched major energy projects like the “big battery” initiative to stabilize the grid.
- In March 2025, Pacific Gas and Electric launched the Seasonal Aggregation of Versatile Energy program, connecting 1,500 residential batteries and 400 smart panels to support summer-peak reliability, with 60% enrollment from low-income households.
- In November 2024, NRG Energy Inc. announced a partnership with Renew Home, a prominent VPP company, to enhance its residential VPP capabilities. The collaboration aims to distribute numerous VPP-powered smart thermostats by 2035 and develop an approximately 1 GW AI-powered VPP, supported by Google Cloud technology.
- In March 2023, Eaton, a power management company, expanded its strategic partnership with Sunverge to help utilities manage residential electric vehicle charging infrastructure. The partnership would bring together Eaton’s innovative EV charging solutions and Sunverge’s intelligent, advanced, and real-time multi-service VPP platform.
Report Coverage
The research report offers an in-depth analysis based on Fuel, Mode of Transport, End-User and Geography. It details leading market players, providing an overview of their business, product offerings, investments, revenue streams, and key applications. Additionally, the report includes insights into the competitive environment, SWOT analysis, current market trends, as well as the primary drivers and constraints. Furthermore, it discusses various factors that have driven market expansion in recent years. The report also explores market dynamics, regulatory scenarios, and technological advancements that are shaping the industry. It assesses the impact of external factors and global economic changes on market growth. Lastly, it provides strategic recommendations for new entrants and established companies to navigate the complexities of the market.
Future Outlook
- The market will expand with rising demand for off-grid natural gas supply.
- Adoption of LNG and CNG transport solutions will increase across industries.
- Multi-modal transport via trucks, rail, ships, and barges will become more efficient.
- Advanced monitoring and automation will enhance operational safety and reliability.
- Investments in storage and compression infrastructure will support market scalability.
- Governments will promote cleaner fuel adoption through supportive policies.
- Remote and emerging regions will drive significant growth opportunities.
- Strategic partnerships will enable market players to enter new geographies.
- Technological innovation will reduce operational costs and improve delivery speed.
- Sustainability and low-emission initiatives will strengthen long-term market adoption.


